| Param | Original file | Final file |
|---|---|---|
| Filename | modeM0/AS1G05_045T01_9000000468_03560cztM0_level2.evt | modeM0/AS1G05_045T01_9000000468_03560cztM0_level2_quad_clean.evt |
| Size (bytes) | 417,634,560 | 76,800,960 |
| Size | 398.3 MB | 73.2 MB |
| Events in quadrant A | 2,641,262 | 493,064 |
| Events in quadrant B | 3,621,906 | 486,221 |
| Events in quadrant C | 3,191,927 | 481,842 |
| Events in quadrant D | 2,807,924 | 468,436 |
| Mode M0 | |||
|---|---|---|---|
| Quadrant | BADHDUFLAG | Total packets | Discarded packets |
| A | 0 | 11706 | 2 |
| B | 0 | 14671 | 1 |
| C | 0 | 13171 | 1 |
| D | 0 | 12313 | 1 |
| Mode M9 | |||
|---|---|---|---|
| Quadrant | BADHDUFLAG | Total packets | Discarded packets |
| A | 0 | 12 | 0 |
| B | 0 | 12 | 0 |
| C | 0 | 12 | 0 |
| D | 0 | 12 | 0 |
| Mode SS | |||
|---|---|---|---|
| Quadrant | BADHDUFLAG | Total packets | Discarded packets |
| A | 0 | 116 | 0 |
| B | 0 | 116 | 0 |
| C | 0 | 116 | 0 |
| D | 0 | 116 | 0 |
| Quadrant | Total seconds | Saturated seconds | Saturation percentage |
|---|---|---|---|
| A | 5660 | 93 | 1.643110% |
| B | 5660 | 98 | 1.731449% |
| C | 5660 | 84 | 1.484099% |
| D | 5660 | 134 | 2.367491% |
Noise dominated data is calculated using 1-second bins in cleaned event files. If a bin has >2000 counts, and if more than 50% of those come from <1% of pixels, then it is considered to be noise-dominated and hence unusable.
| Quadrant | # 1 sec bins | Bins with >0 counts | Bins with >2000 counts | High rate bins dominated by noise | Noise dominated (total time) | Noise dominated (detector-on time) | Marked lightcurve |
|---|---|---|---|---|---|---|---|
| A | 6920 | 5660 | 0 | 0 | 0.00% | 0.00% | 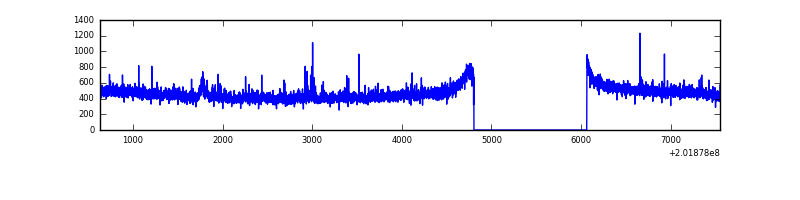 |
| B | 6920 | 5660 | 6 | 6 | 0.09% | 0.11% | 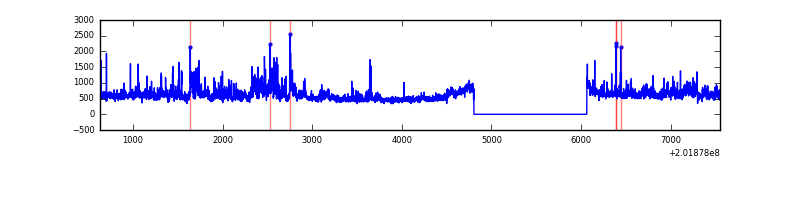 |
| C | 6920 | 5660 | 8 | 8 | 0.12% | 0.14% | 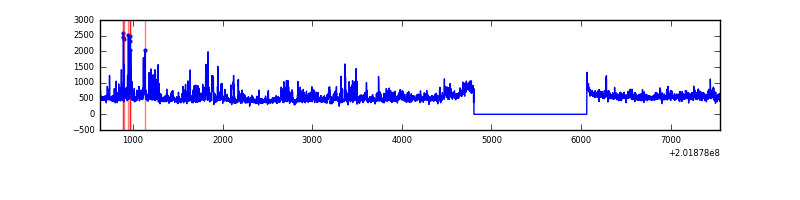 |
| D | 6920 | 5660 | 58 | 58 | 0.84% | 1.02% | 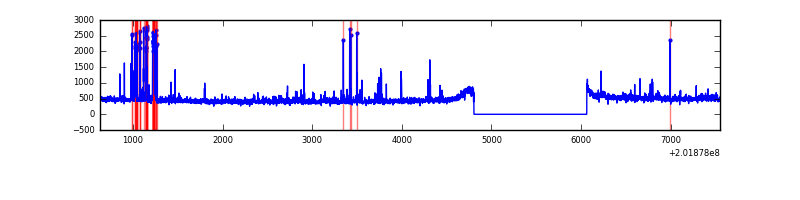 |
Top three noisy pixels from each quadrant. If the there are fewer than three noisy pixels in the level2.evt file, extra rows are filled as -1
| Pixel properties | Quadrant properties | ||||||
|---|---|---|---|---|---|---|---|
| Quadrant | DetID | PixID | Counts | Sigma | Mean | Median | Sigma |
| A | 0 | 118 | 19671 | 138.64 | 677 | 663 | 137.1 |
| A | 0 | 226 | 8903 | 60.1 | 677 | 663 | 137.1 |
| A | 12 | 194 | 7380 | 48.99 | 677 | 663 | 137.1 |
| B | 15 | 204 | 710676 | 5487.55 | 681 | 664 | 129.4 |
| B | 14 | 167 | 89100 | 683.5 | 681 | 664 | 129.4 |
| B | 0 | 182 | 39728 | 301.92 | 681 | 664 | 129.4 |
| C | 15 | 208 | 599151 | 3927.85 | 660 | 664 | 152.4 |
| C | 1 | 16 | 8166 | 49.24 | 660 | 664 | 152.4 |
| C | 13 | 61 | 5688 | 32.97 | 660 | 664 | 152.4 |
| D | 7 | 39 | 94318 | 592.55 | 661 | 644 | 158.1 |
| D | 4 | 160 | 80853 | 507.38 | 661 | 644 | 158.1 |
| D | 5 | 233 | 41412 | 257.89 | 661 | 644 | 158.1 |
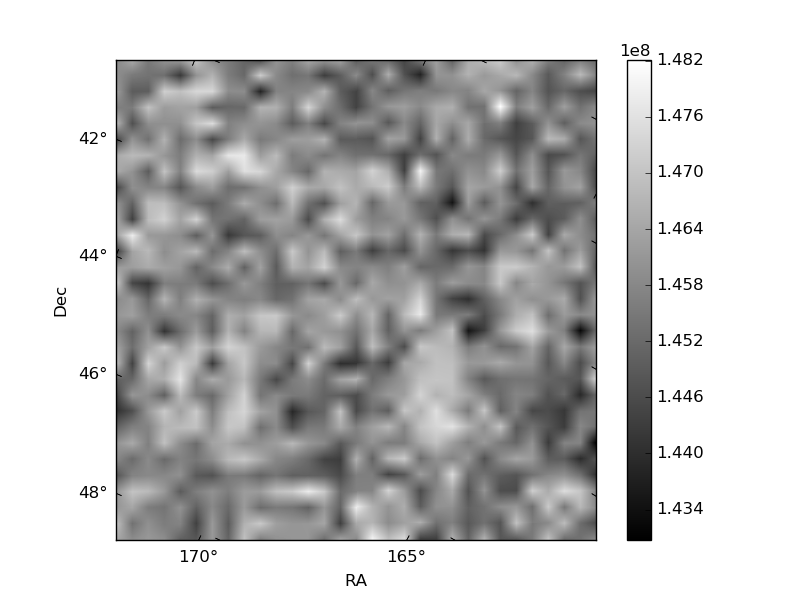
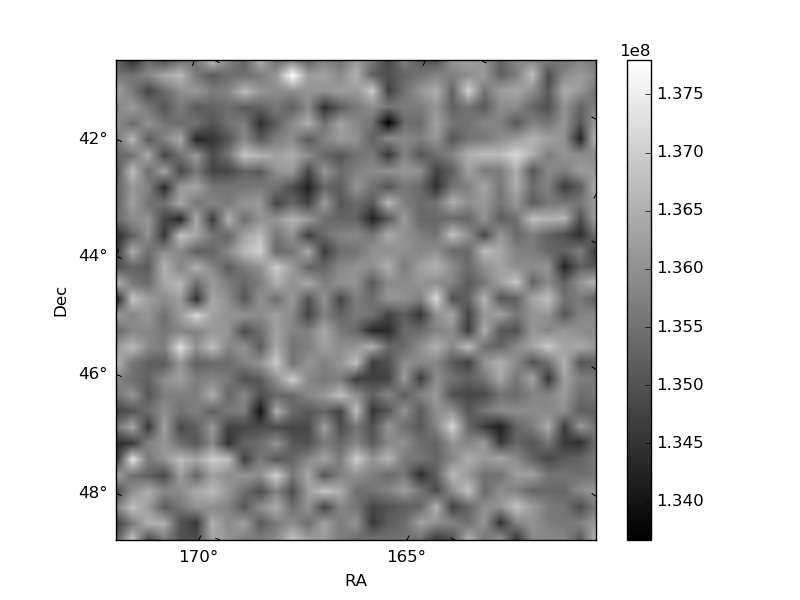
Histogram calculated using DETX and DETY for each event in the final _common_clean file
| Quadrant A | 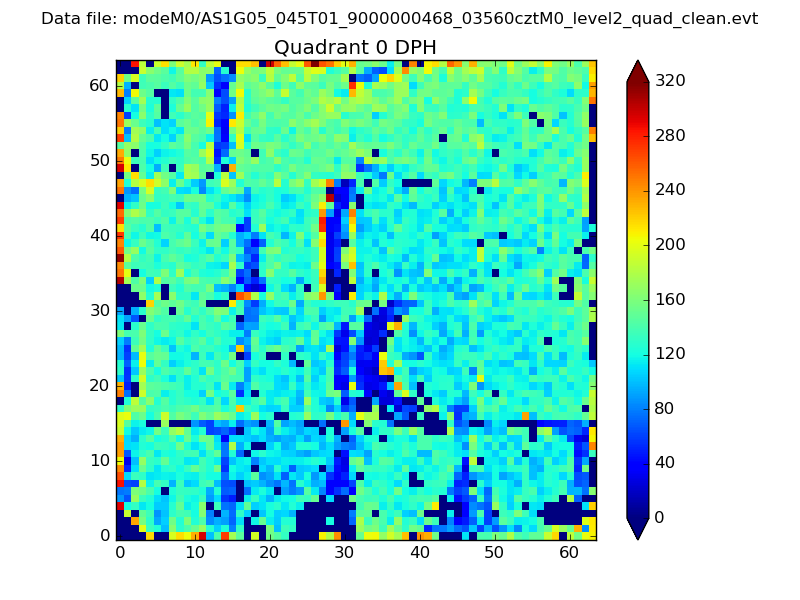 |
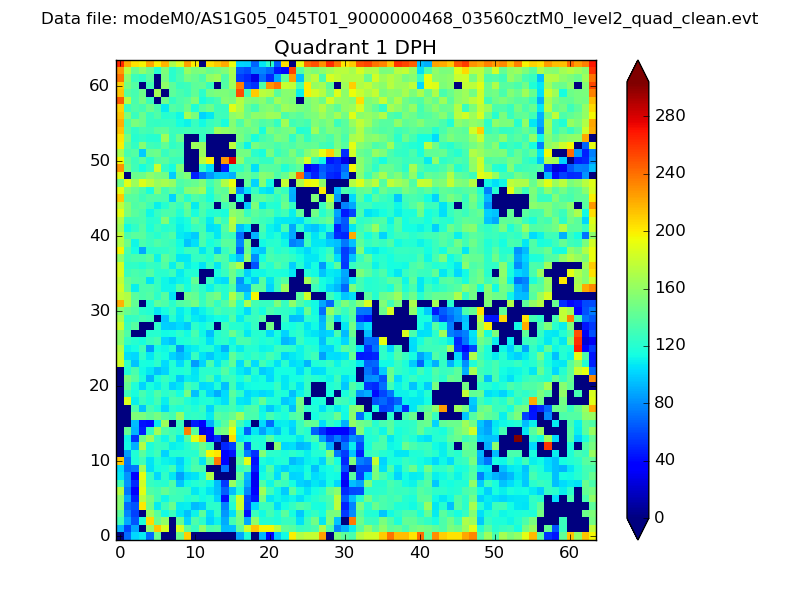 |
Quadrant B |
|---|---|---|---|
| Quadrant D |  |
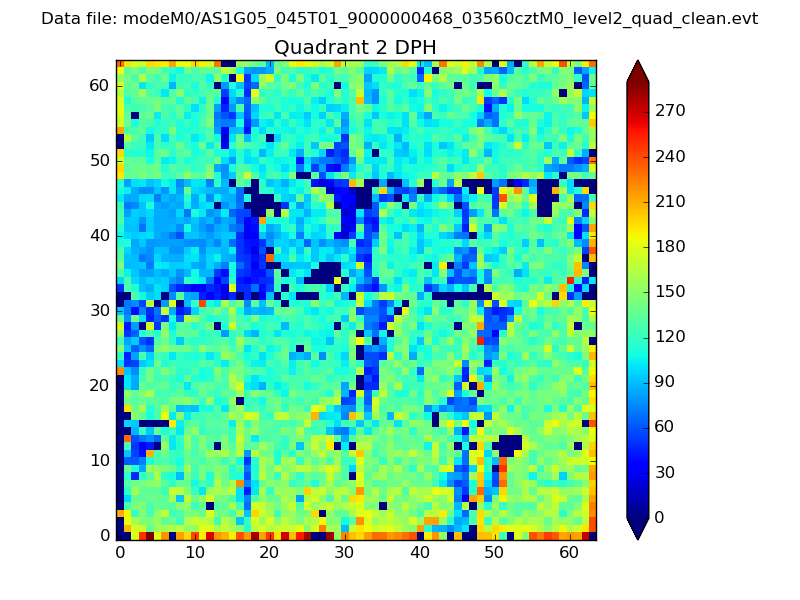 |
Quadrant C |
| Plot type | Count rate plots | Images |
|---|---|---|
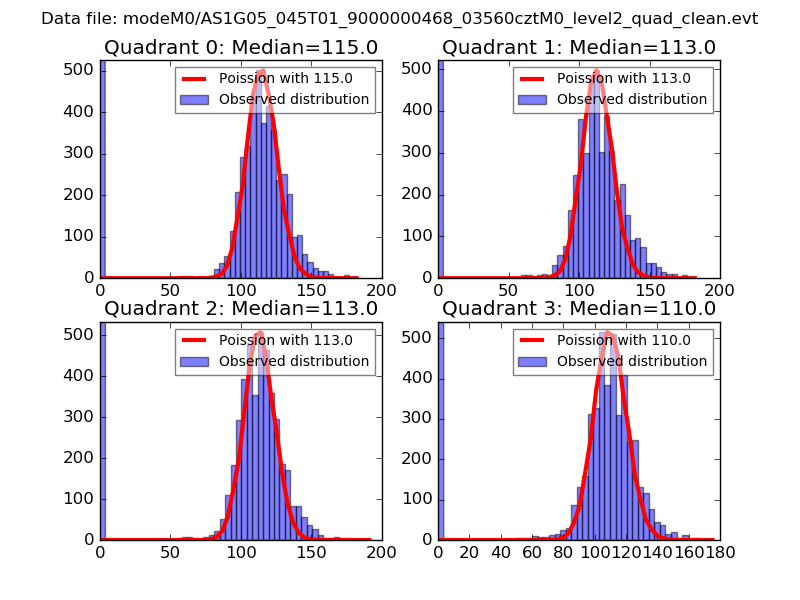
| Comparison with Poisson distribution Blue bars denote a histogram of data divided into 1 sec bins. Red curve is a Poisson curve with rate = median count rate of data. |
 |
 |
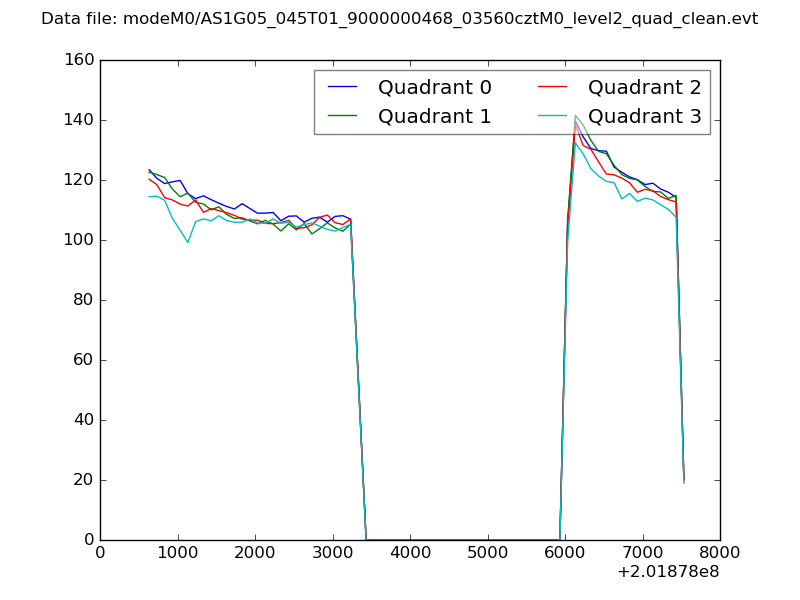
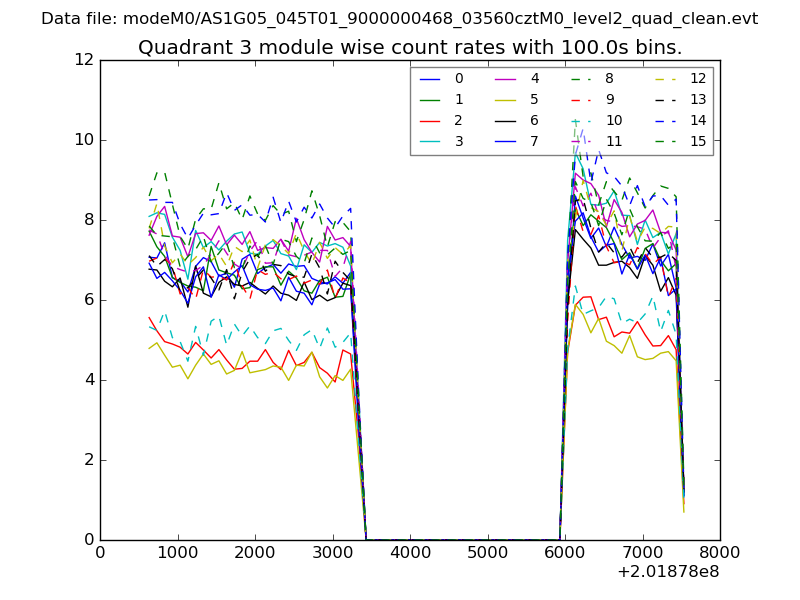
| Quadrant-wise count rates Data is divided into 100 sec bins |
 |
|
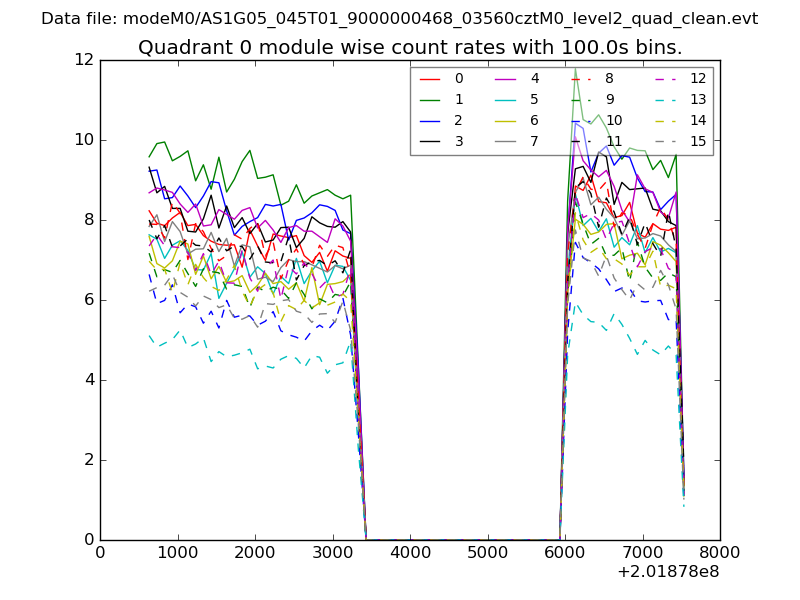
| Module-wise count rates for Quadrant A Data is divided into 100 sec bins |
 |
 |
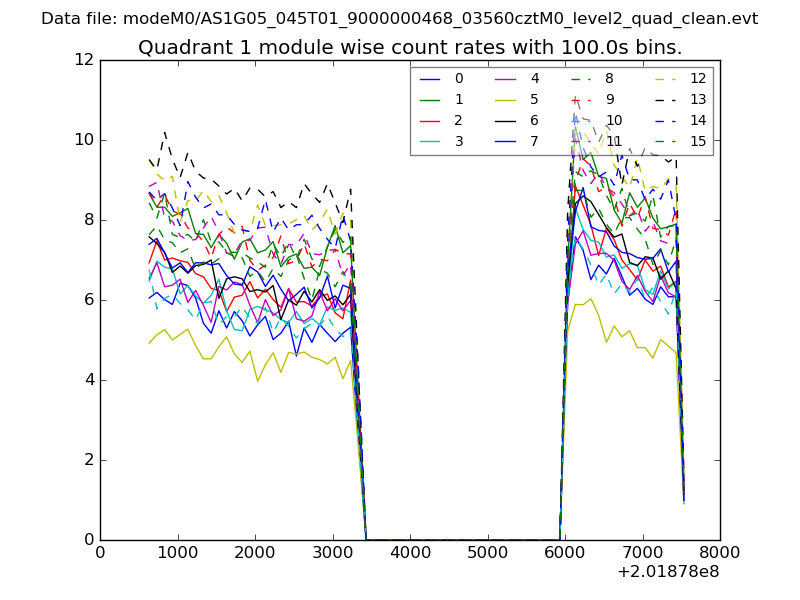
| Module-wise count rates for Quadrant B Data is divided into 100 sec bins |
 |
 |
| Module-wise count rates for Quadrant C Data is divided into 100 sec bins |
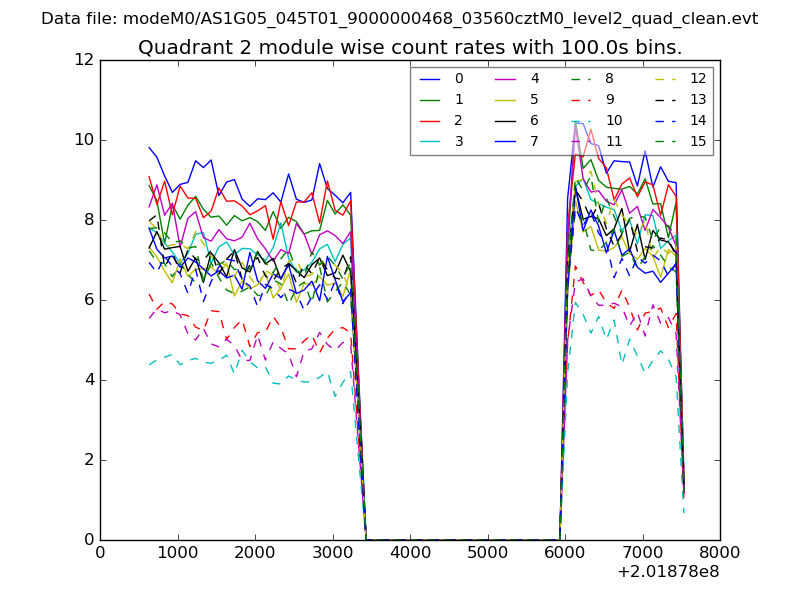 |
 |
| Module-wise count rates for Quadrant D Data is divided into 100 sec bins |
 |
 |
| Parameter | Plot |
|---|---|
| CZT HV Monitor | 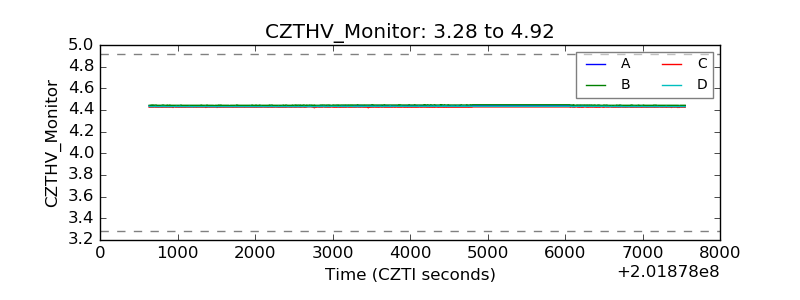 |
| D_VDD | 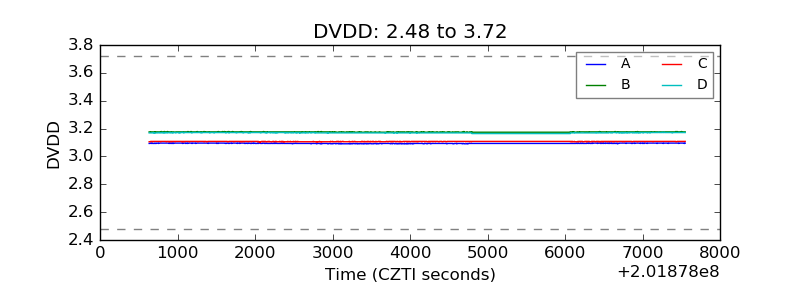 |
| Temperature 1 | 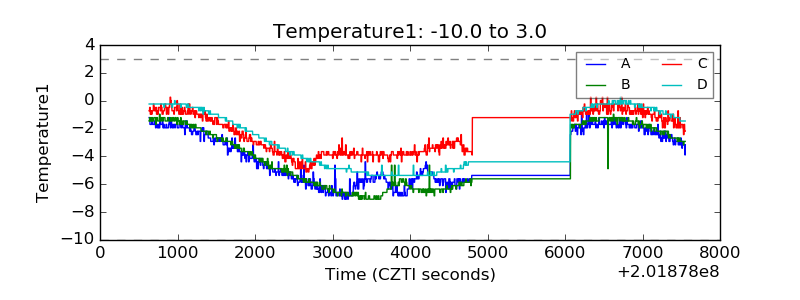 |
| Veto HV Monitor | 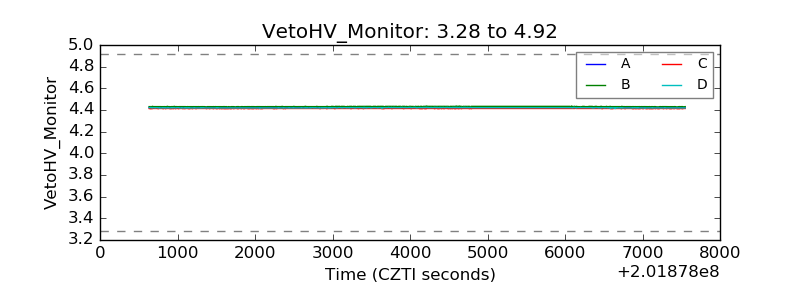 |
| Veto LLD | 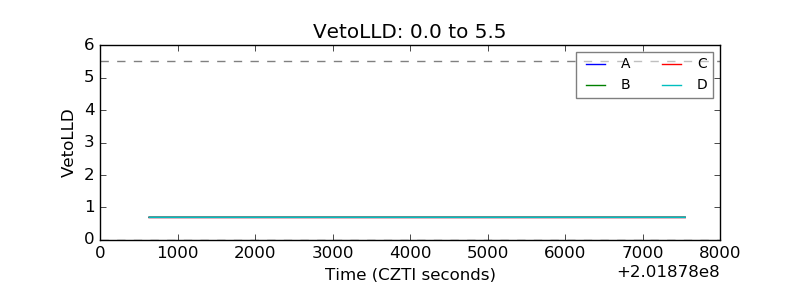 |
| Alpha Counter | 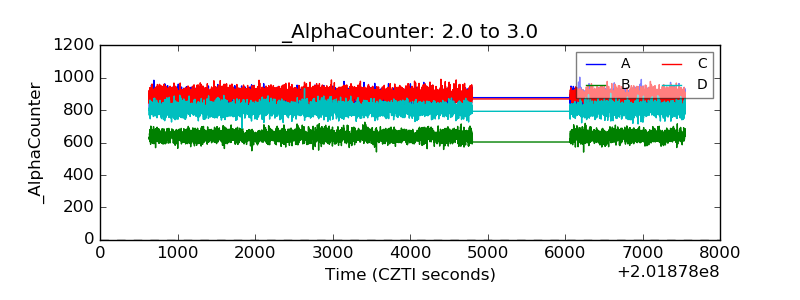 |
| _CPM_Rate | 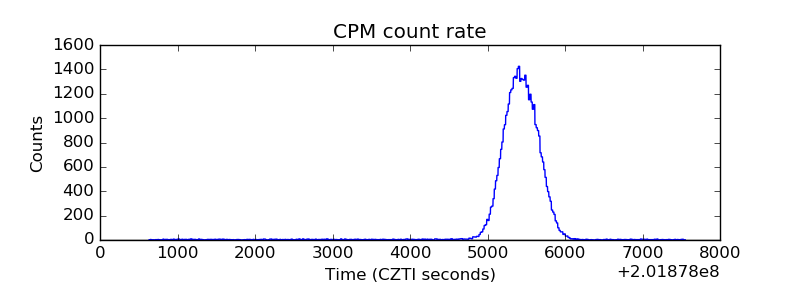 |
| CZT Counter | 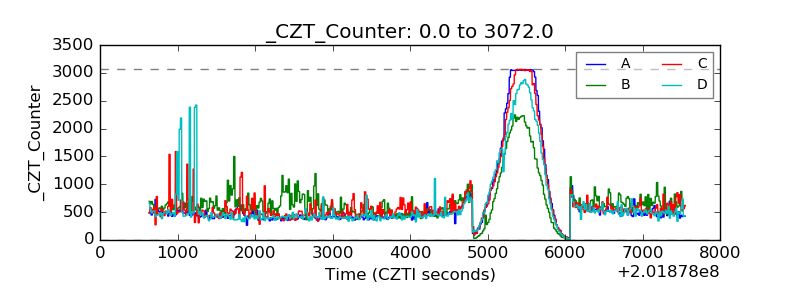 |
| +2.5 Volts monitor |  |
| +5 Volts monitor |  |
| _ROLL_ROT | 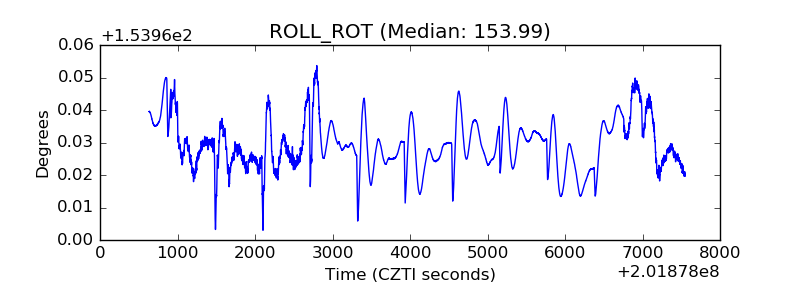 |
| _Roll_DEC | 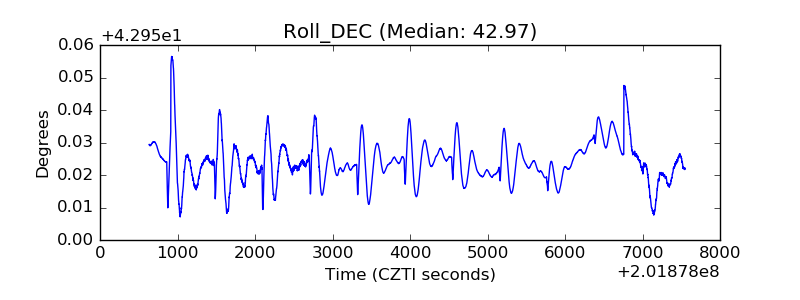 |
| _Roll_RA | 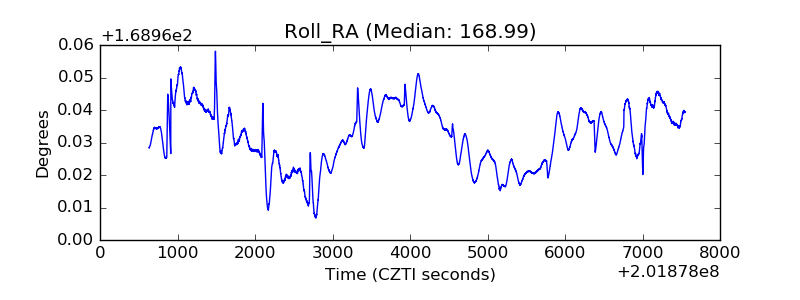 |
| Veto Counter | 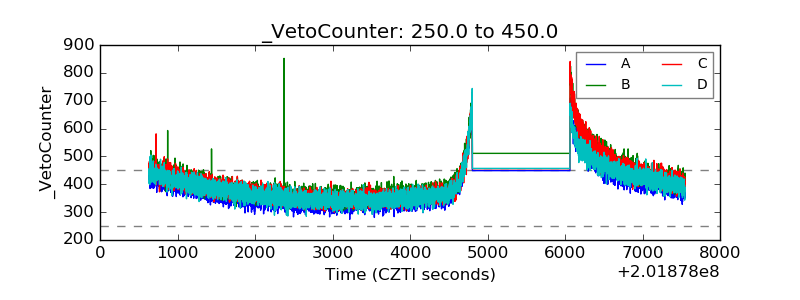 |