| Param | Original file | Final file |
|---|---|---|
| Filename | modeM0/AS1G05_045T01_9000000468_03562cztM0_level2.evt | modeM0/AS1G05_045T01_9000000468_03562cztM0_level2_quad_clean.evt |
| Size (bytes) | 431,280,000 | 71,092,800 |
| Size | 411.3 MB | 67.8 MB |
| Events in quadrant A | 2,832,002 | 439,510 |
| Events in quadrant B | 3,778,414 | 431,886 |
| Events in quadrant C | 3,054,841 | 435,817 |
| Events in quadrant D | 2,980,997 | 419,031 |
| Mode M0 | |||
|---|---|---|---|
| Quadrant | BADHDUFLAG | Total packets | Discarded packets |
| A | 0 | 12791 | 2 |
| B | 0 | 15467 | 1 |
| C | 0 | 13220 | 1 |
| D | 0 | 13399 | 1 |
| Mode M9 | |||
|---|---|---|---|
| Quadrant | BADHDUFLAG | Total packets | Discarded packets |
| A | 0 | 12 | 0 |
| B | 0 | 12 | 0 |
| C | 0 | 12 | 0 |
| D | 0 | 12 | 0 |
| Mode SS | |||
|---|---|---|---|
| Quadrant | BADHDUFLAG | Total packets | Discarded packets |
| A | 0 | 124 | 0 |
| B | 0 | 124 | 0 |
| C | 0 | 124 | 0 |
| D | 0 | 124 | 0 |
| Quadrant | Total seconds | Saturated seconds | Saturation percentage |
|---|---|---|---|
| A | 6107 | 46 | 0.753234% |
| B | 6107 | 89 | 1.457344% |
| C | 6107 | 49 | 0.802358% |
| D | 6107 | 105 | 1.719338% |
Noise dominated data is calculated using 1-second bins in cleaned event files. If a bin has >2000 counts, and if more than 50% of those come from <1% of pixels, then it is considered to be noise-dominated and hence unusable.
| Quadrant | # 1 sec bins | Bins with >0 counts | Bins with >2000 counts | High rate bins dominated by noise | Noise dominated (total time) | Noise dominated (detector-on time) | Marked lightcurve |
|---|---|---|---|---|---|---|---|
| A | 7272 | 6107 | 4 | 4 | 0.06% | 0.07% | 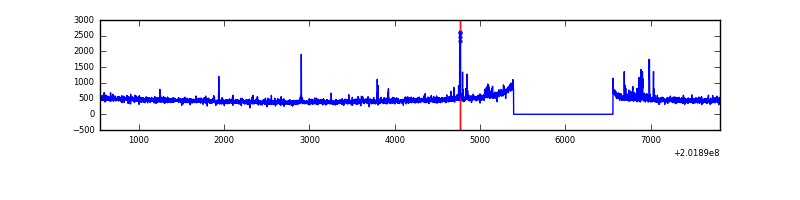 |
| B | 7272 | 6108 | 41 | 41 | 0.56% | 0.67% | 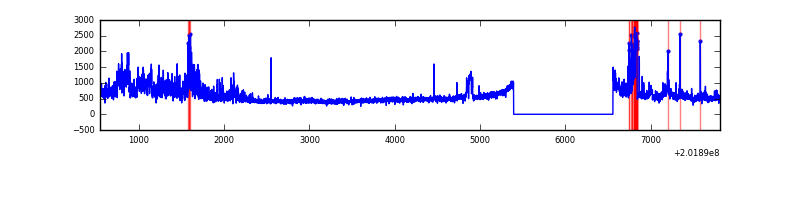 |
| C | 7272 | 6107 | 1 | 1 | 0.01% | 0.02% | 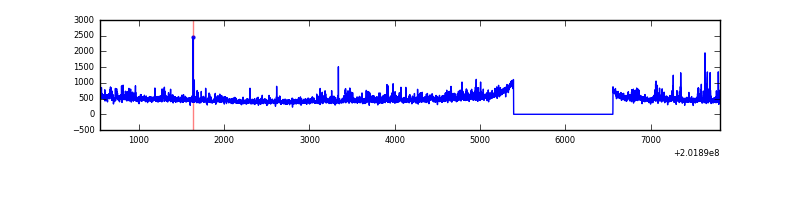 |
| D | 7272 | 6107 | 64 | 64 | 0.88% | 1.05% | 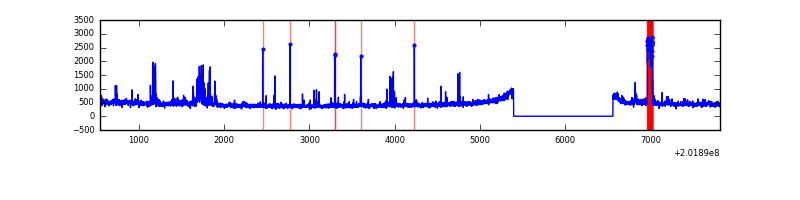 |
Top three noisy pixels from each quadrant. If the there are fewer than three noisy pixels in the level2.evt file, extra rows are filled as -1
| Pixel properties | Quadrant properties | ||||||
|---|---|---|---|---|---|---|---|
| Quadrant | DetID | PixID | Counts | Sigma | Mean | Median | Sigma |
| A | 3 | 1 | 43794 | 297.57 | 704 | 687 | 144.9 |
| A | 0 | 50 | 38347 | 259.97 | 704 | 687 | 144.9 |
| A | 0 | 118 | 22402 | 149.9 | 704 | 687 | 144.9 |
| B | 15 | 204 | 635285 | 4658.6 | 713 | 696 | 136.2 |
| B | 4 | 81 | 168173 | 1229.47 | 713 | 696 | 136.2 |
| B | 4 | 172 | 56115 | 406.84 | 713 | 696 | 136.2 |
| C | 15 | 208 | 300385 | 1840.28 | 697 | 701 | 162.8 |
| C | 12 | 4 | 12827 | 74.46 | 697 | 701 | 162.8 |
| C | 1 | 16 | 11188 | 64.4 | 697 | 701 | 162.8 |
| D | 13 | 25 | 145561 | 882.43 | 688 | 670 | 164.2 |
| D | 13 | 70 | 108952 | 659.47 | 688 | 670 | 164.2 |
| D | 1 | 20 | 50269 | 302.07 | 688 | 670 | 164.2 |
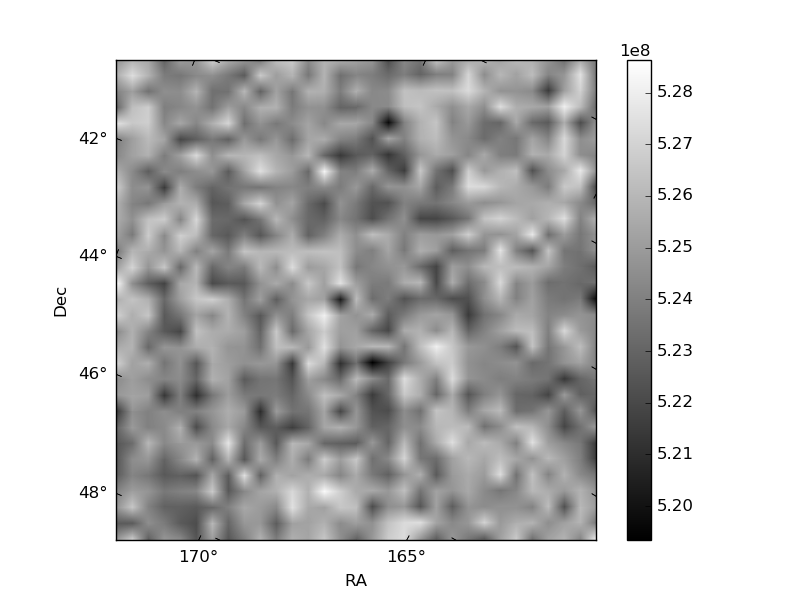
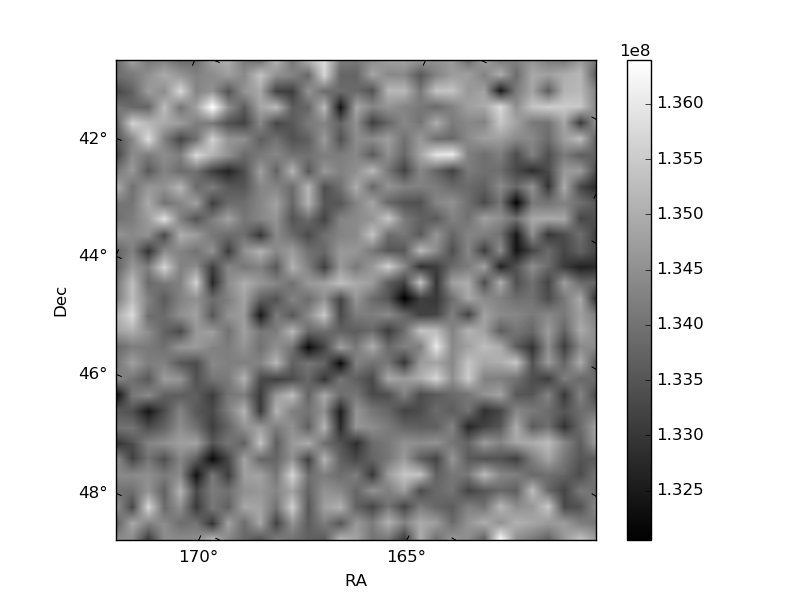
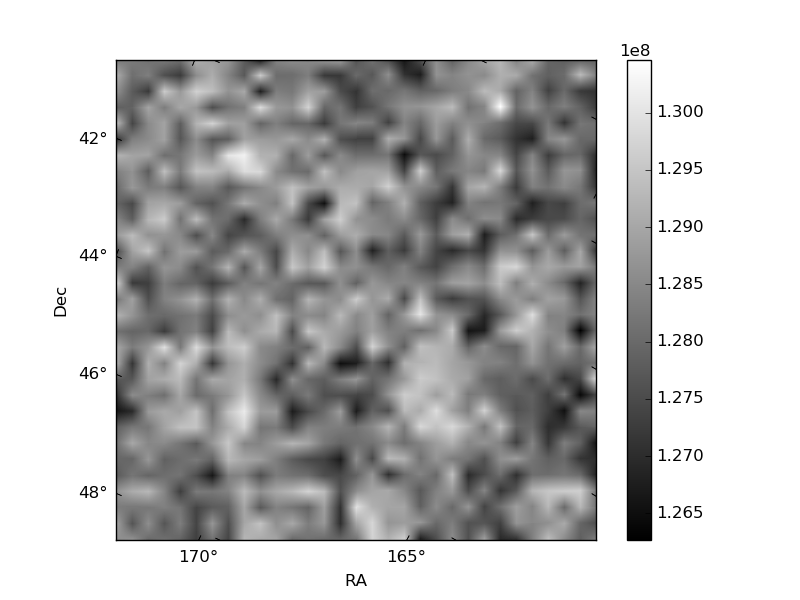
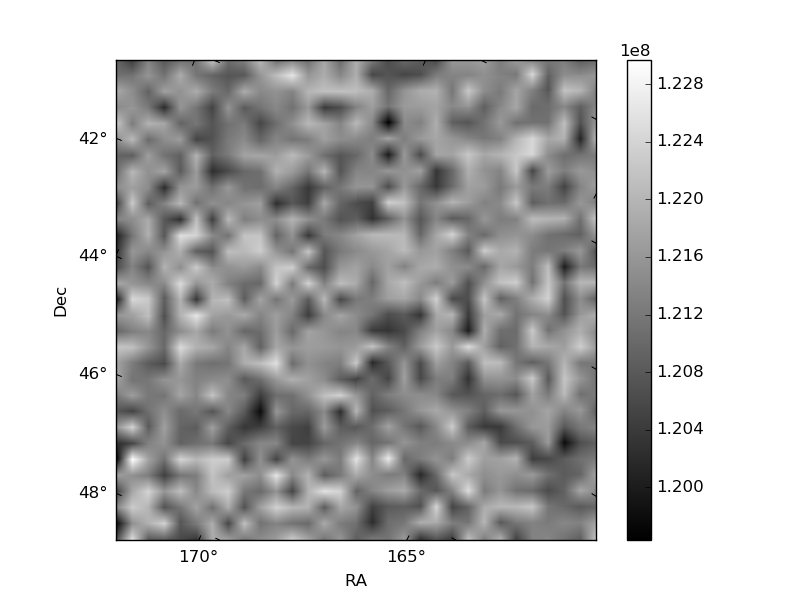
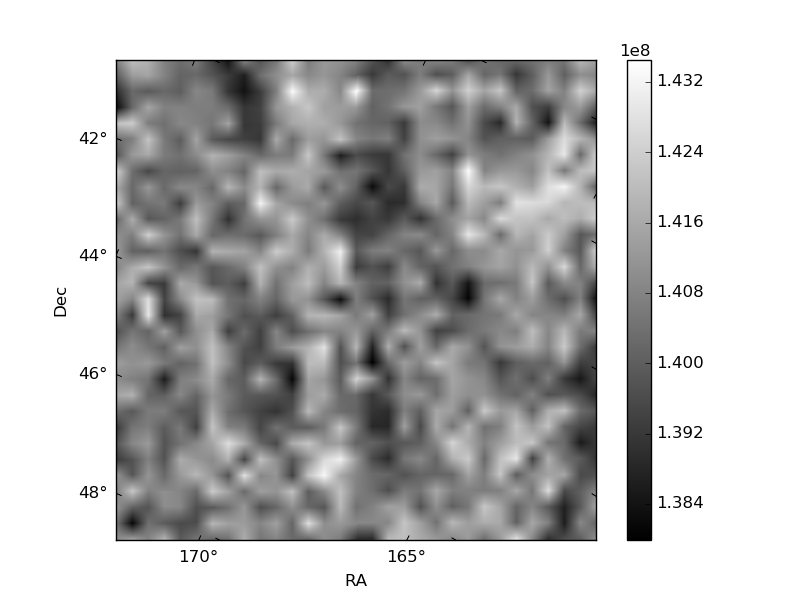
Histogram calculated using DETX and DETY for each event in the final _common_clean file
| Quadrant A | 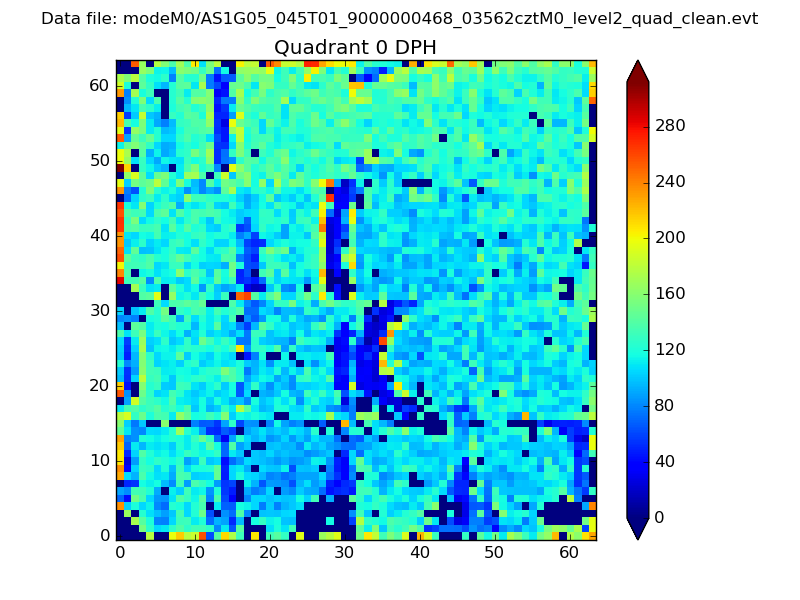 |
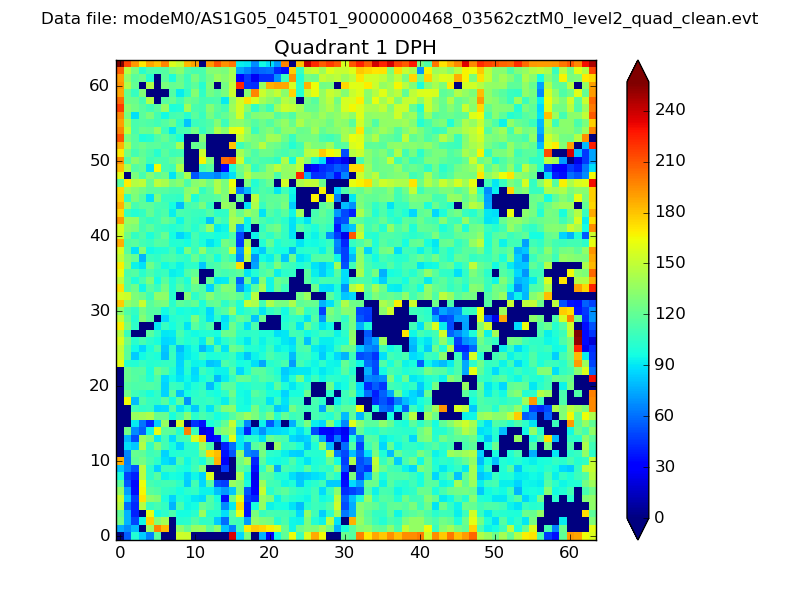 |
Quadrant B |
|---|---|---|---|
| Quadrant D | 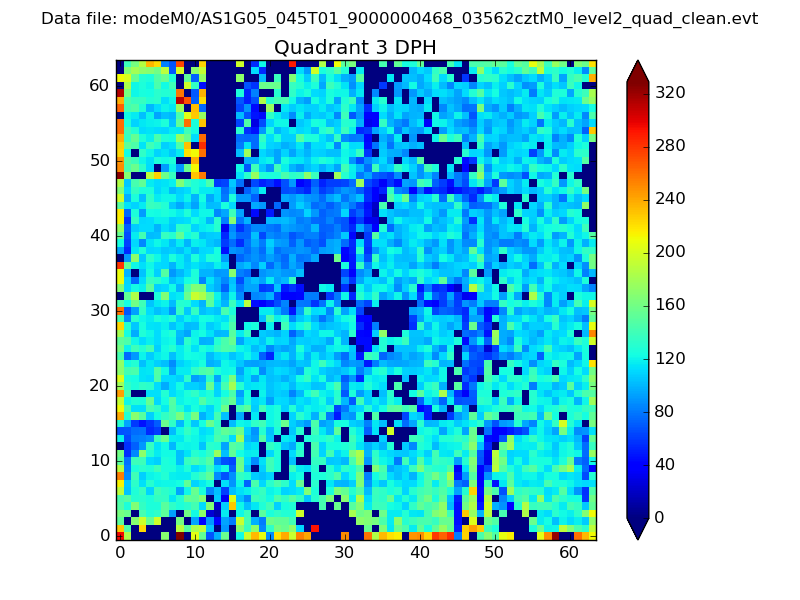 |
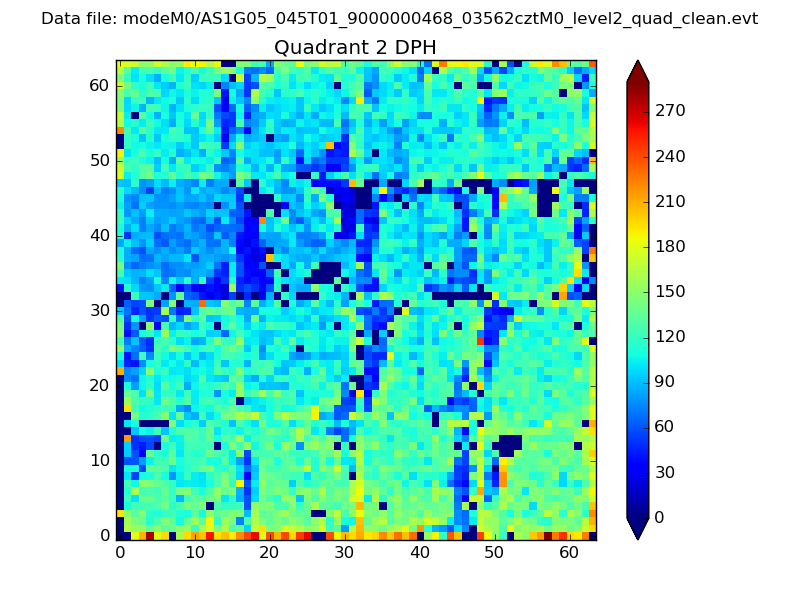 |
Quadrant C |
| Plot type | Count rate plots | Images |
|---|---|---|
| Comparison with Poisson distribution Blue bars denote a histogram of data divided into 1 sec bins. Red curve is a Poisson curve with rate = median count rate of data. |
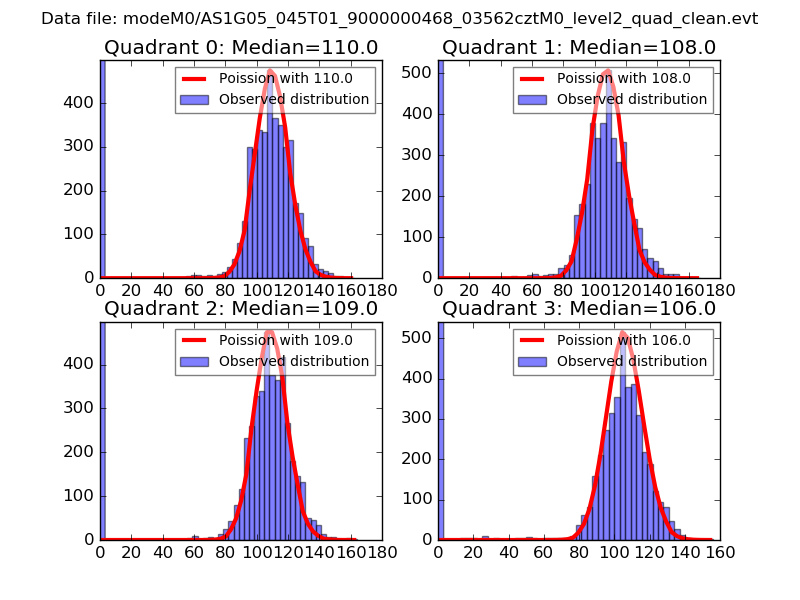 |
 |
| Quadrant-wise count rates Data is divided into 100 sec bins |
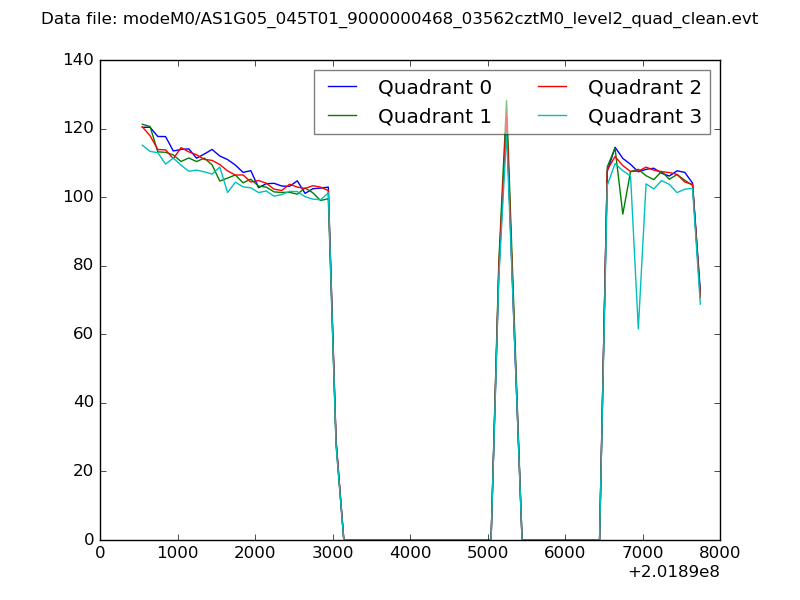 |
|
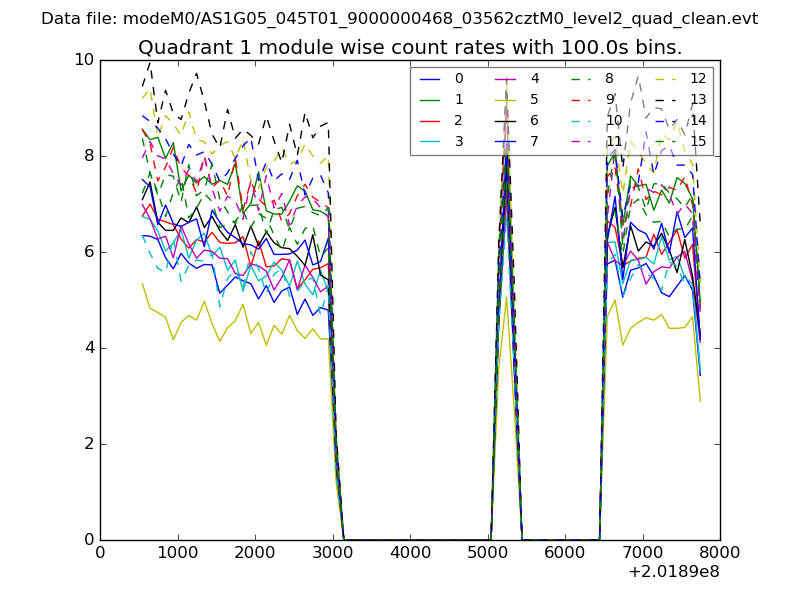
| Module-wise count rates for Quadrant A Data is divided into 100 sec bins |
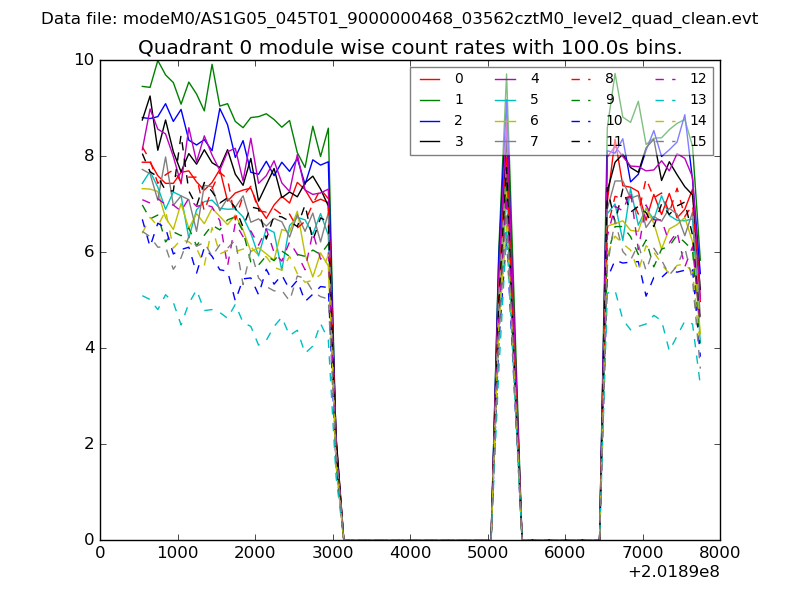 |
 |
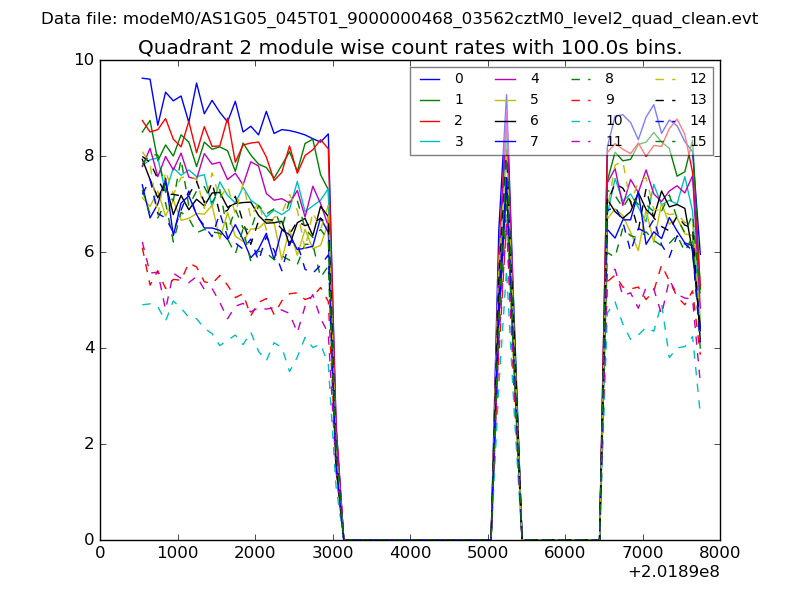
| Module-wise count rates for Quadrant B Data is divided into 100 sec bins |
 |
 |
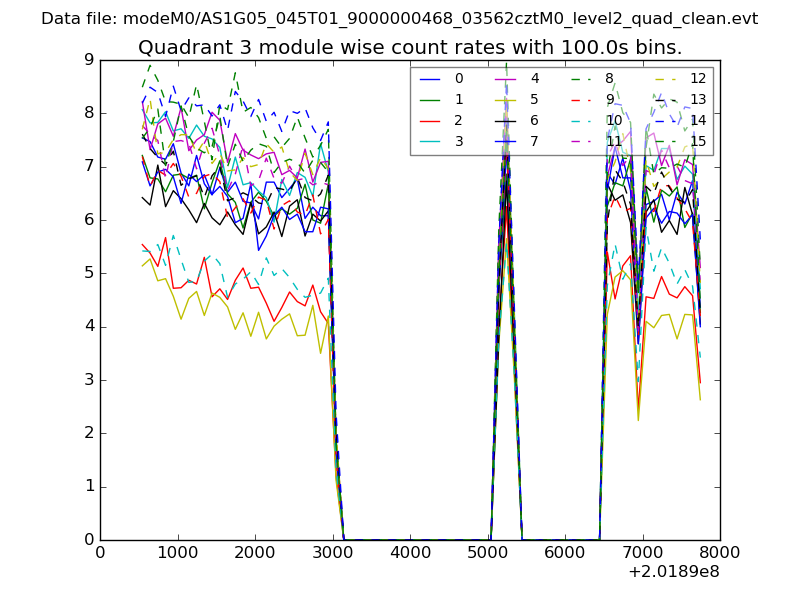
| Module-wise count rates for Quadrant C Data is divided into 100 sec bins |
 |
 |
| Module-wise count rates for Quadrant D Data is divided into 100 sec bins |
 |
 |
| Parameter | Plot |
|---|---|
| CZT HV Monitor | 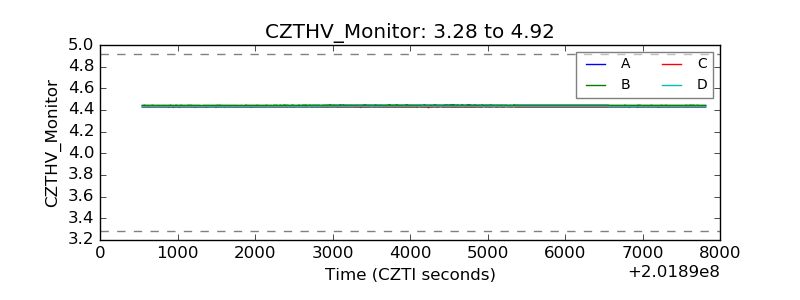 |
| D_VDD | 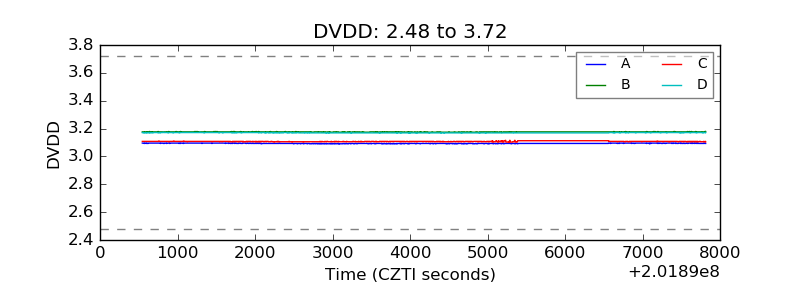 |
| Temperature 1 | 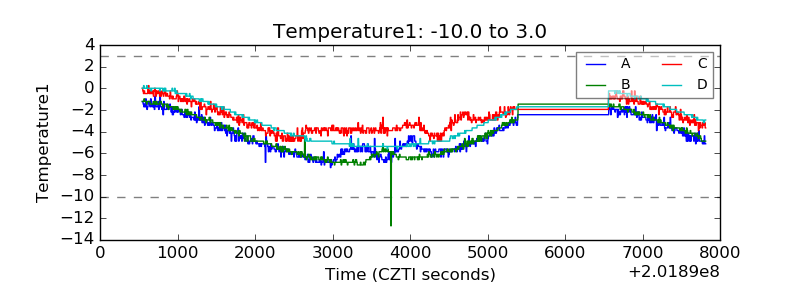 |
| Veto HV Monitor | 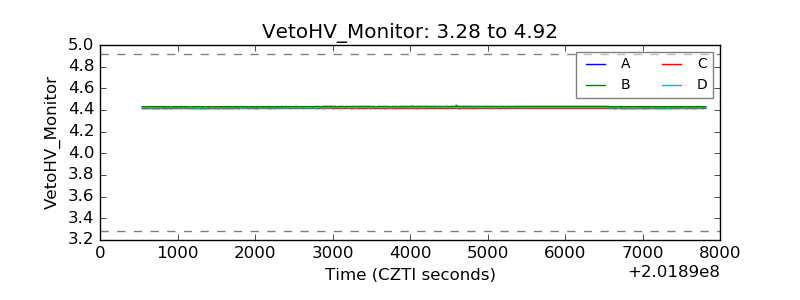 |
| Veto LLD | 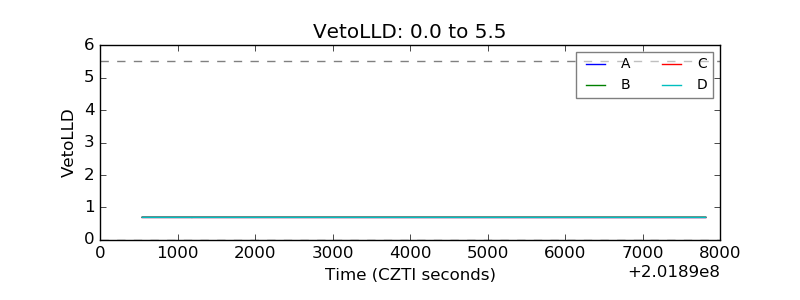 |
| Alpha Counter | 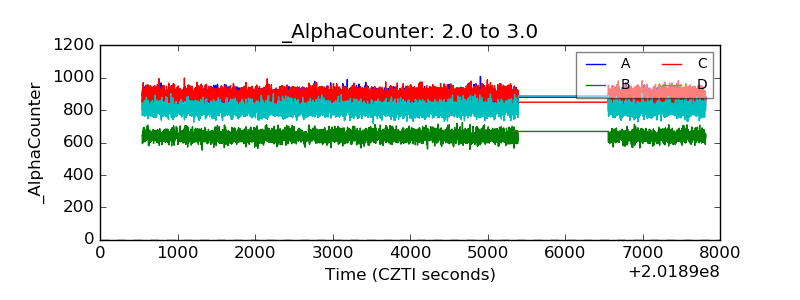 |
| _CPM_Rate | 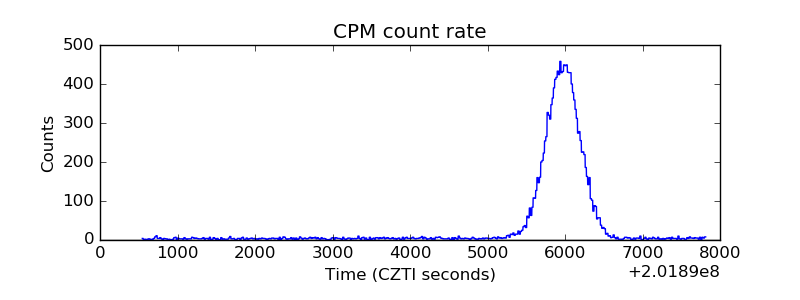 |
| CZT Counter | 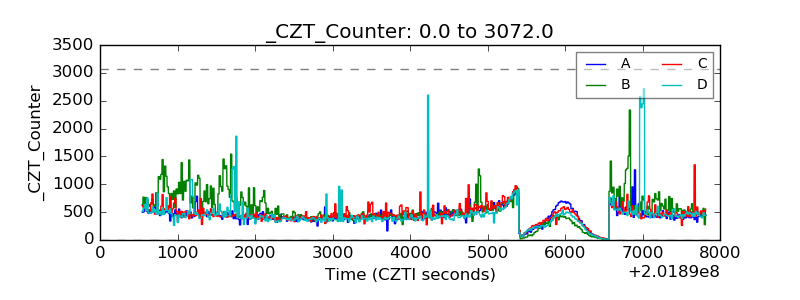 |
| +2.5 Volts monitor |  |
| +5 Volts monitor |  |
| _ROLL_ROT | 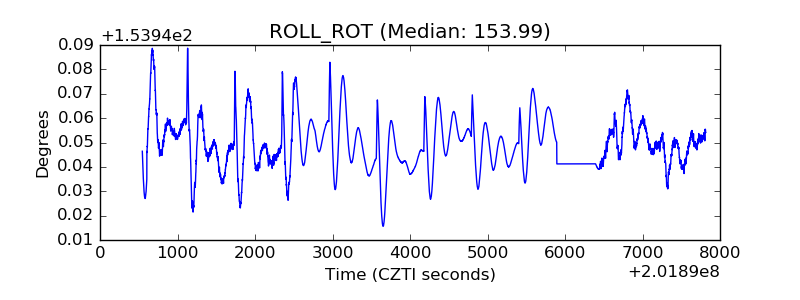 |
| _Roll_DEC | 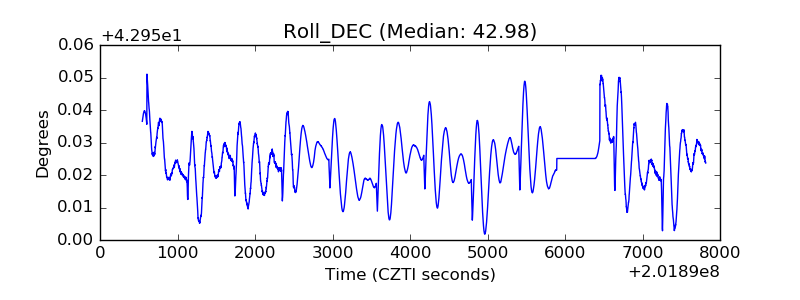 |
| _Roll_RA | 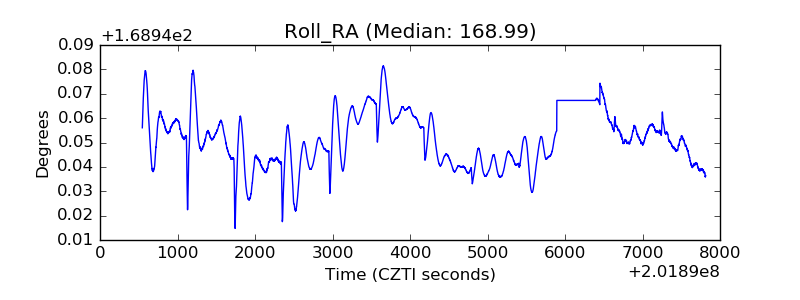 |
| Veto Counter | 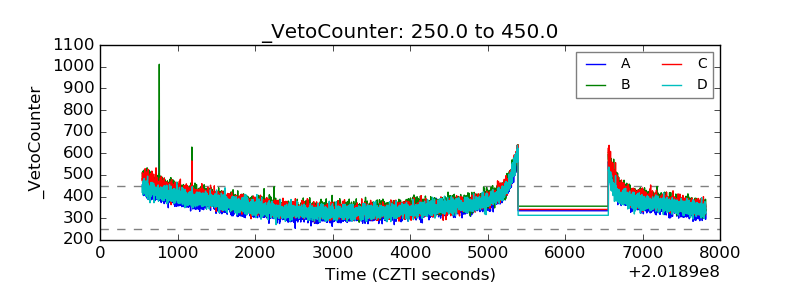 |