| Param | Original file | Final file |
|---|---|---|
| Filename | modeM0/AS1G05_045T01_9000000468_03564cztM0_level2.evt | modeM0/AS1G05_045T01_9000000468_03564cztM0_level2_quad_clean.evt |
| Size (bytes) | 474,606,720 | 84,648,960 |
| Size | 452.6 MB | 80.7 MB |
| Events in quadrant A | 3,221,616 | 526,091 |
| Events in quadrant B | 3,686,763 | 522,016 |
| Events in quadrant C | 3,791,850 | 505,993 |
| Events in quadrant D | 3,186,246 | 510,322 |
| Mode M0 | |||
|---|---|---|---|
| Quadrant | BADHDUFLAG | Total packets | Discarded packets |
| A | 0 | 14796 | 4 |
| B | 0 | 15902 | 3 |
| C | 0 | 16599 | 3 |
| D | 0 | 15056 | 3 |
| Mode M9 | |||
|---|---|---|---|
| Quadrant | BADHDUFLAG | Total packets | Discarded packets |
| A | 0 | 9 | 0 |
| B | 0 | 9 | 0 |
| C | 0 | 9 | 0 |
| D | 0 | 10 | 0 |
| Mode SS | |||
|---|---|---|---|
| Quadrant | BADHDUFLAG | Total packets | Discarded packets |
| A | 0 | 148 | 0 |
| B | 0 | 148 | 0 |
| C | 0 | 148 | 0 |
| D | 0 | 148 | 0 |
| Quadrant | Total seconds | Saturated seconds | Saturation percentage |
|---|---|---|---|
| A | 7160 | 27 | 0.377095% |
| B | 7160 | 82 | 1.145251% |
| C | 7160 | 269 | 3.756983% |
| D | 7160 | 42 | 0.586592% |
Noise dominated data is calculated using 1-second bins in cleaned event files. If a bin has >2000 counts, and if more than 50% of those come from <1% of pixels, then it is considered to be noise-dominated and hence unusable.
| Quadrant | # 1 sec bins | Bins with >0 counts | Bins with >2000 counts | High rate bins dominated by noise | Noise dominated (total time) | Noise dominated (detector-on time) | Marked lightcurve |
|---|---|---|---|---|---|---|---|
| A | 7625 | 7162 | 2 | 2 | 0.03% | 0.03% | 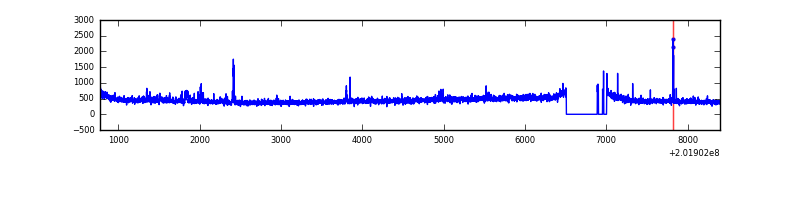 |
| B | 7625 | 7161 | 3 | 3 | 0.04% | 0.04% | 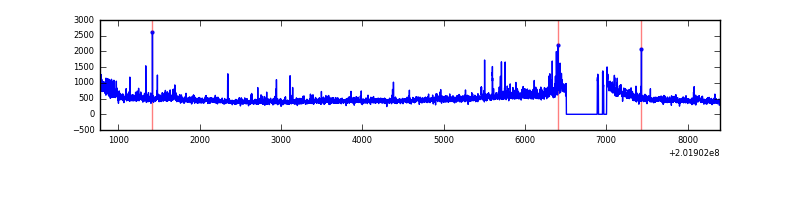 |
| C | 7625 | 7162 | 220 | 220 | 2.89% | 3.07% | 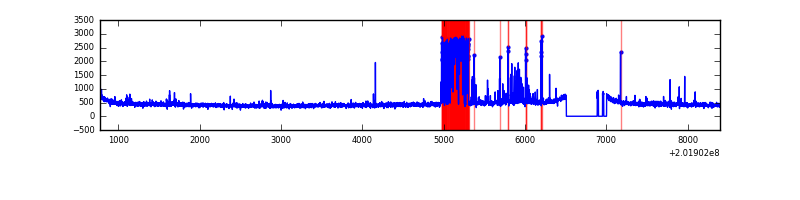 |
| D | 7625 | 7162 | 20 | 20 | 0.26% | 0.28% | 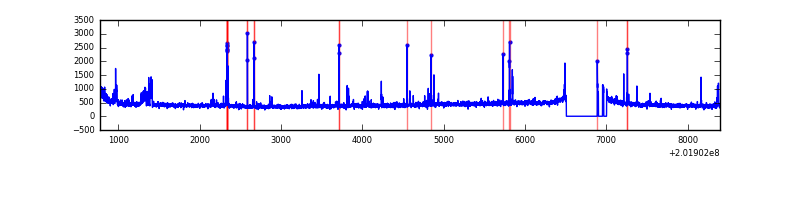 |
Top three noisy pixels from each quadrant. If the there are fewer than three noisy pixels in the level2.evt file, extra rows are filled as -1
| Pixel properties | Quadrant properties | ||||||
|---|---|---|---|---|---|---|---|
| Quadrant | DetID | PixID | Counts | Sigma | Mean | Median | Sigma |
| A | 0 | 118 | 46519 | 276.0 | 805 | 788 | 165.7 |
| A | 0 | 50 | 17099 | 98.44 | 805 | 788 | 165.7 |
| A | 0 | 226 | 12876 | 72.95 | 805 | 788 | 165.7 |
| B | 15 | 204 | 340897 | 2128.7 | 818 | 795 | 159.8 |
| B | 14 | 167 | 39684 | 243.41 | 818 | 795 | 159.8 |
| B | 4 | 81 | 34013 | 207.91 | 818 | 795 | 159.8 |
| C | 15 | 208 | 700067 | 3851.55 | 775 | 778 | 181.6 |
| C | 1 | 16 | 41078 | 221.96 | 775 | 778 | 181.6 |
| C | 12 | 4 | 9384 | 47.4 | 775 | 778 | 181.6 |
| D | 13 | 223 | 58913 | 307.5 | 783 | 760 | 189.1 |
| D | 1 | 20 | 35409 | 183.22 | 783 | 760 | 189.1 |
| D | 4 | 160 | 29260 | 150.7 | 783 | 760 | 189.1 |
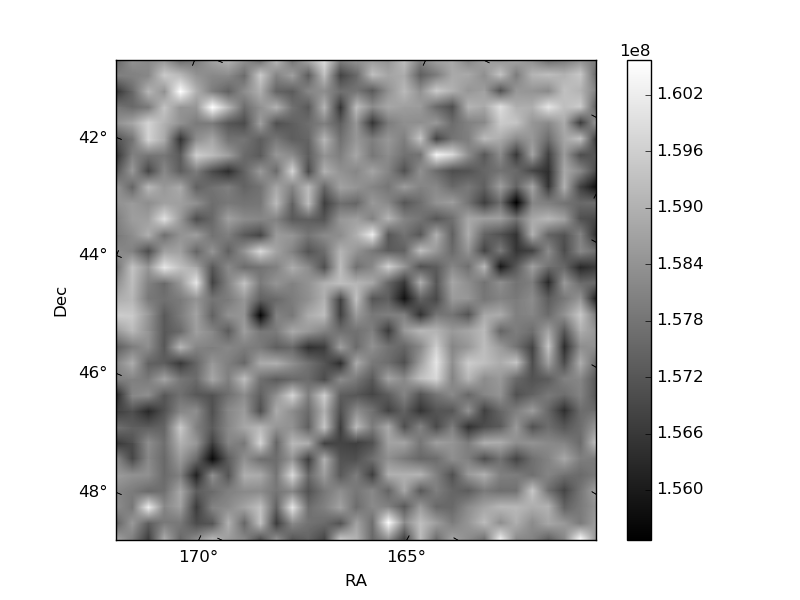
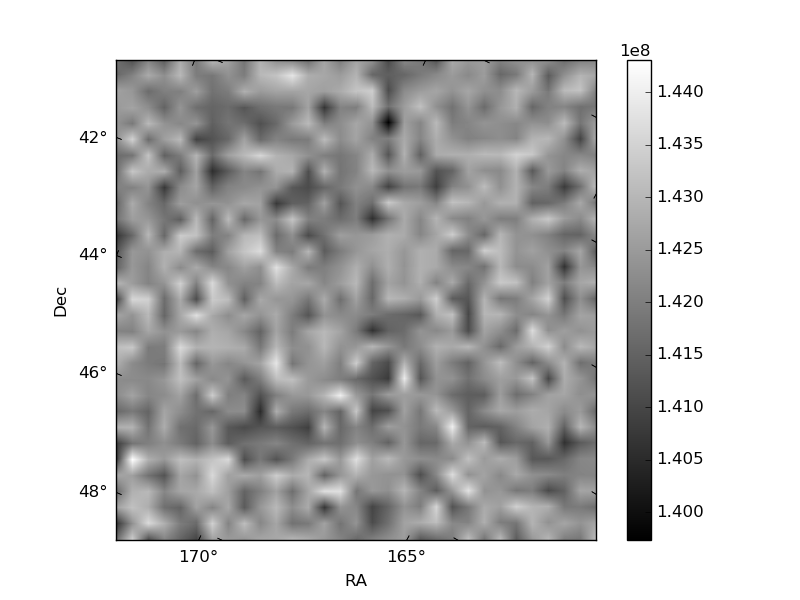
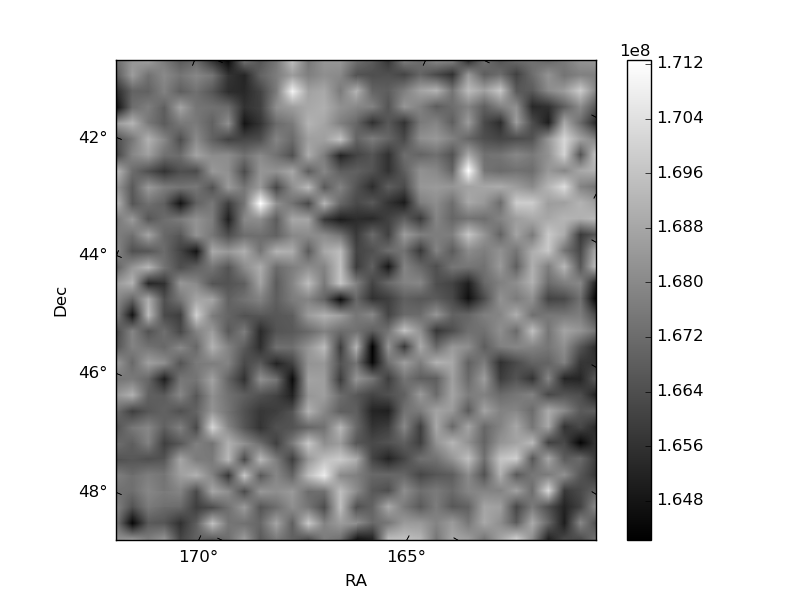
Histogram calculated using DETX and DETY for each event in the final _common_clean file
| Quadrant A |  |
 |
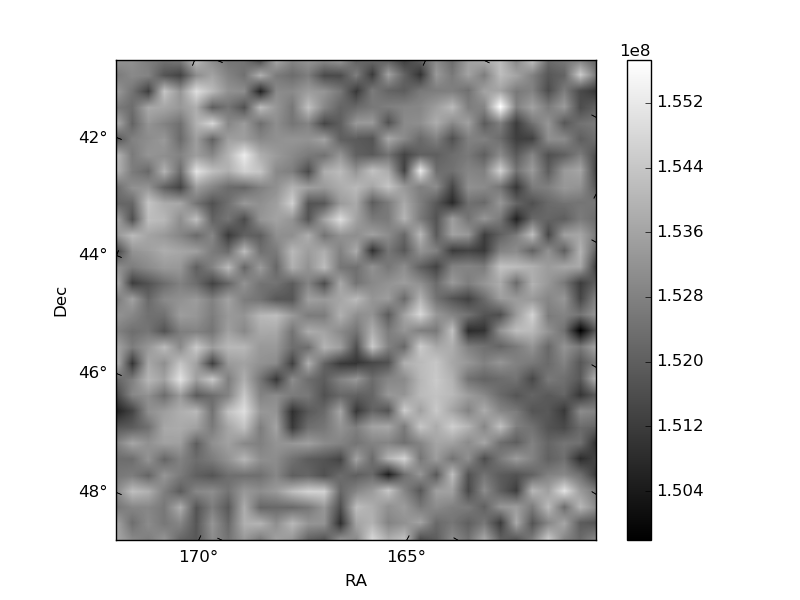
Quadrant B |
|---|---|---|---|
| Quadrant D | 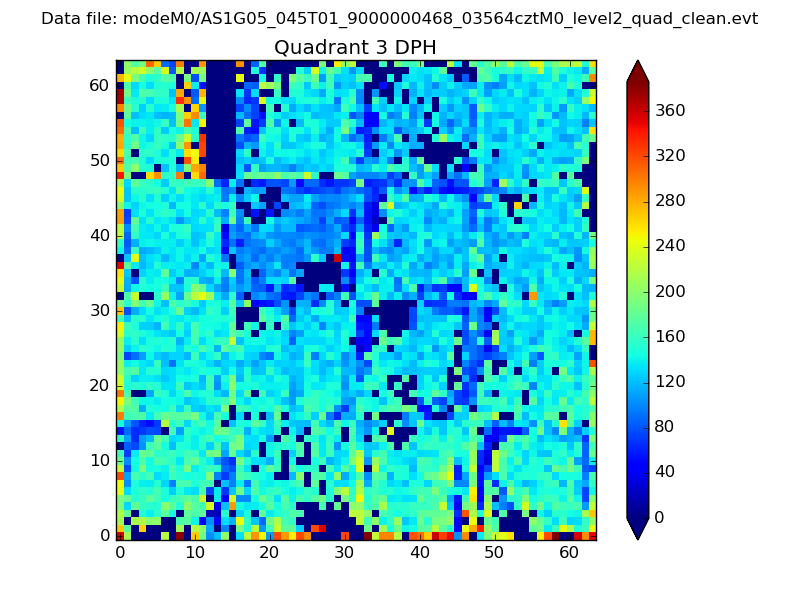 |
 |
Quadrant C |
| Plot type | Count rate plots | Images |
|---|---|---|
| Comparison with Poisson distribution Blue bars denote a histogram of data divided into 1 sec bins. Red curve is a Poisson curve with rate = median count rate of data. |
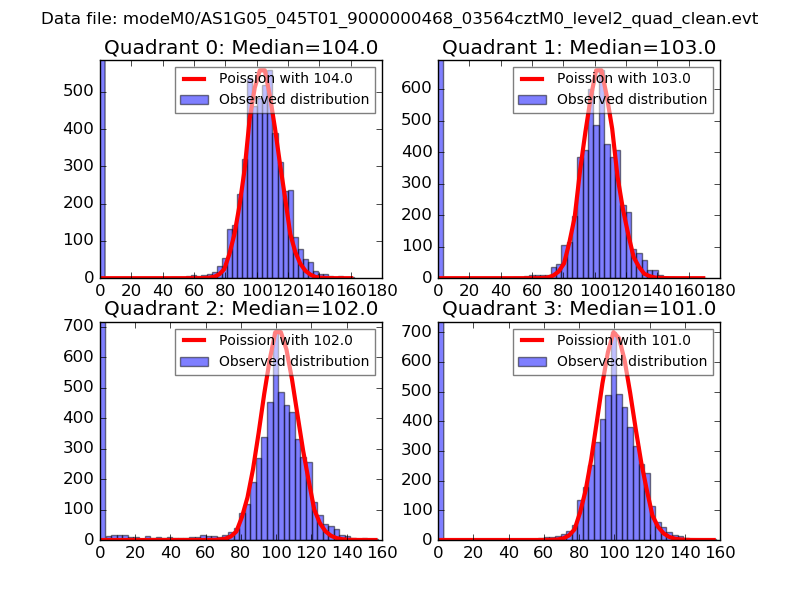 |
 |
| Quadrant-wise count rates Data is divided into 100 sec bins |
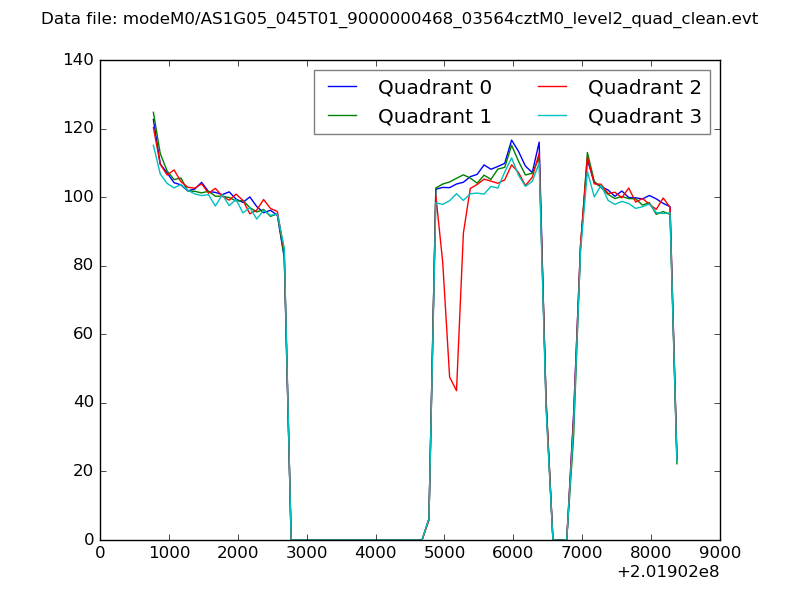 |
|
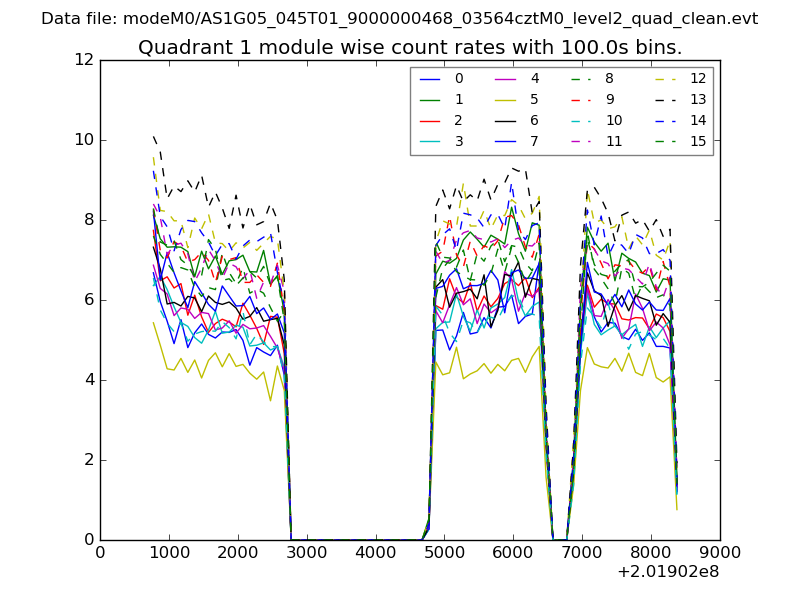
| Module-wise count rates for Quadrant A Data is divided into 100 sec bins |
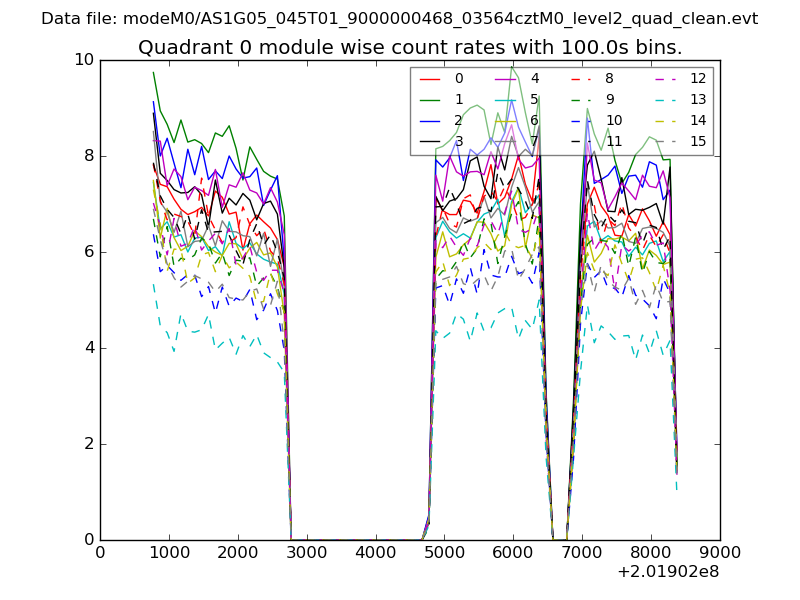 |
 |
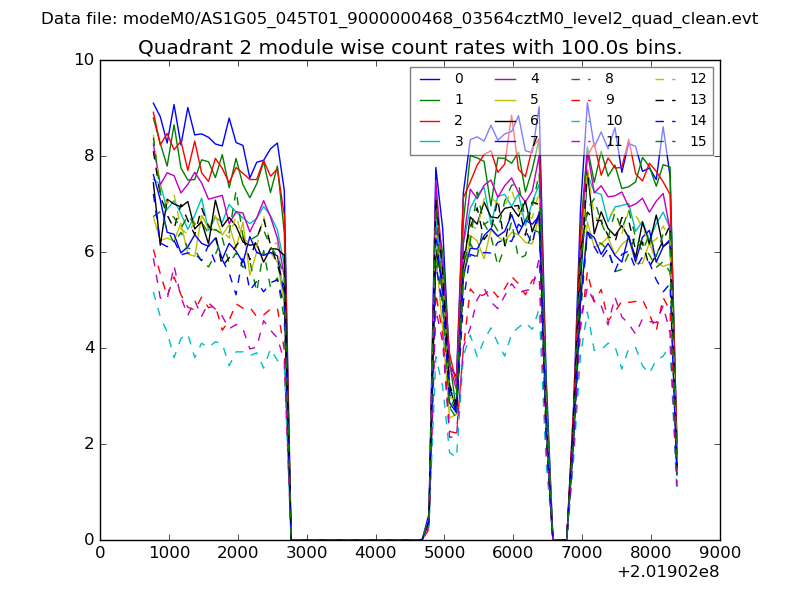
| Module-wise count rates for Quadrant B Data is divided into 100 sec bins |
 |
 |
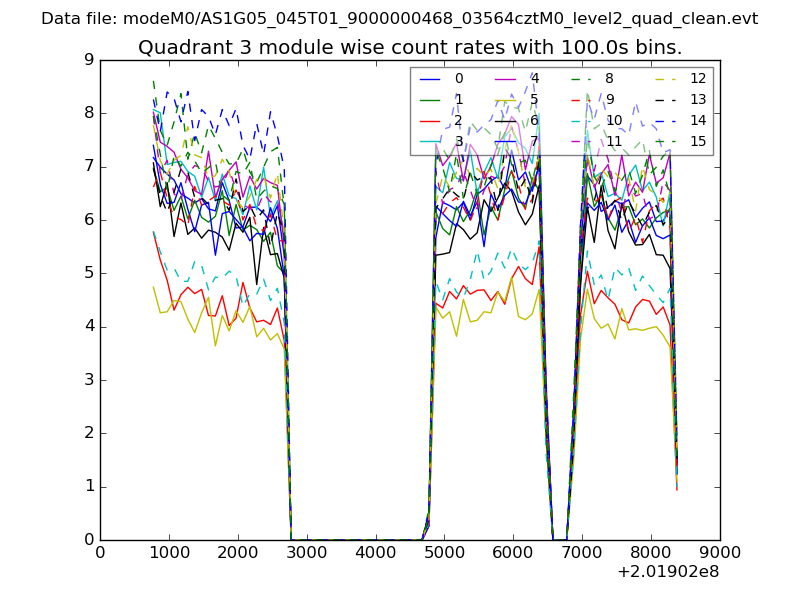
| Module-wise count rates for Quadrant C Data is divided into 100 sec bins |
 |
 |
| Module-wise count rates for Quadrant D Data is divided into 100 sec bins |
 |
 |
| Parameter | Plot |
|---|---|
| CZT HV Monitor | 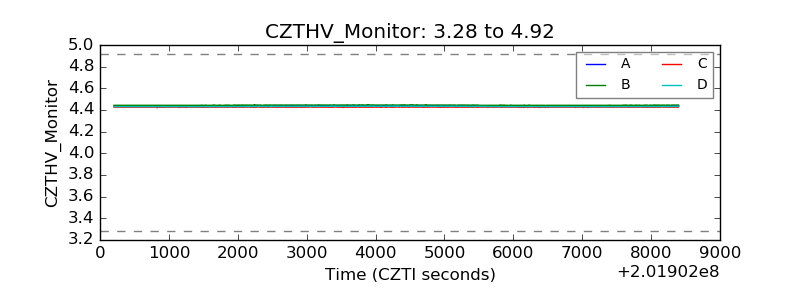 |
| D_VDD | 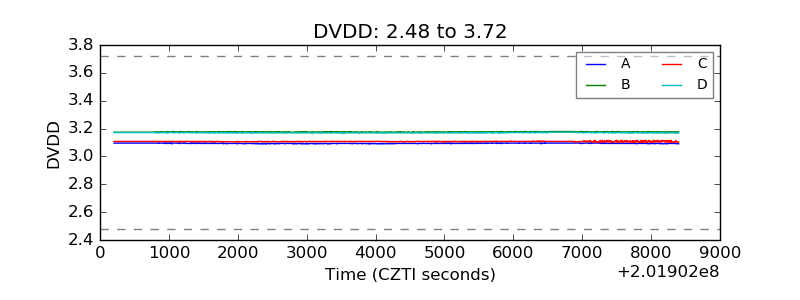 |
| Temperature 1 | 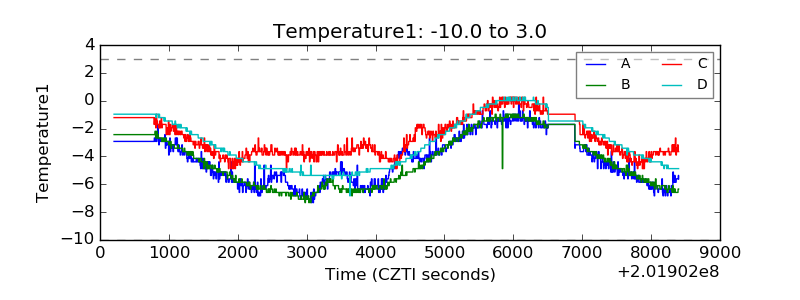 |
| Veto HV Monitor | 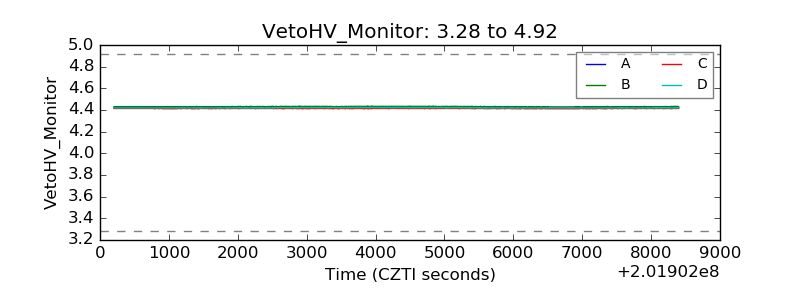 |
| Veto LLD | 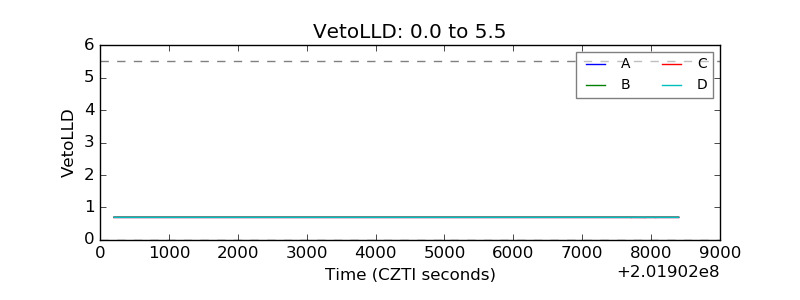 |
| Alpha Counter | 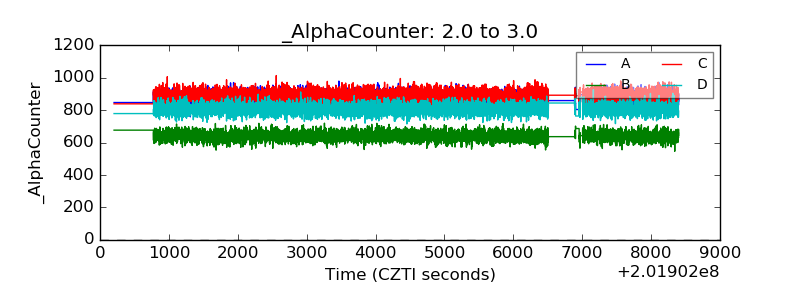 |
| _CPM_Rate | 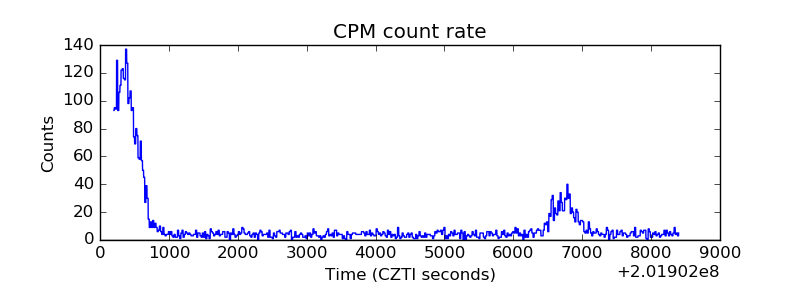 |
| CZT Counter |  |
| +2.5 Volts monitor |  |
| +5 Volts monitor |  |
| _ROLL_ROT | 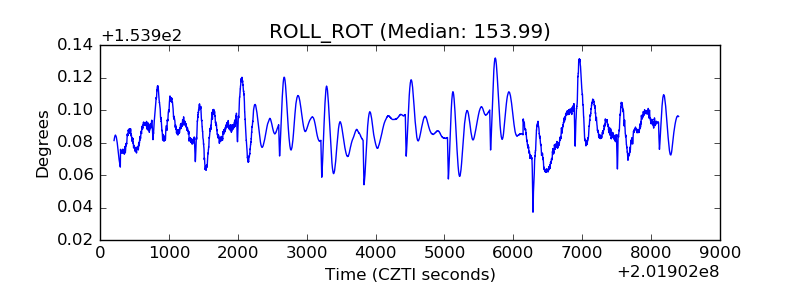 |
| _Roll_DEC | 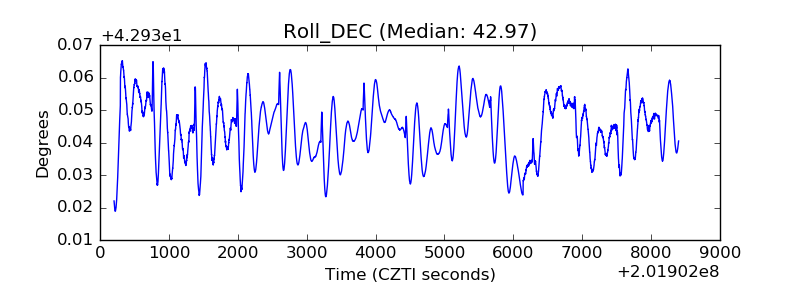 |
| _Roll_RA | 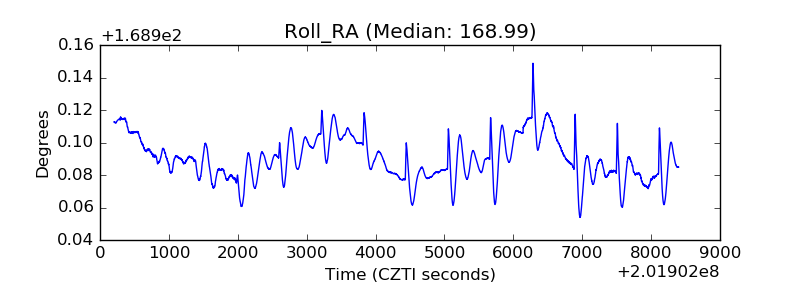 |
| Veto Counter | 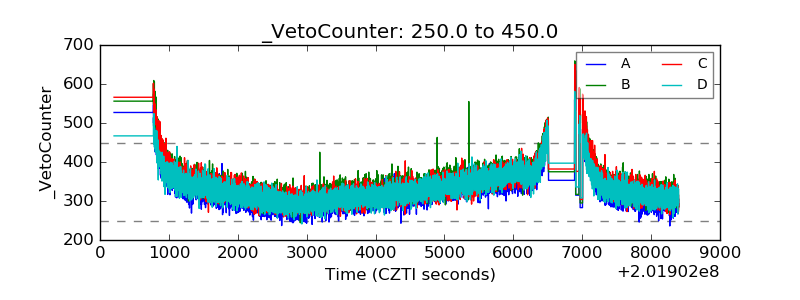 |