| Param | Original file | Final file |
|---|---|---|
| Filename | modeM0/AS1G05_045T01_9000000468_03565cztM0_level2.evt | modeM0/AS1G05_045T01_9000000468_03565cztM0_level2_quad_clean.evt |
| Size (bytes) | 612,864,000 | 111,144,960 |
| Size | 584.5 MB | 106.0 MB |
| Events in quadrant A | 3,830,199 | 712,626 |
| Events in quadrant B | 4,449,380 | 711,106 |
| Events in quadrant C | 5,775,014 | 672,106 |
| Events in quadrant D | 3,933,295 | 683,526 |
| Mode M0 | |||
|---|---|---|---|
| Quadrant | BADHDUFLAG | Total packets | Discarded packets |
| A | 0 | 17540 | 4 |
| B | 0 | 19054 | 3 |
| C | 0 | 23263 | 3 |
| D | 0 | 18133 | 3 |
| Mode M9 | |||
|---|---|---|---|
| Quadrant | BADHDUFLAG | Total packets | Discarded packets |
| A | 0 | 5 | 0 |
| B | 0 | 5 | 0 |
| C | 0 | 5 | 0 |
| D | 0 | 5 | 0 |
| Mode SS | |||
|---|---|---|---|
| Quadrant | BADHDUFLAG | Total packets | Discarded packets |
| A | 0 | 176 | 0 |
| B | 0 | 176 | 0 |
| C | 0 | 176 | 0 |
| D | 0 | 176 | 0 |
| Quadrant | Total seconds | Saturated seconds | Saturation percentage |
|---|---|---|---|
| A | 8435 | 58 | 0.687611% |
| B | 8435 | 155 | 1.837582% |
| C | 8435 | 730 | 8.654416% |
| D | 8435 | 100 | 1.185536% |
Noise dominated data is calculated using 1-second bins in cleaned event files. If a bin has >2000 counts, and if more than 50% of those come from <1% of pixels, then it is considered to be noise-dominated and hence unusable.
| Quadrant | # 1 sec bins | Bins with >0 counts | Bins with >2000 counts | High rate bins dominated by noise | Noise dominated (total time) | Noise dominated (detector-on time) | Marked lightcurve |
|---|---|---|---|---|---|---|---|
| A | 8975 | 8439 | 2 | 2 | 0.02% | 0.02% | 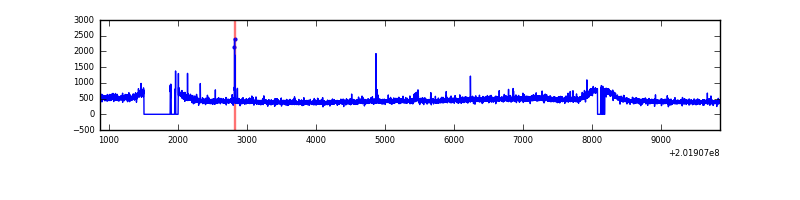 |
| B | 8975 | 8436 | 19 | 19 | 0.21% | 0.23% | 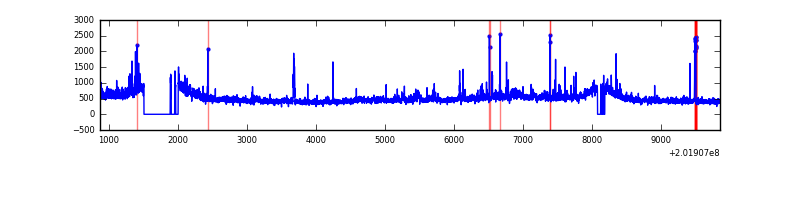 |
| C | 8975 | 8438 | 530 | 530 | 5.91% | 6.28% | 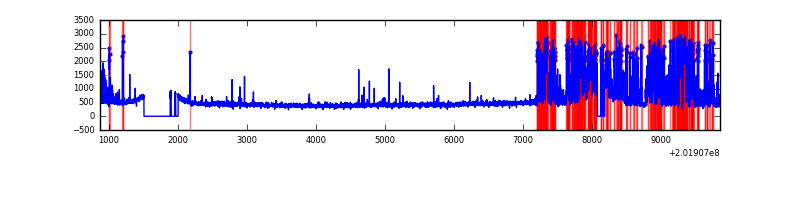 |
| D | 8975 | 8440 | 67 | 67 | 0.75% | 0.79% | 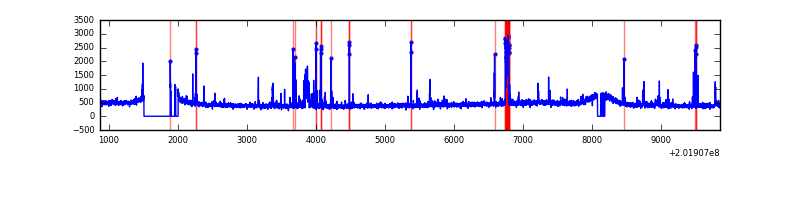 |
Top three noisy pixels from each quadrant. If the there are fewer than three noisy pixels in the level2.evt file, extra rows are filled as -1
| Pixel properties | Quadrant properties | ||||||
|---|---|---|---|---|---|---|---|
| Quadrant | DetID | PixID | Counts | Sigma | Mean | Median | Sigma |
| A | 0 | 50 | 20851 | 99.52 | 973 | 947 | 200.0 |
| A | 7 | 16 | 16113 | 75.83 | 973 | 947 | 200.0 |
| A | 3 | 1 | 14941 | 69.97 | 973 | 947 | 200.0 |
| B | 15 | 204 | 376570 | 1967.84 | 988 | 961 | 190.9 |
| B | 6 | 205 | 61393 | 316.61 | 988 | 961 | 190.9 |
| B | 4 | 200 | 43944 | 225.19 | 988 | 961 | 190.9 |
| C | 15 | 208 | 2103335 | 9708.88 | 922 | 923 | 216.5 |
| C | 8 | 128 | 24200 | 107.49 | 922 | 923 | 216.5 |
| C | 1 | 16 | 18880 | 82.92 | 922 | 923 | 216.5 |
| D | 7 | 39 | 192952 | 828.48 | 948 | 917 | 231.8 |
| D | 5 | 233 | 38652 | 162.8 | 948 | 917 | 231.8 |
| D | 13 | 223 | 36543 | 153.7 | 948 | 917 | 231.8 |
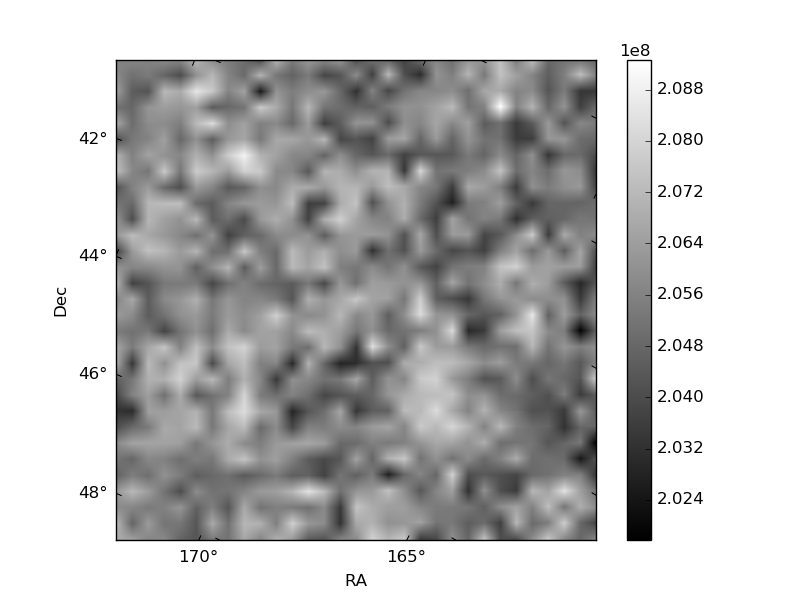
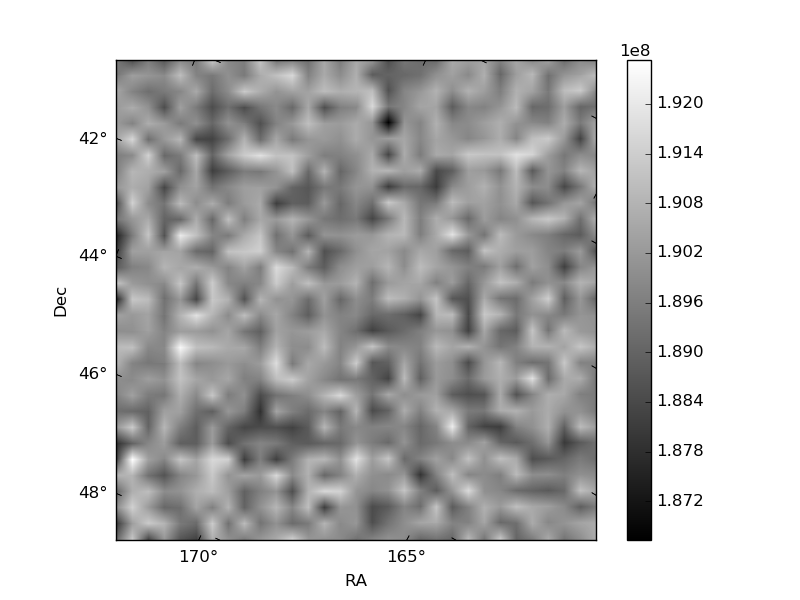
Histogram calculated using DETX and DETY for each event in the final _common_clean file
| Quadrant A |  |
 |
Quadrant B |
|---|---|---|---|
| Quadrant D | 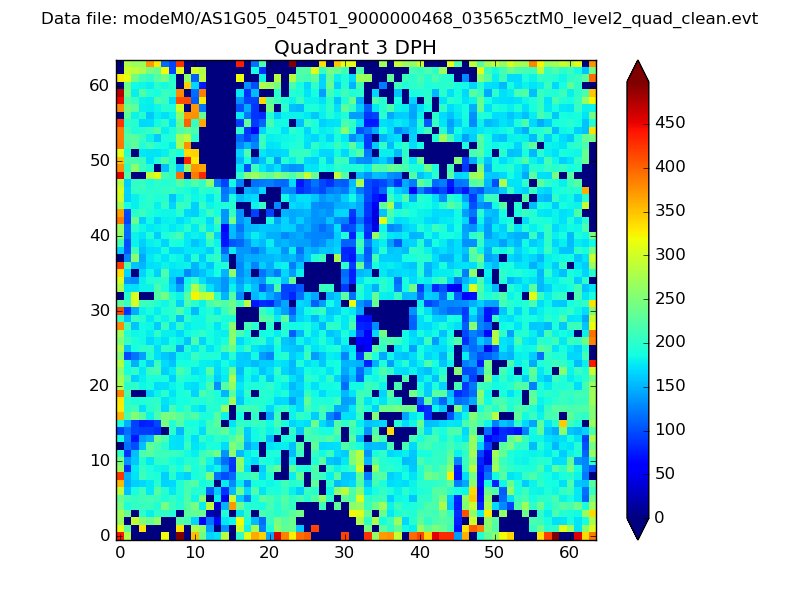 |
 |
Quadrant C |
| Plot type | Count rate plots | Images |
|---|---|---|
| Comparison with Poisson distribution Blue bars denote a histogram of data divided into 1 sec bins. Red curve is a Poisson curve with rate = median count rate of data. |
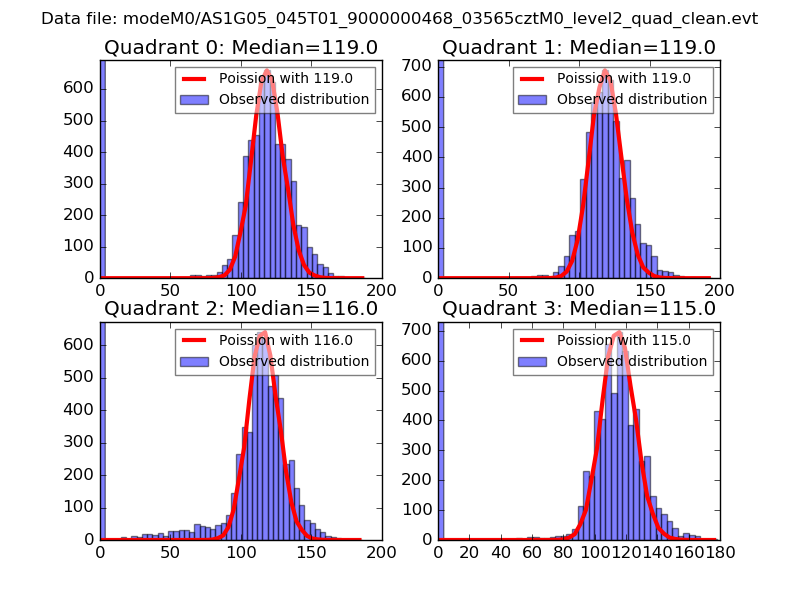 |
 |
| Quadrant-wise count rates Data is divided into 100 sec bins |
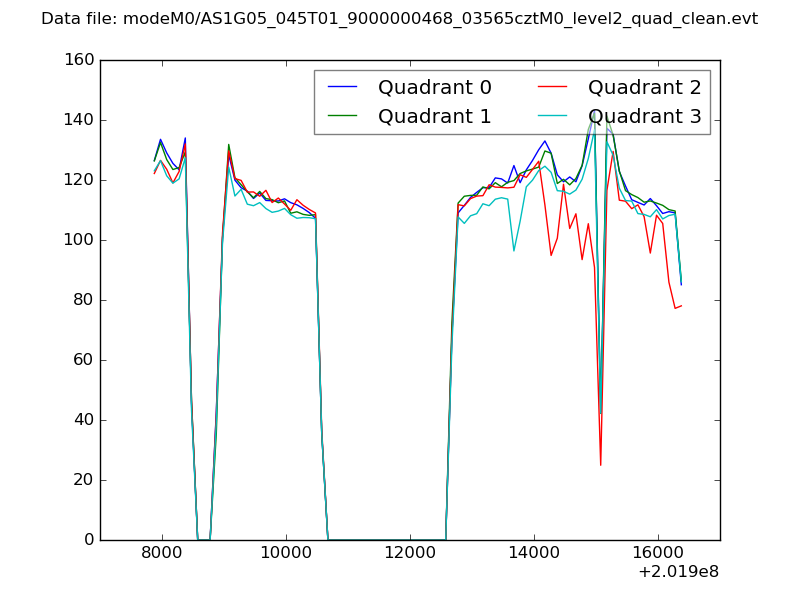 |
|
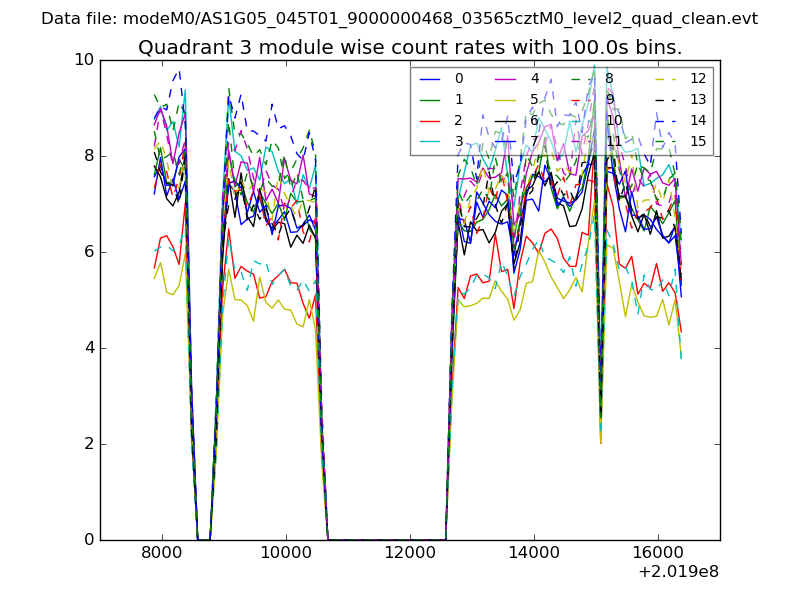
| Module-wise count rates for Quadrant A Data is divided into 100 sec bins |
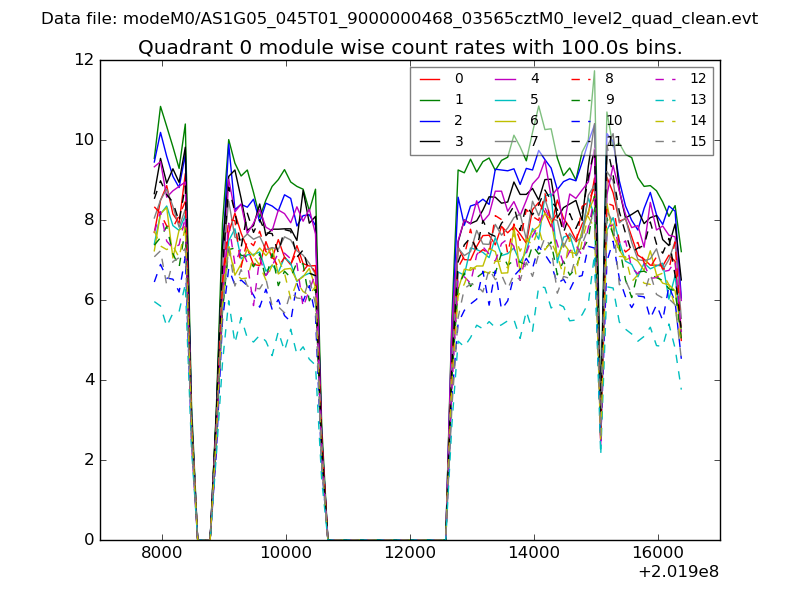 |
 |
| Module-wise count rates for Quadrant B Data is divided into 100 sec bins |
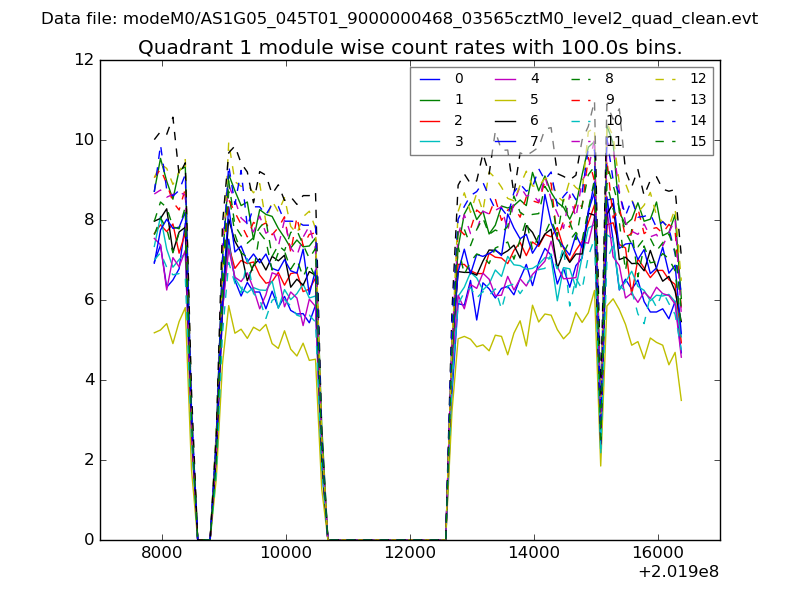 |
 |
| Module-wise count rates for Quadrant C Data is divided into 100 sec bins |
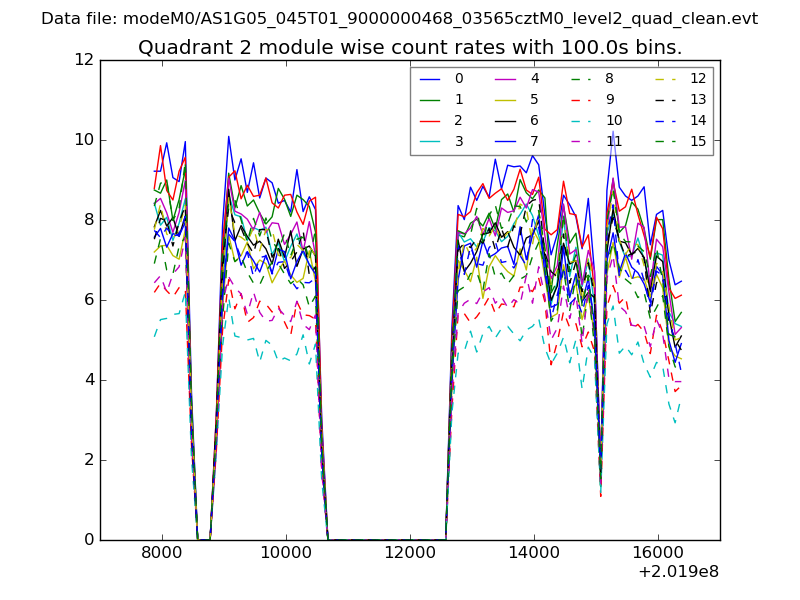 |
 |
| Module-wise count rates for Quadrant D Data is divided into 100 sec bins |
 |
 |
| Parameter | Plot |
|---|---|
| CZT HV Monitor | 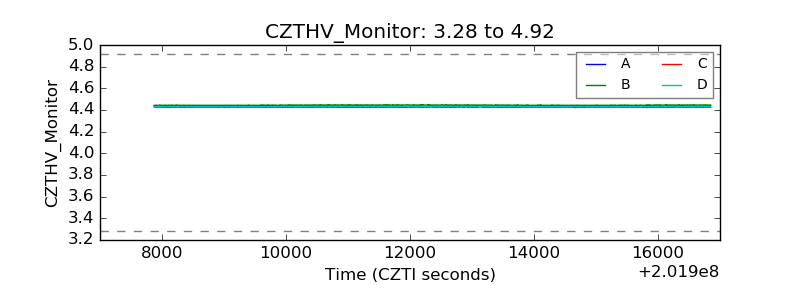 |
| D_VDD | 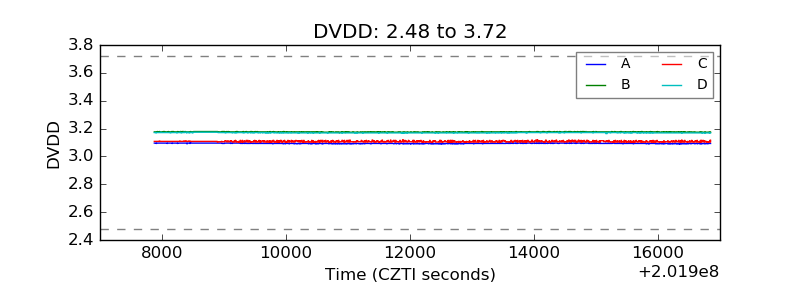 |
| Temperature 1 | 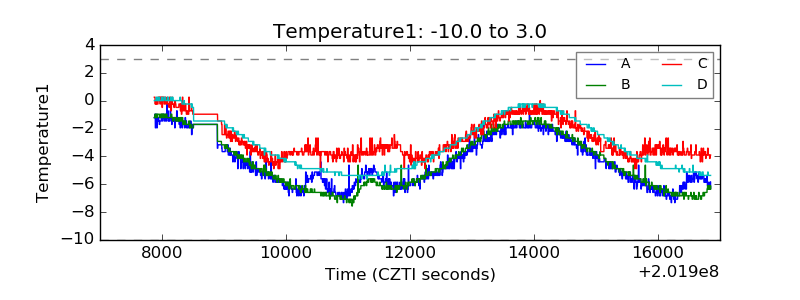 |
| Veto HV Monitor | 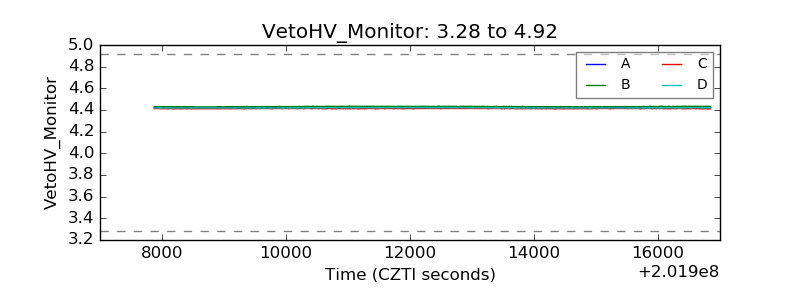 |
| Veto LLD | 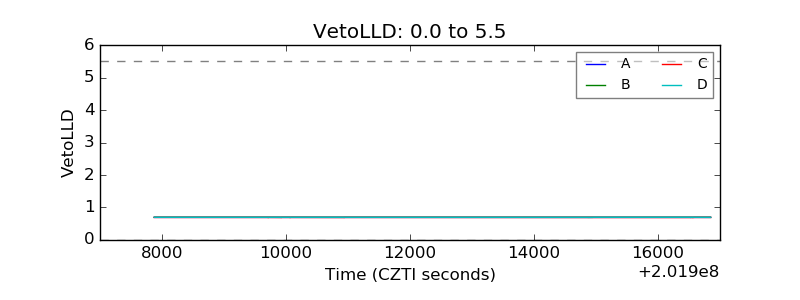 |
| Alpha Counter | 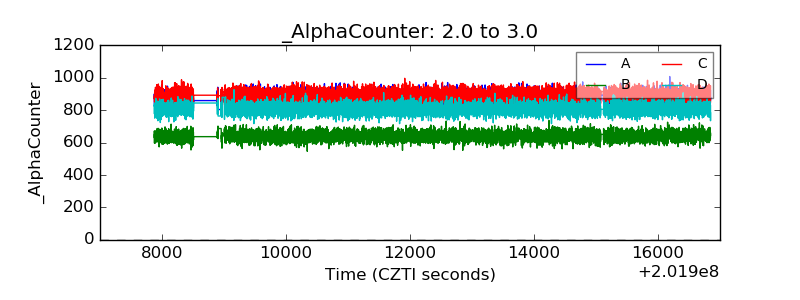 |
| _CPM_Rate | 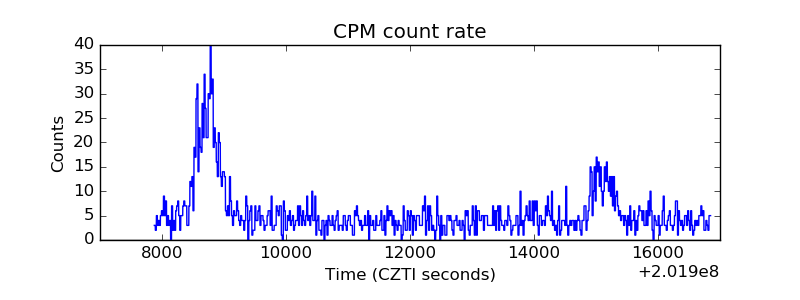 |
| CZT Counter |  |
| +2.5 Volts monitor |  |
| +5 Volts monitor |  |
| _ROLL_ROT | 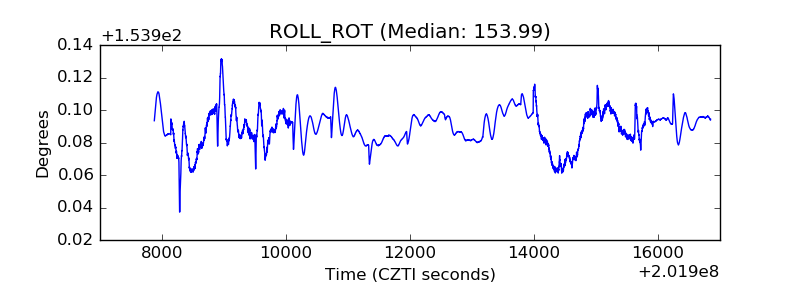 |
| _Roll_DEC | 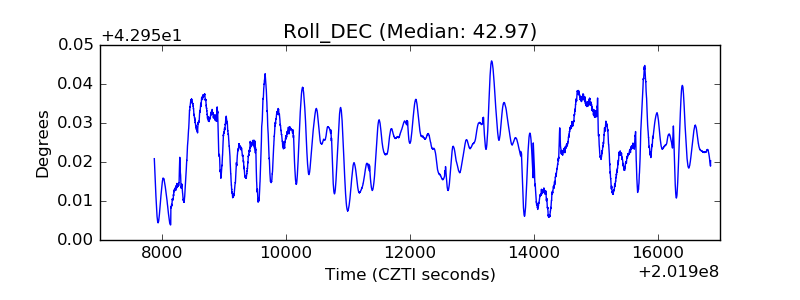 |
| _Roll_RA | 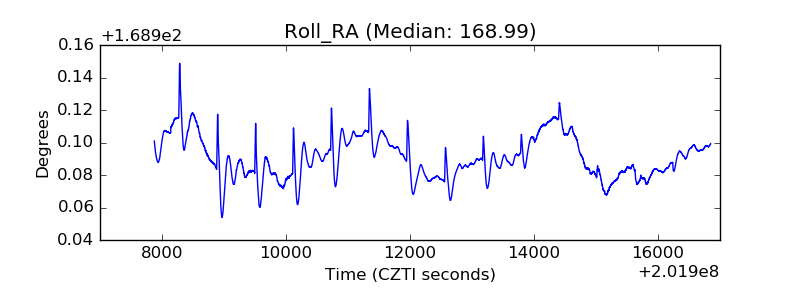 |
| Veto Counter | 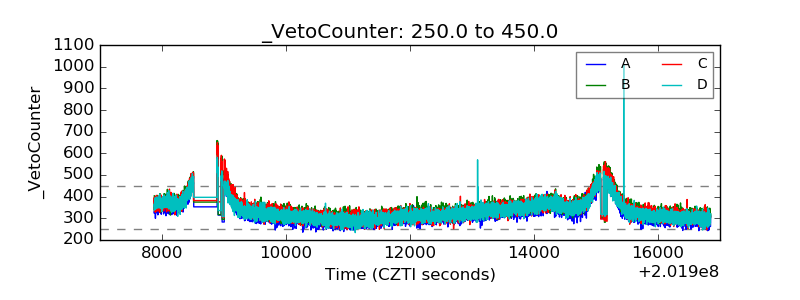 |