| Param | Original file | Final file |
|---|---|---|
| Filename | modeM0/AS1G05_045T01_9000000468_03566cztM0_level2.evt | modeM0/AS1G05_045T01_9000000468_03566cztM0_level2_quad_clean.evt |
| Size (bytes) | 615,660,480 | 89,850,240 |
| Size | 587.1 MB | 85.7 MB |
| Events in quadrant A | 3,755,372 | 549,156 |
| Events in quadrant B | 4,330,926 | 548,648 |
| Events in quadrant C | 6,283,532 | 512,082 |
| Events in quadrant D | 3,711,384 | 532,816 |
| Mode M0 | |||
|---|---|---|---|
| Quadrant | BADHDUFLAG | Total packets | Discarded packets |
| A | 0 | 17265 | 3 |
| B | 0 | 18763 | 2 |
| C | 0 | 24494 | 2 |
| D | 0 | 17512 | 2 |
| Mode M9 | |||
|---|---|---|---|
| Quadrant | BADHDUFLAG | Total packets | Discarded packets |
| A | 0 | 4 | 0 |
| B | 0 | 4 | 0 |
| C | 0 | 4 | 0 |
| D | 0 | 4 | 0 |
| Mode SS | |||
|---|---|---|---|
| Quadrant | BADHDUFLAG | Total packets | Discarded packets |
| A | 0 | 172 | 0 |
| B | 0 | 172 | 0 |
| C | 0 | 172 | 0 |
| D | 0 | 172 | 0 |
| Quadrant | Total seconds | Saturated seconds | Saturation percentage |
|---|---|---|---|
| A | 8315 | 96 | 1.154540% |
| B | 8315 | 191 | 2.297054% |
| C | 8315 | 783 | 9.416717% |
| D | 8315 | 58 | 0.697535% |
Noise dominated data is calculated using 1-second bins in cleaned event files. If a bin has >2000 counts, and if more than 50% of those come from <1% of pixels, then it is considered to be noise-dominated and hence unusable.
| Quadrant | # 1 sec bins | Bins with >0 counts | Bins with >2000 counts | High rate bins dominated by noise | Noise dominated (total time) | Noise dominated (detector-on time) | Marked lightcurve |
|---|---|---|---|---|---|---|---|
| A | 8630 | 8318 | 5 | 5 | 0.06% | 0.06% | 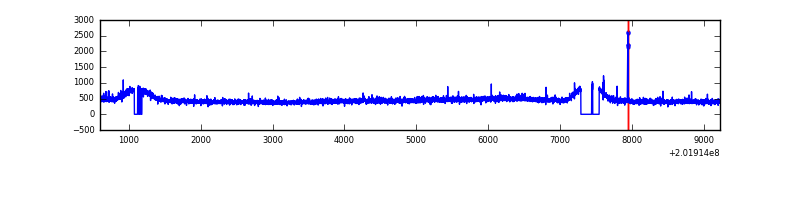 |
| B | 8630 | 8315 | 31 | 31 | 0.36% | 0.37% | 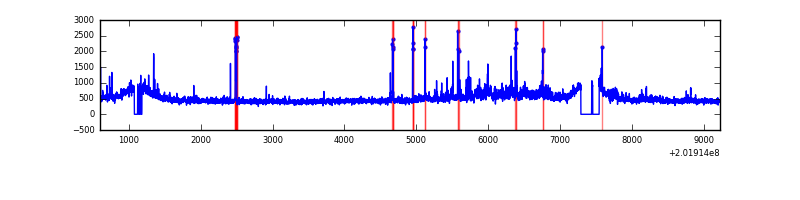 |
| C | 8630 | 8317 | 572 | 572 | 6.63% | 6.88% | 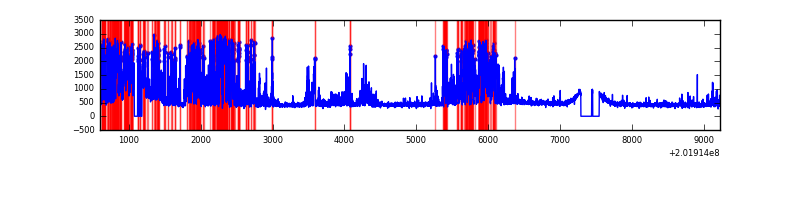 |
| D | 8630 | 8320 | 17 | 17 | 0.20% | 0.20% | 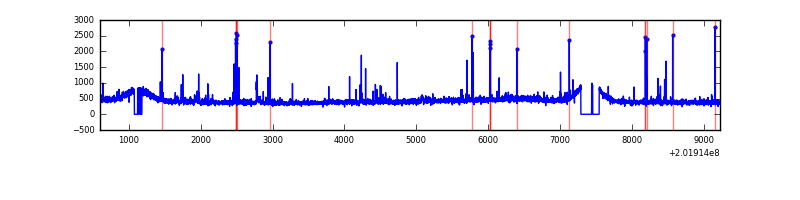 |
Top three noisy pixels from each quadrant. If the there are fewer than three noisy pixels in the level2.evt file, extra rows are filled as -1
| Pixel properties | Quadrant properties | ||||||
|---|---|---|---|---|---|---|---|
| Quadrant | DetID | PixID | Counts | Sigma | Mean | Median | Sigma |
| A | 0 | 50 | 23337 | 114.29 | 956 | 932 | 196.0 |
| A | 0 | 118 | 16295 | 78.37 | 956 | 932 | 196.0 |
| A | 3 | 1 | 14443 | 68.92 | 956 | 932 | 196.0 |
| B | 15 | 204 | 328137 | 1736.5 | 971 | 945 | 188.4 |
| B | 4 | 200 | 59864 | 312.7 | 971 | 945 | 188.4 |
| B | 6 | 205 | 50607 | 263.57 | 971 | 945 | 188.4 |
| C | 15 | 208 | 2660256 | 12432.11 | 908 | 911 | 213.9 |
| C | 1 | 16 | 38406 | 175.28 | 908 | 911 | 213.9 |
| C | 8 | 128 | 18157 | 80.62 | 908 | 911 | 213.9 |
| D | 5 | 233 | 47146 | 203.24 | 935 | 904 | 227.5 |
| D | 13 | 223 | 38821 | 166.65 | 935 | 904 | 227.5 |
| D | 13 | 46 | 26292 | 111.58 | 935 | 904 | 227.5 |
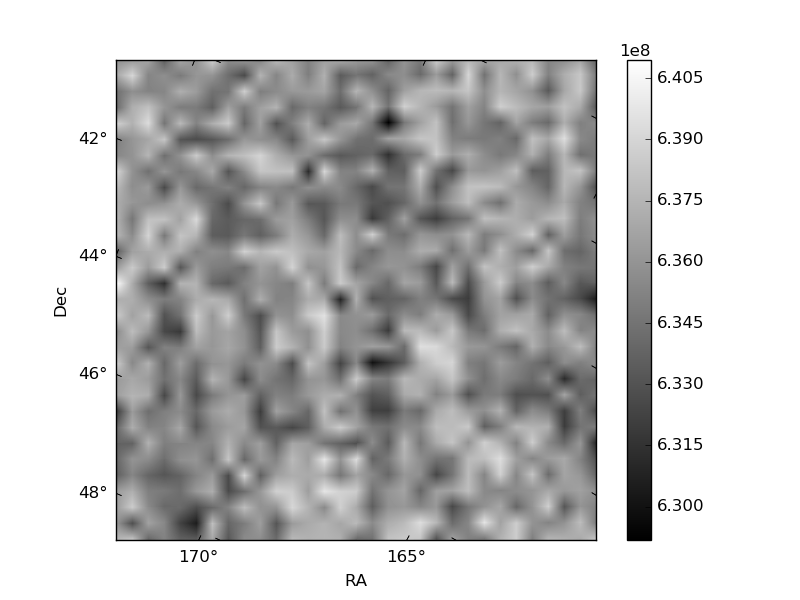
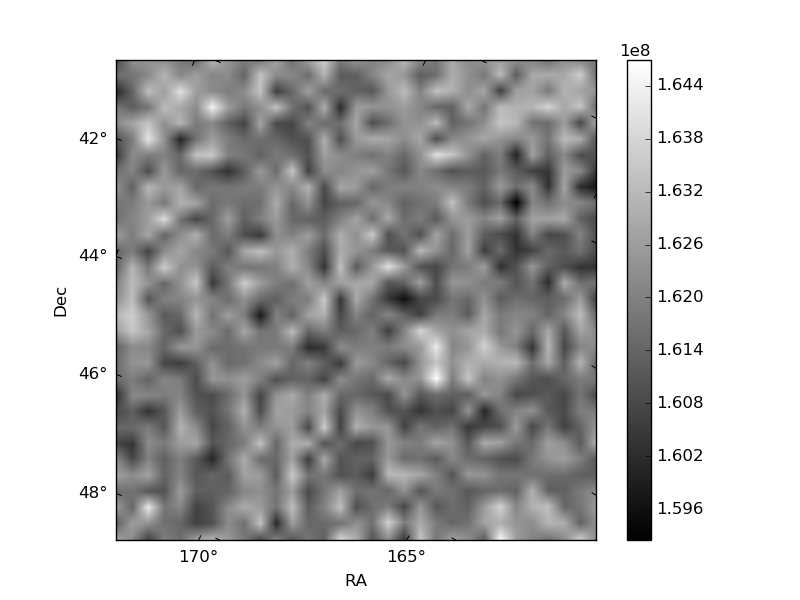
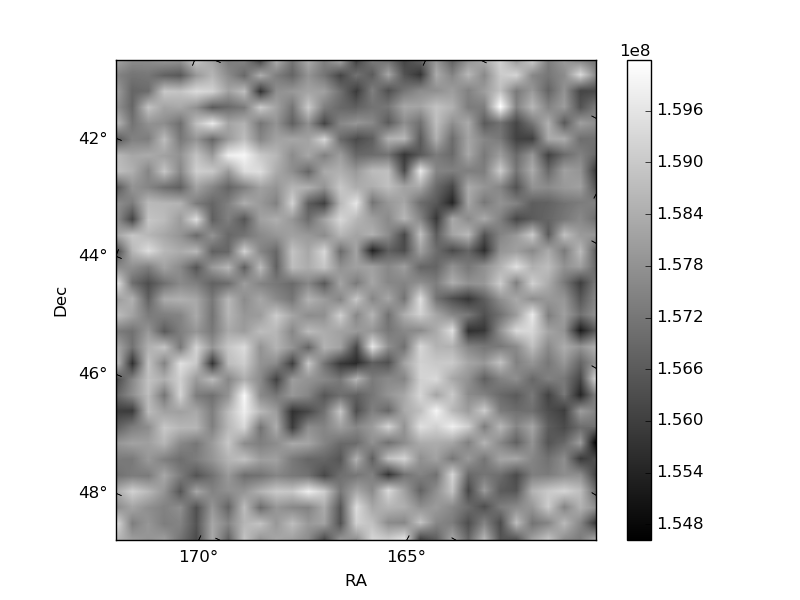
Histogram calculated using DETX and DETY for each event in the final _common_clean file
| Quadrant A | 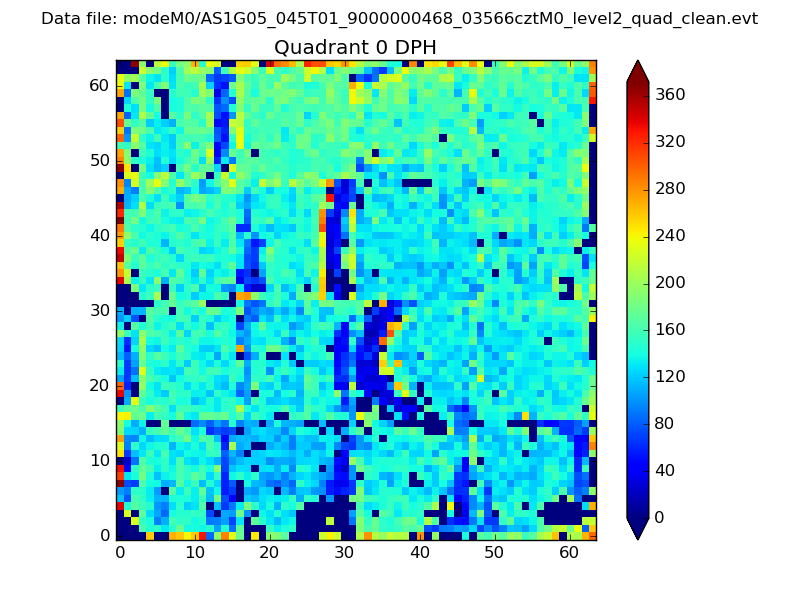 |
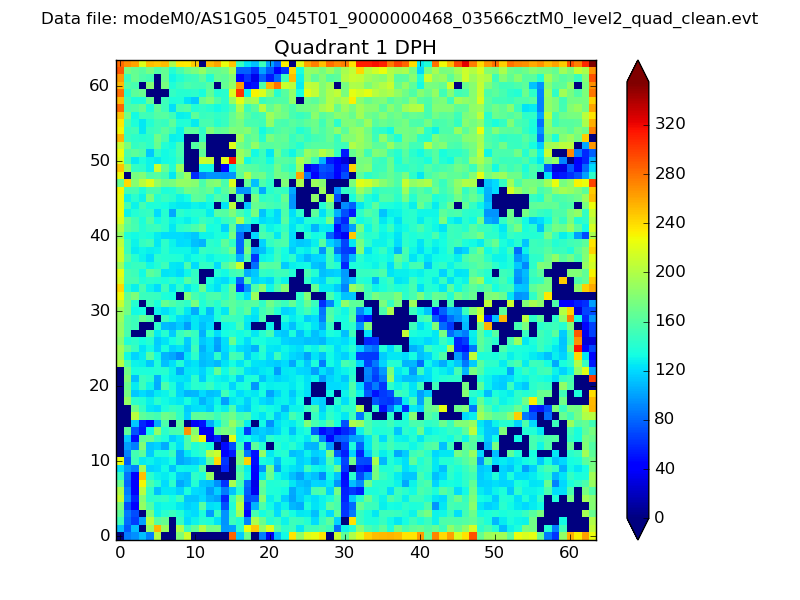 |
Quadrant B |
|---|---|---|---|
| Quadrant D | 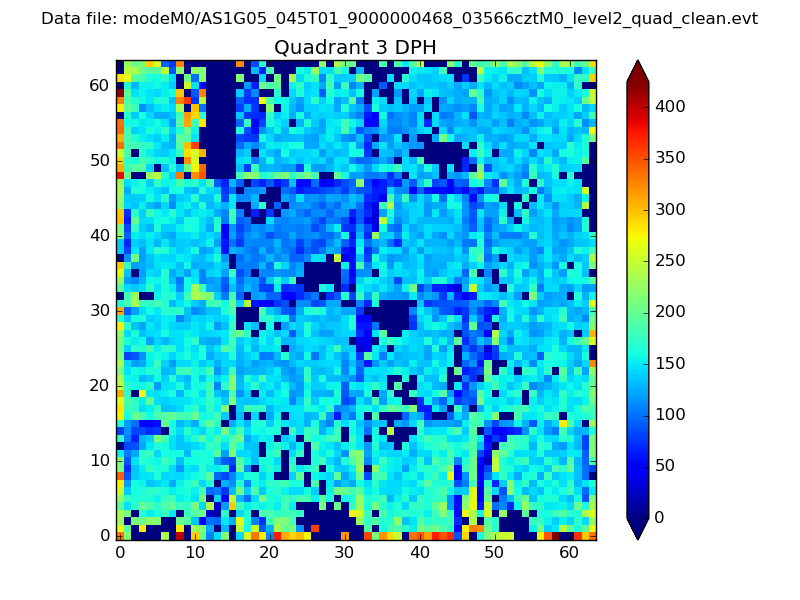 |
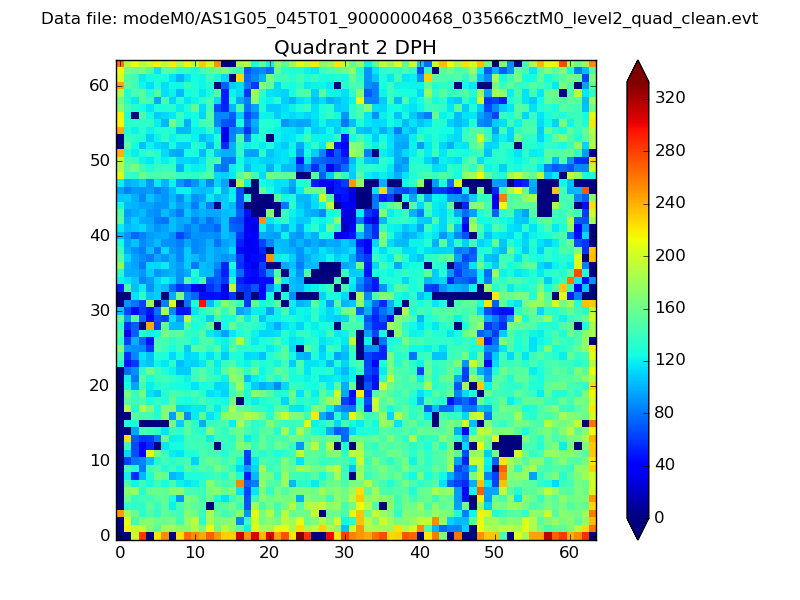 |
Quadrant C |
| Plot type | Count rate plots | Images |
|---|---|---|
| Comparison with Poisson distribution Blue bars denote a histogram of data divided into 1 sec bins. Red curve is a Poisson curve with rate = median count rate of data. |
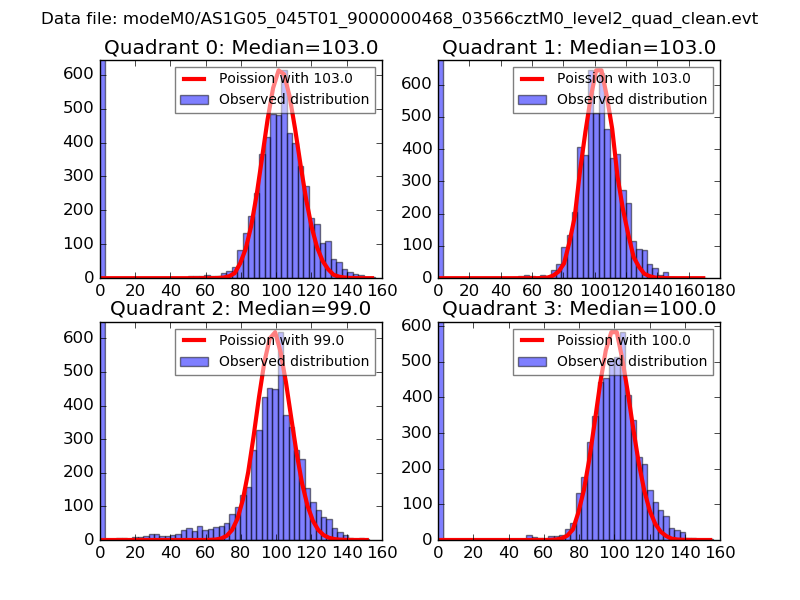 |
 |
| Quadrant-wise count rates Data is divided into 100 sec bins |
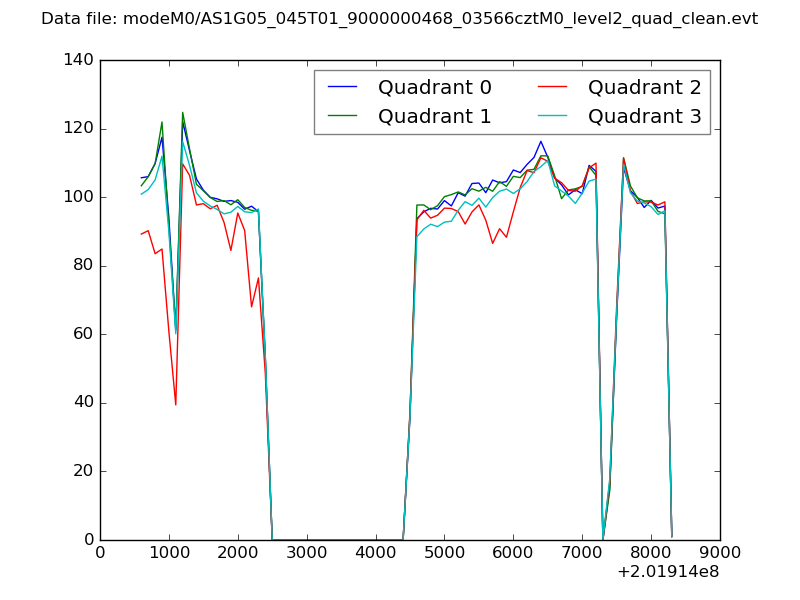 |
|
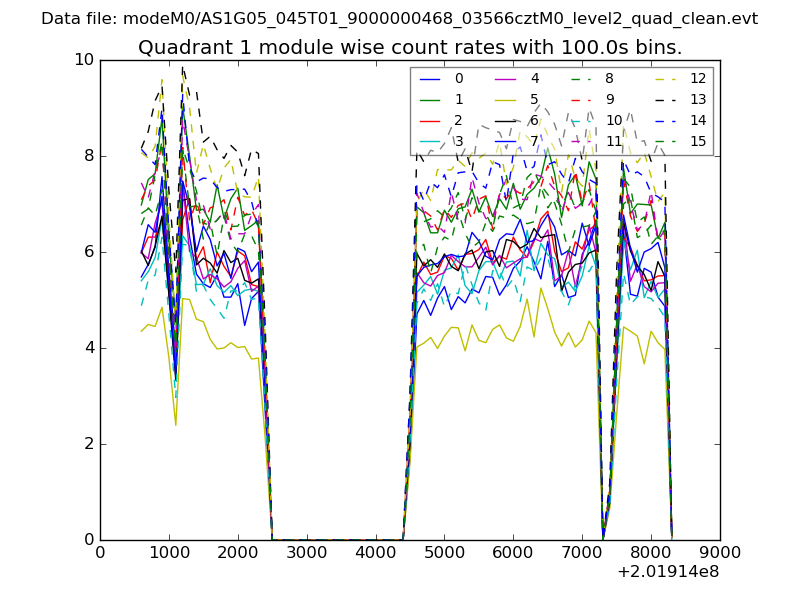
| Module-wise count rates for Quadrant A Data is divided into 100 sec bins |
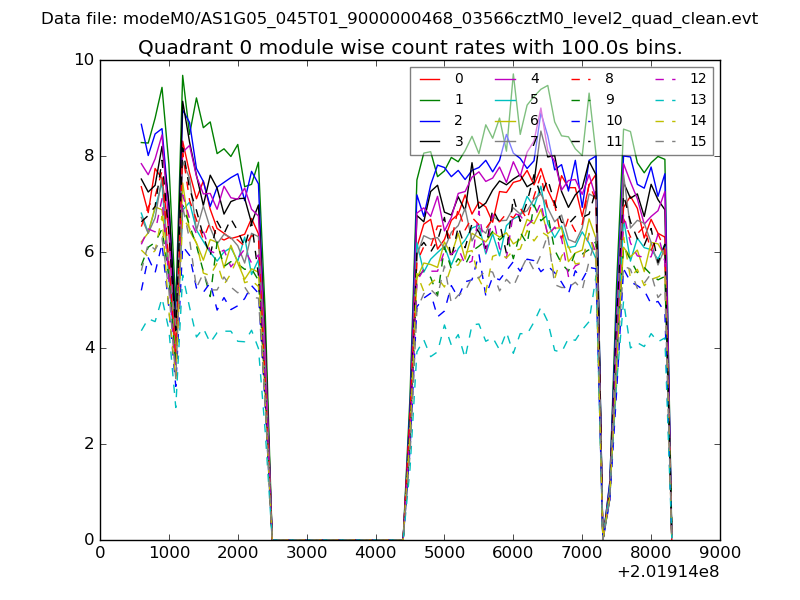 |
 |
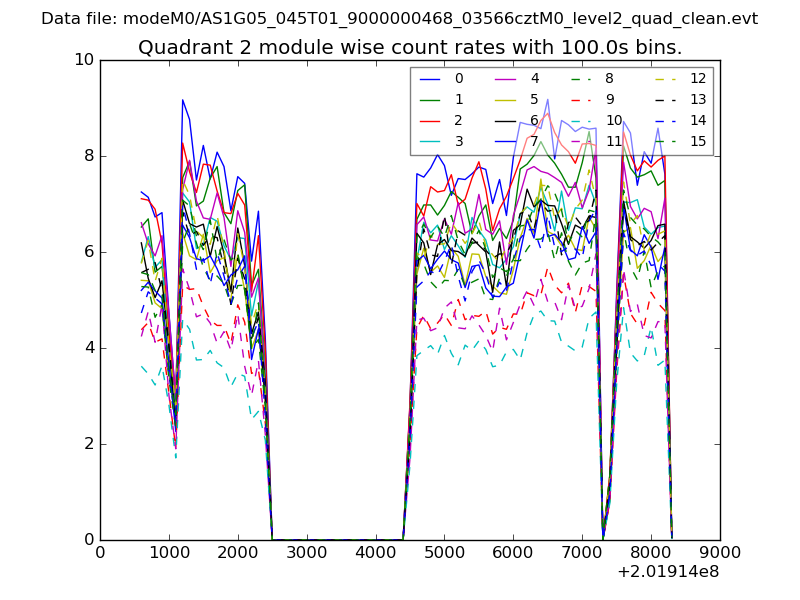
| Module-wise count rates for Quadrant B Data is divided into 100 sec bins |
 |
 |
| Module-wise count rates for Quadrant C Data is divided into 100 sec bins |
 |
 |
| Module-wise count rates for Quadrant D Data is divided into 100 sec bins |
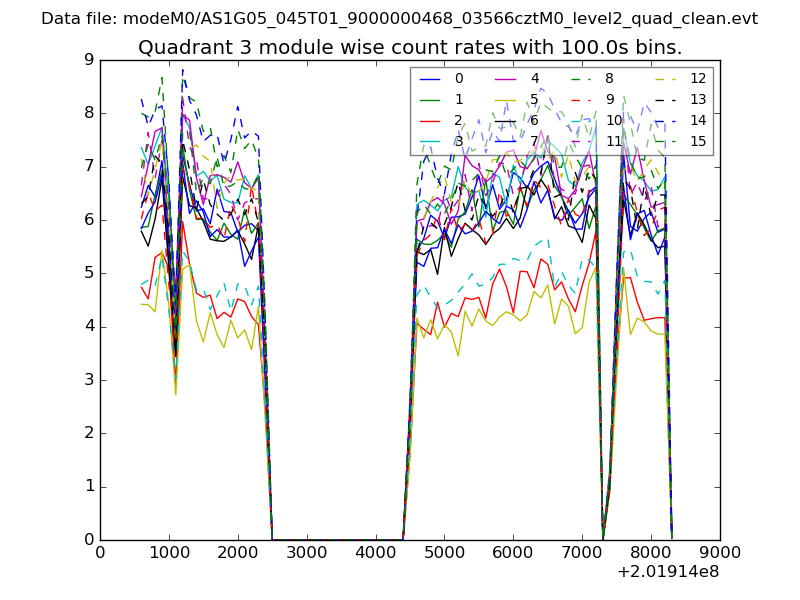 |
 |
| Parameter | Plot |
|---|---|
| CZT HV Monitor | 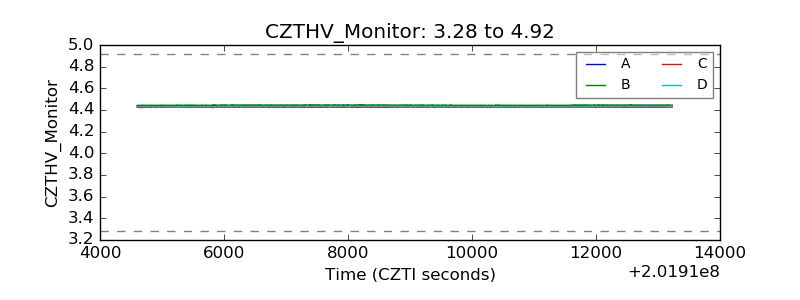 |
| D_VDD | 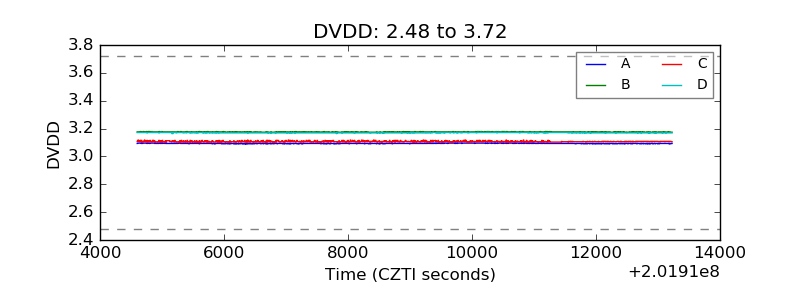 |
| Temperature 1 | 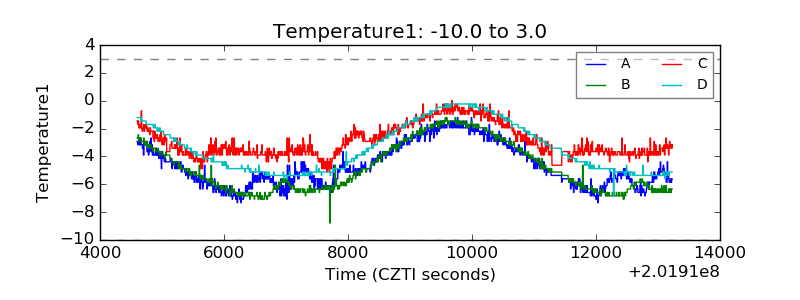 |
| Veto HV Monitor | 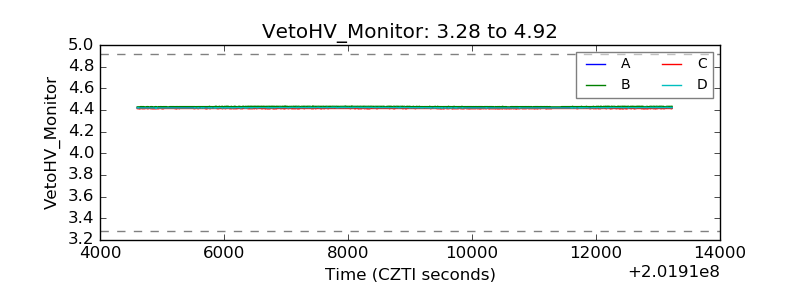 |
| Veto LLD | 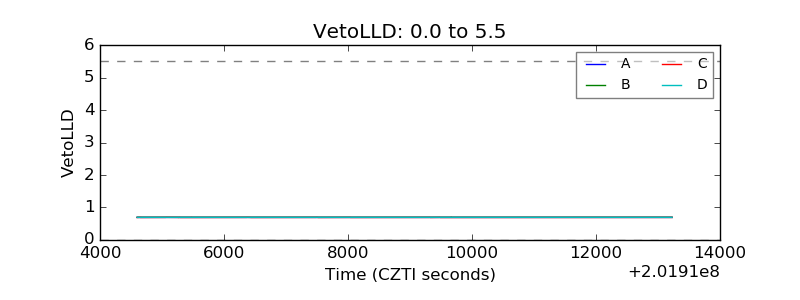 |
| Alpha Counter | 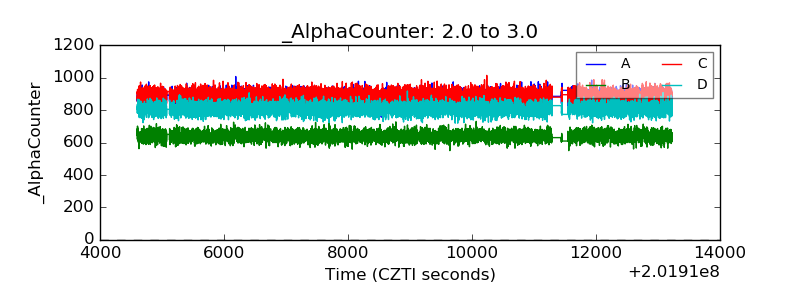 |
| _CPM_Rate | 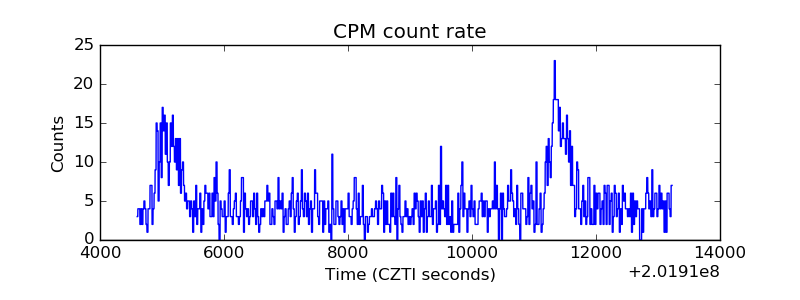 |
| CZT Counter | 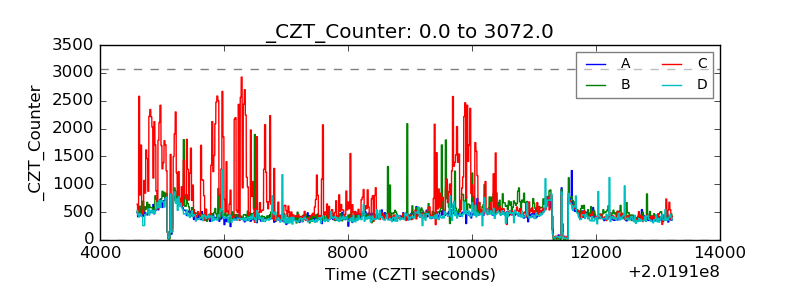 |
| +2.5 Volts monitor |  |
| +5 Volts monitor | 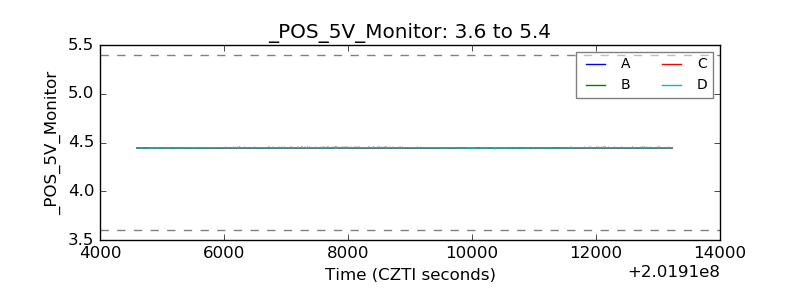 |
| _ROLL_ROT | 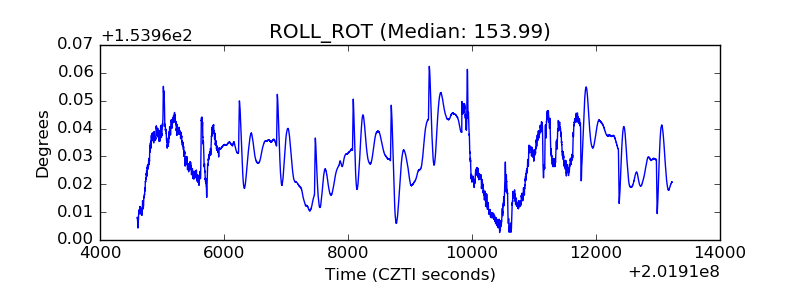 |
| _Roll_DEC | 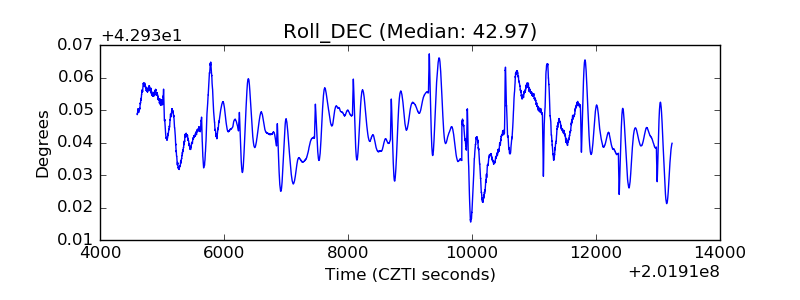 |
| _Roll_RA | 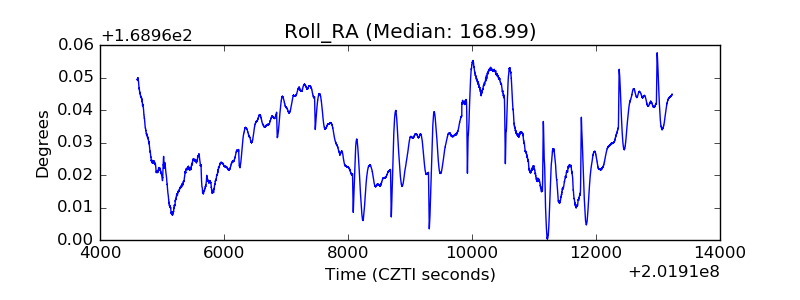 |
| Veto Counter | 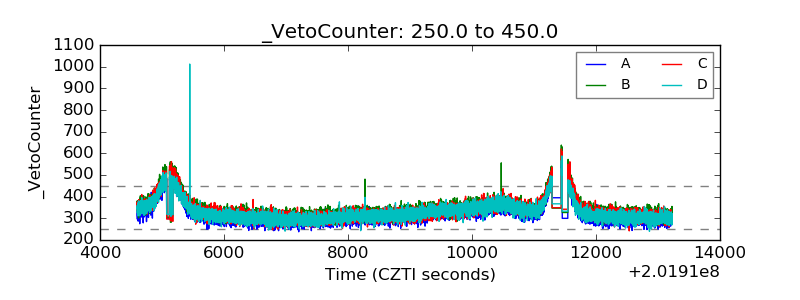 |