| Param | Original file | Final file |
|---|---|---|
| Filename | modeM0/AS1G05_045T01_9000000468_03569cztM0_level2.evt | modeM0/AS1G05_045T01_9000000468_03569cztM0_level2_quad_clean.evt |
| Size (bytes) | 1,161,967,680 | 183,395,520 |
| Size | 1.1 GB | 174.9 MB |
| Events in quadrant A | 8,229,466 | 1,084,940 |
| Events in quadrant B | 9,375,814 | 1,079,407 |
| Events in quadrant C | 8,228,318 | 1,077,287 |
| Events in quadrant D | 8,114,064 | 1,047,352 |
| Mode M0 | |||
|---|---|---|---|
| Quadrant | BADHDUFLAG | Total packets | Discarded packets |
| A | 0 | 37529 | 6 |
| B | 0 | 39872 | 3 |
| C | 0 | 37632 | 5 |
| D | 0 | 38055 | 3 |
| Mode M9 | |||
|---|---|---|---|
| Quadrant | BADHDUFLAG | Total packets | Discarded packets |
| A | 0 | 17 | 0 |
| B | 0 | 17 | 0 |
| C | 0 | 17 | 0 |
| D | 0 | 17 | 0 |
| Mode SS | |||
|---|---|---|---|
| Quadrant | BADHDUFLAG | Total packets | Discarded packets |
| A | 0 | 374 | 0 |
| B | 0 | 374 | 0 |
| C | 0 | 374 | 0 |
| D | 0 | 374 | 0 |
| Quadrant | Total seconds | Saturated seconds | Saturation percentage |
|---|---|---|---|
| A | 18351 | 236 | 1.286033% |
| B | 18352 | 251 | 1.367698% |
| C | 18351 | 171 | 0.931829% |
| D | 18352 | 200 | 1.089799% |
Noise dominated data is calculated using 1-second bins in cleaned event files. If a bin has >2000 counts, and if more than 50% of those come from <1% of pixels, then it is considered to be noise-dominated and hence unusable.
| Quadrant | # 1 sec bins | Bins with >0 counts | Bins with >2000 counts | High rate bins dominated by noise | Noise dominated (total time) | Noise dominated (detector-on time) | Marked lightcurve |
|---|---|---|---|---|---|---|---|
| A | 20146 | 18351 | 7 | 7 | 0.03% | 0.04% | 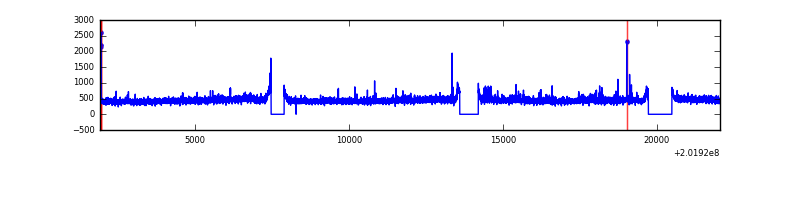 |
| B | 20146 | 18351 | 4 | 4 | 0.02% | 0.02% | 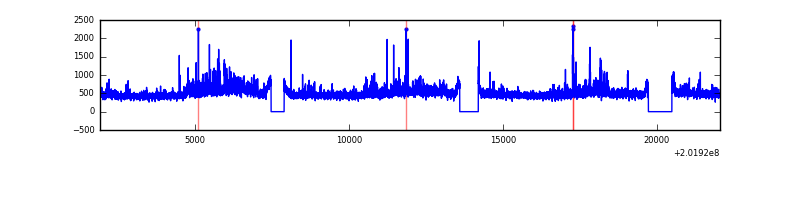 |
| C | 20146 | 18351 | 5 | 5 | 0.02% | 0.03% | 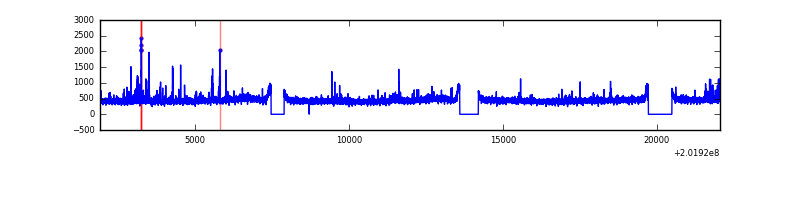 |
| D | 20146 | 18351 | 40 | 40 | 0.20% | 0.22% | 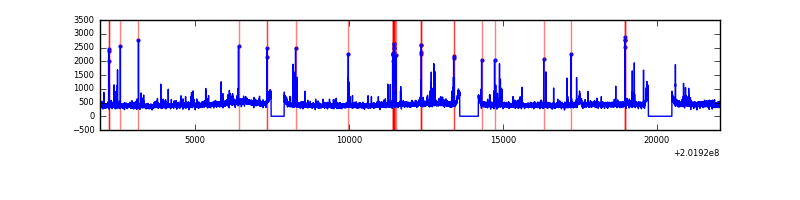 |
Top three noisy pixels from each quadrant. If the there are fewer than three noisy pixels in the level2.evt file, extra rows are filled as -1
| Pixel properties | Quadrant properties | ||||||
|---|---|---|---|---|---|---|---|
| Quadrant | DetID | PixID | Counts | Sigma | Mean | Median | Sigma |
| A | 3 | 1 | 107083 | 246.26 | 2077 | 2024 | 426.6 |
| A | 0 | 50 | 64445 | 146.32 | 2077 | 2024 | 426.6 |
| A | 0 | 118 | 29583 | 64.6 | 2077 | 2024 | 426.6 |
| B | 15 | 204 | 939023 | 2278.33 | 2107 | 2050 | 411.3 |
| B | 4 | 81 | 55880 | 130.89 | 2107 | 2050 | 411.3 |
| B | 0 | 228 | 54264 | 126.96 | 2107 | 2050 | 411.3 |
| C | 15 | 208 | 175371 | 366.74 | 2026 | 2033 | 472.6 |
| C | 1 | 16 | 89175 | 184.37 | 2026 | 2033 | 472.6 |
| C | 8 | 128 | 19333 | 36.6 | 2026 | 2033 | 472.6 |
| D | 13 | 223 | 117294 | 237.23 | 2016 | 1960 | 486.2 |
| D | 2 | 37 | 76802 | 153.94 | 2016 | 1960 | 486.2 |
| D | 12 | 32 | 66341 | 132.43 | 2016 | 1960 | 486.2 |
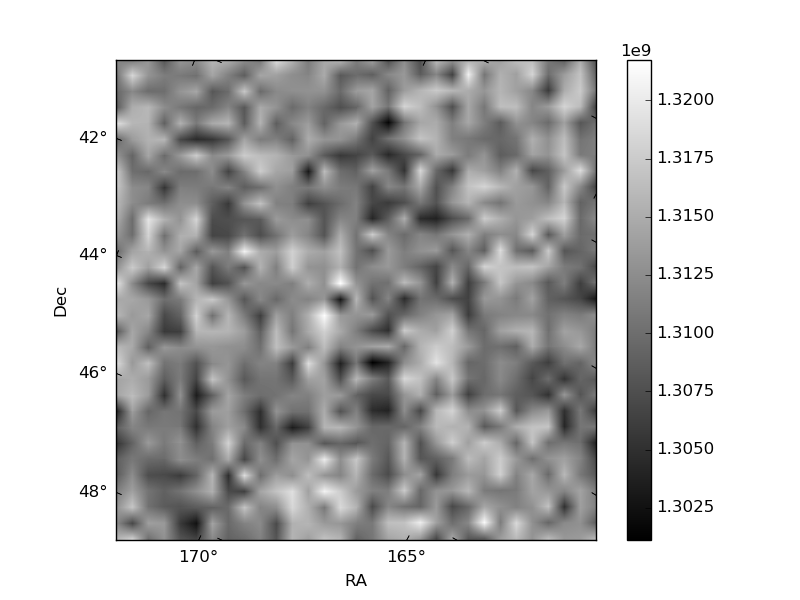
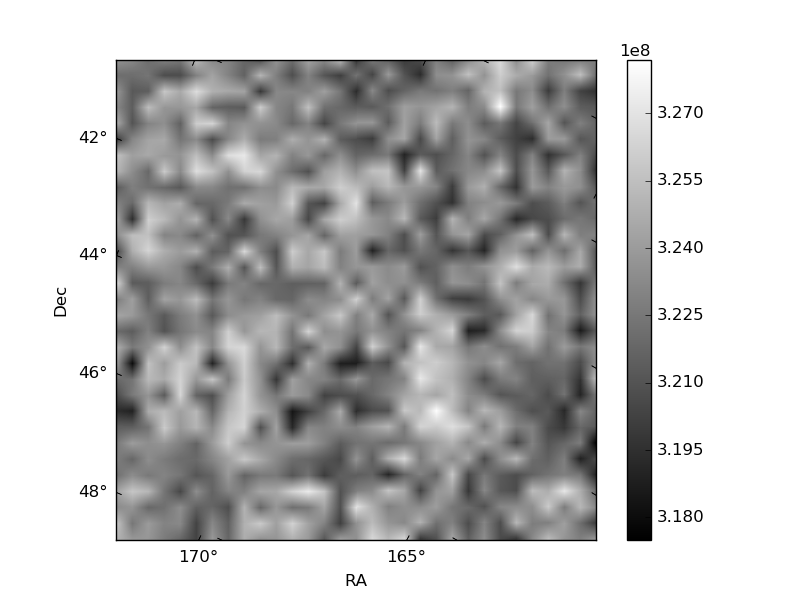
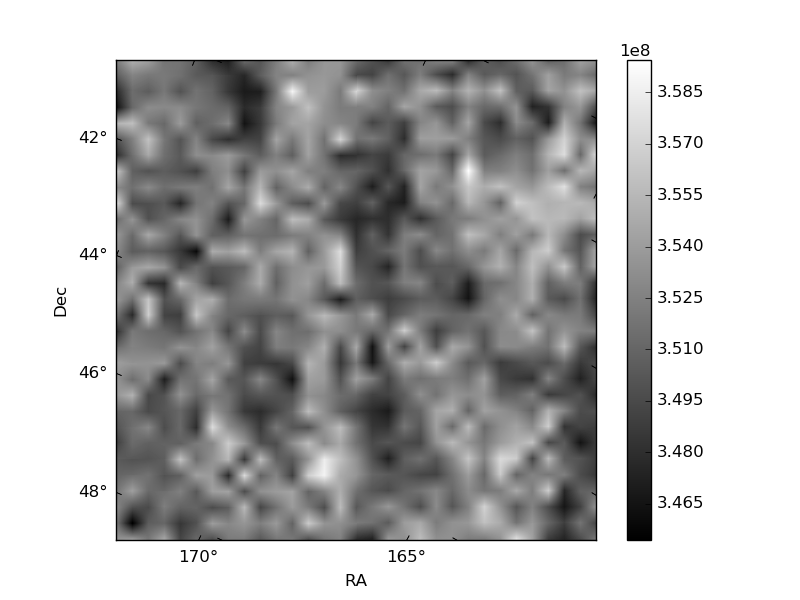
Histogram calculated using DETX and DETY for each event in the final _common_clean file
| Quadrant A | 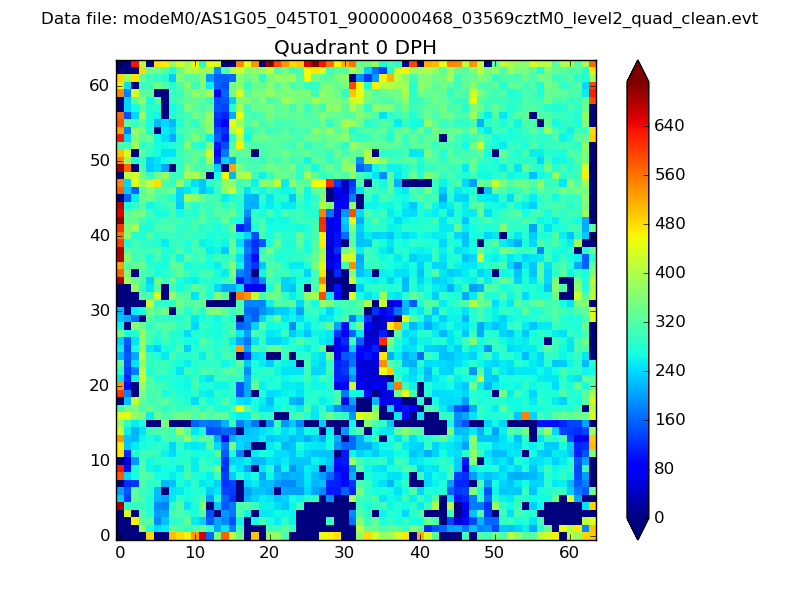 |
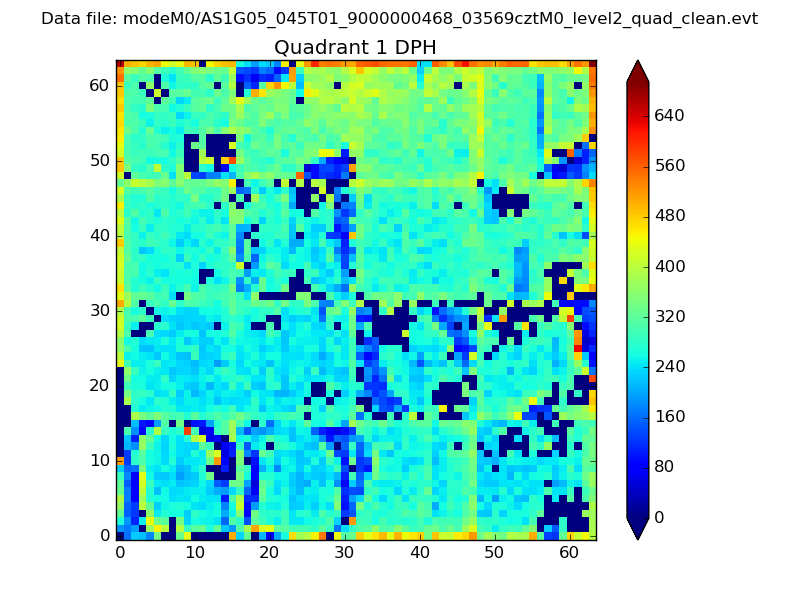 |
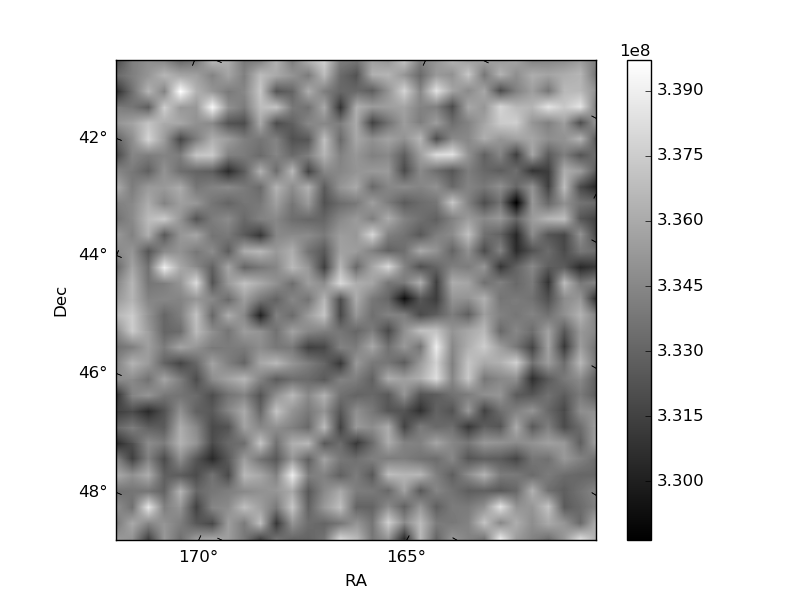
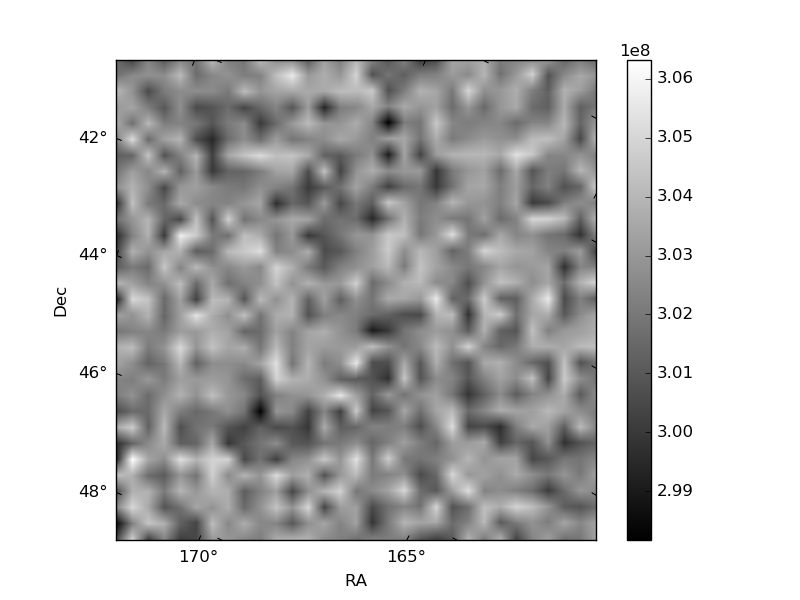
Quadrant B |
|---|---|---|---|
| Quadrant D | 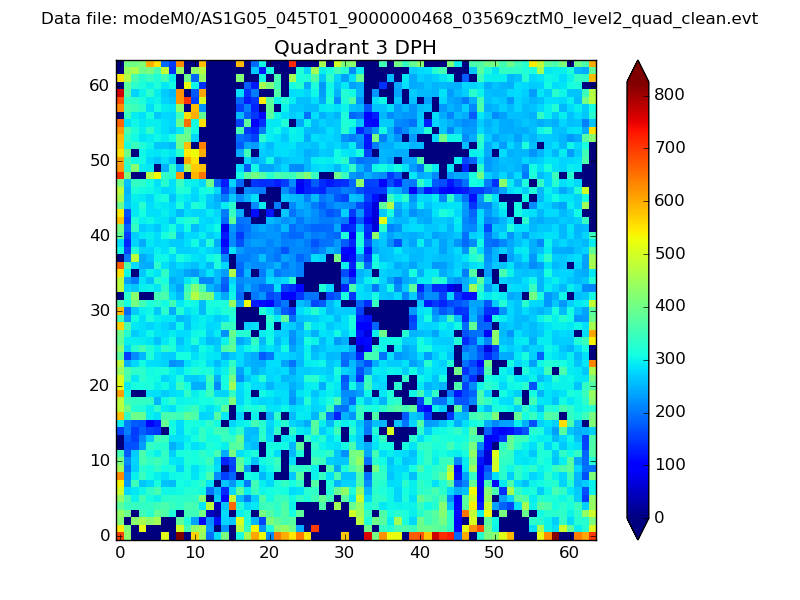 |
 |
Quadrant C |
| Plot type | Count rate plots | Images |
|---|---|---|
| Comparison with Poisson distribution Blue bars denote a histogram of data divided into 1 sec bins. Red curve is a Poisson curve with rate = median count rate of data. |
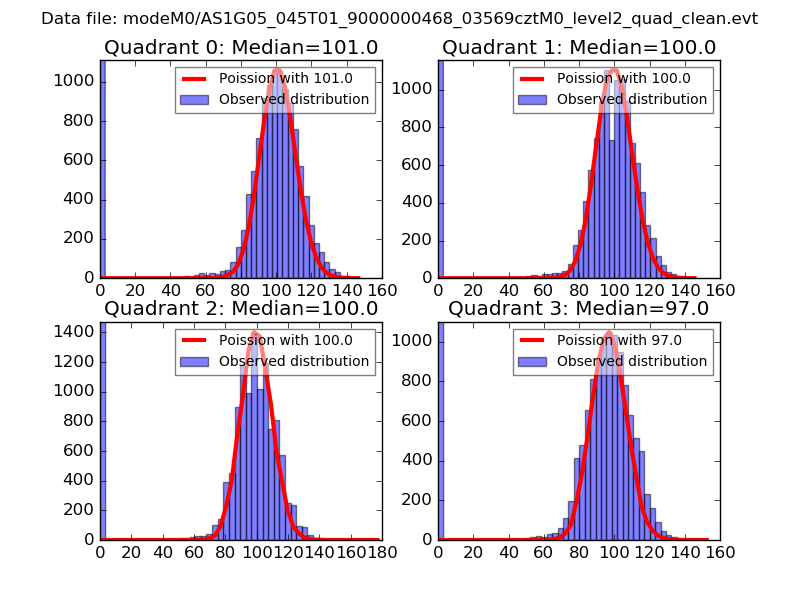 |
 |
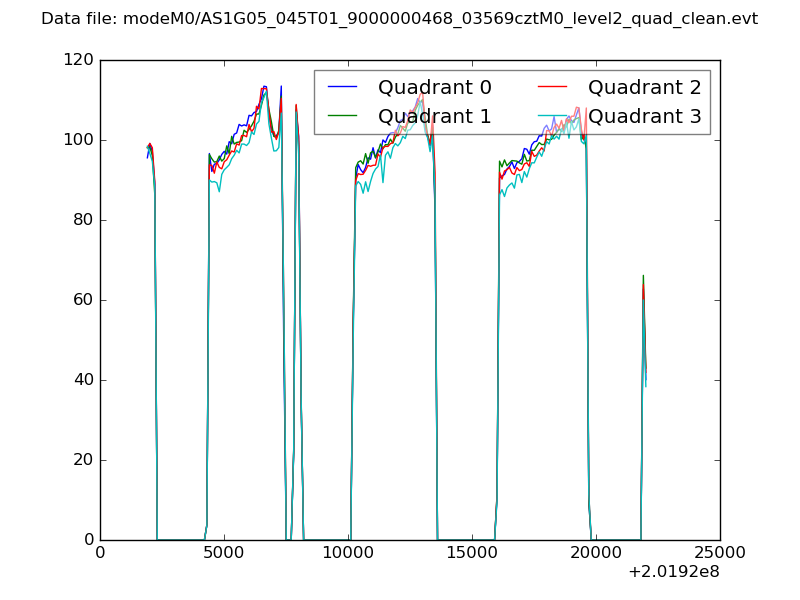
| Quadrant-wise count rates Data is divided into 100 sec bins |
 |
|
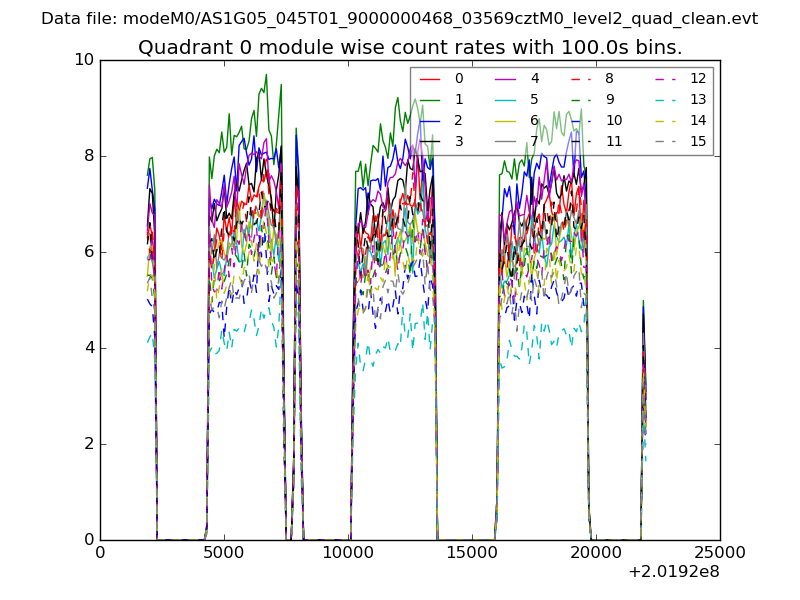
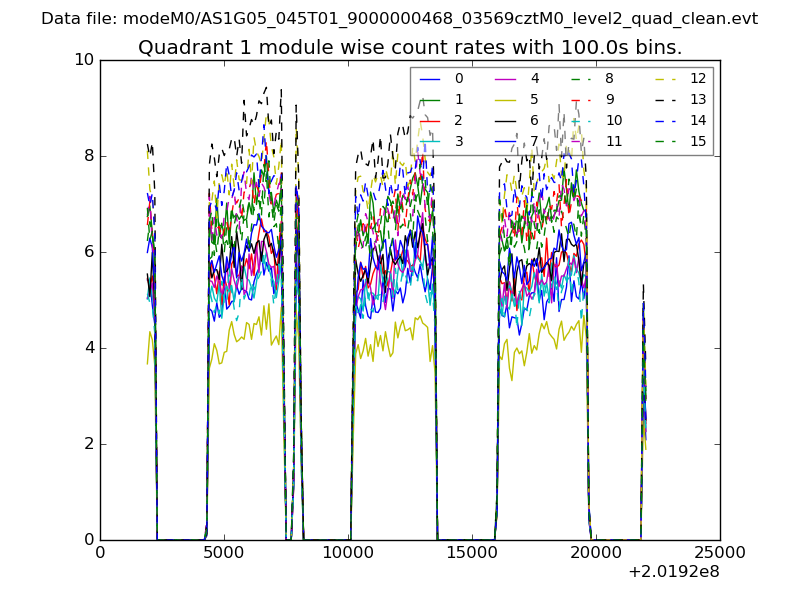
| Module-wise count rates for Quadrant A Data is divided into 100 sec bins |
 |
 |
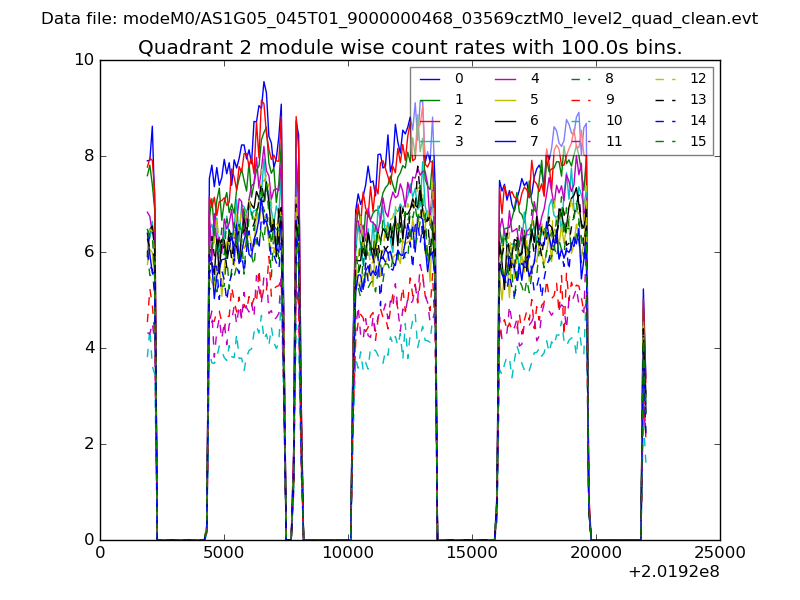
| Module-wise count rates for Quadrant B Data is divided into 100 sec bins |
 |
 |
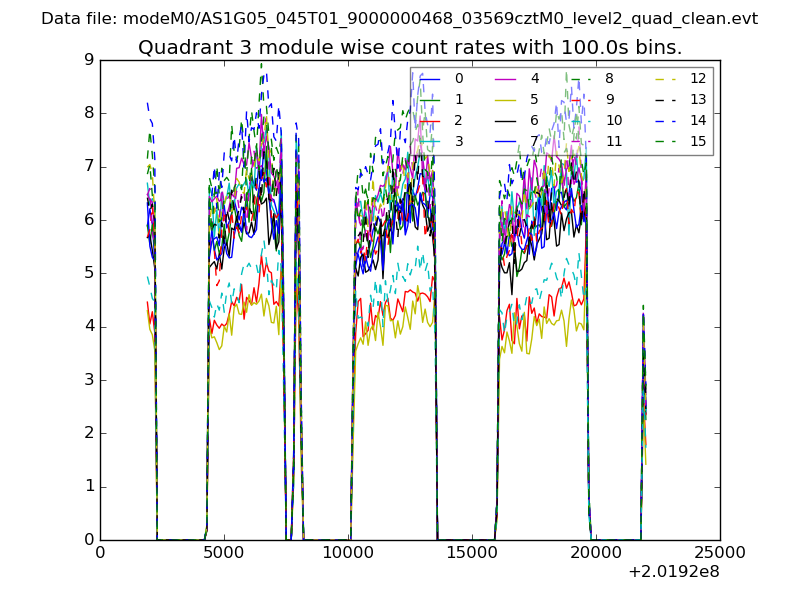
| Module-wise count rates for Quadrant C Data is divided into 100 sec bins |
 |
 |
| Module-wise count rates for Quadrant D Data is divided into 100 sec bins |
 |
 |
| Parameter | Plot |
|---|---|
| CZT HV Monitor | 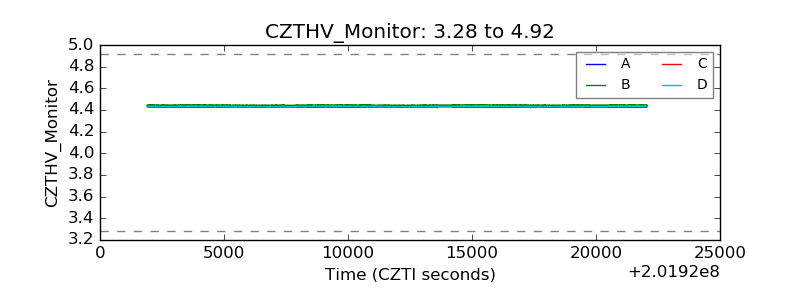 |
| D_VDD | 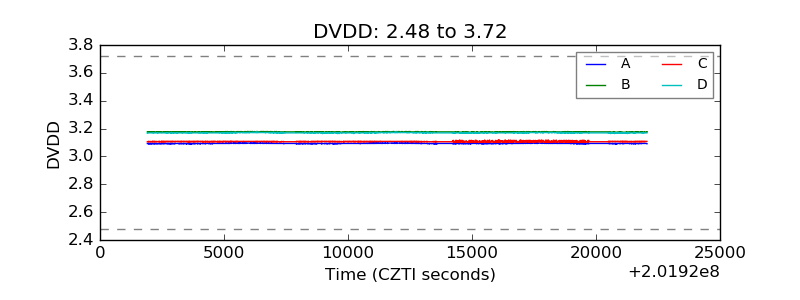 |
| Temperature 1 | 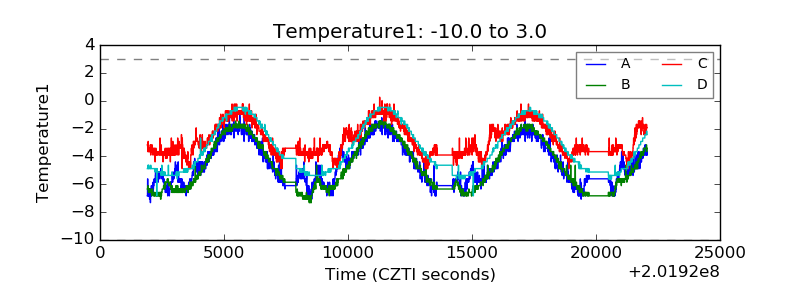 |
| Veto HV Monitor |  |
| Veto LLD | 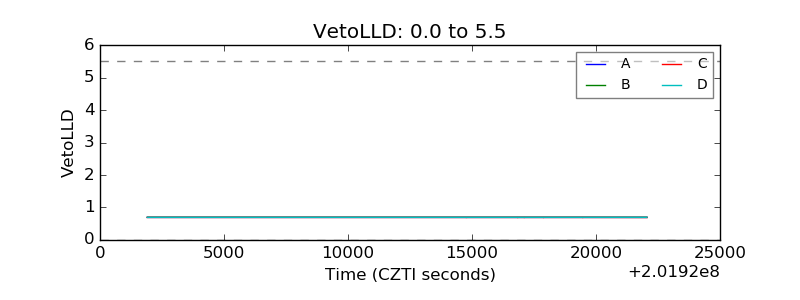 |
| Alpha Counter | 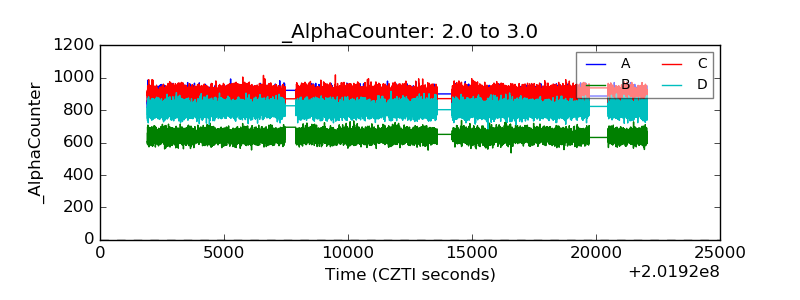 |
| _CPM_Rate | 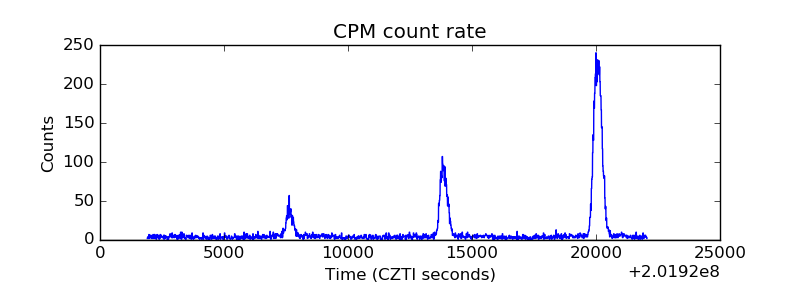 |
| CZT Counter |  |
| +2.5 Volts monitor |  |
| +5 Volts monitor | 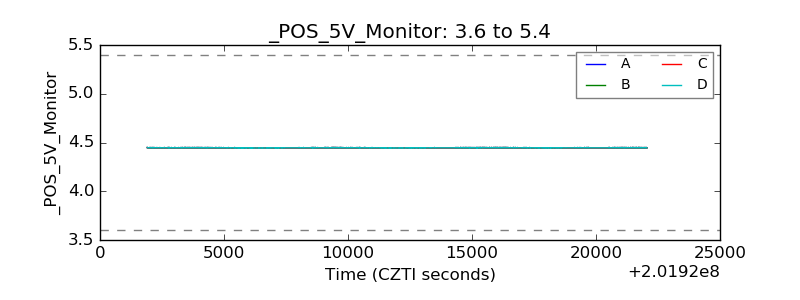 |
| _ROLL_ROT | 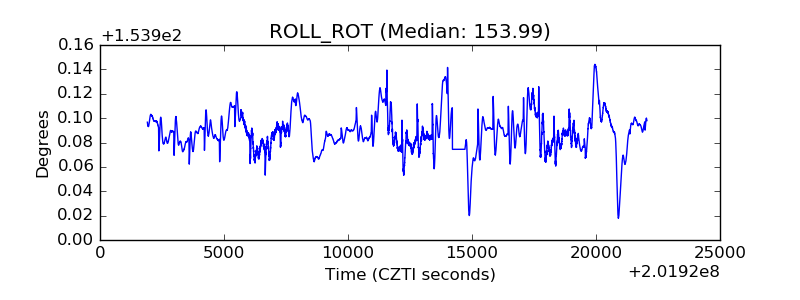 |
| _Roll_DEC | 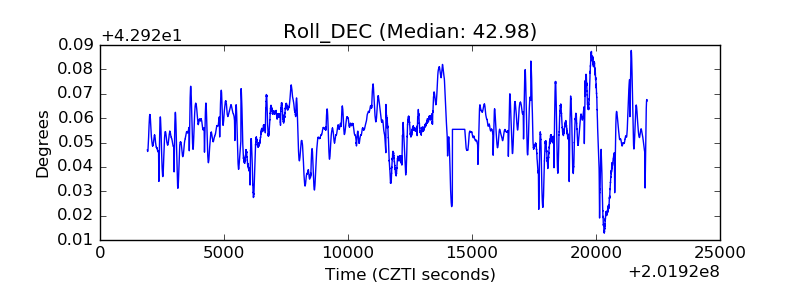 |
| _Roll_RA | 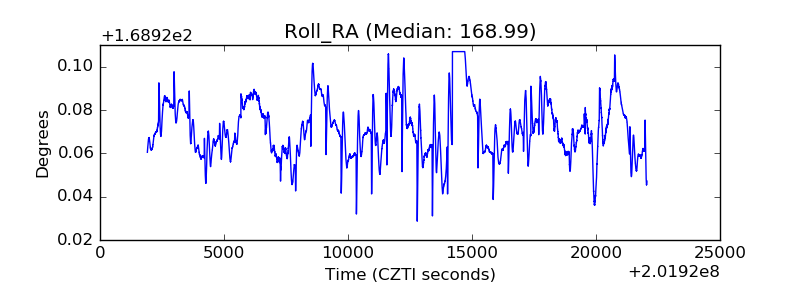 |
| Veto Counter | 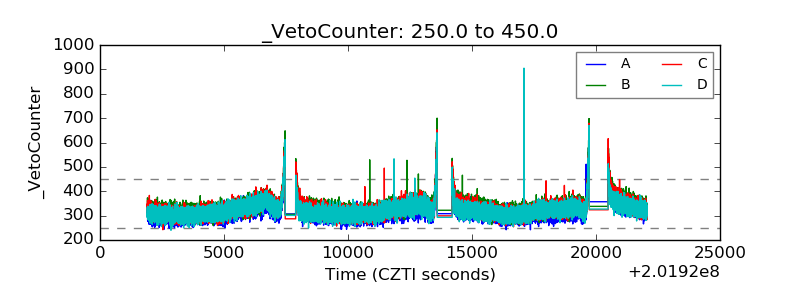 |