| Param | Original file | Final file |
|---|---|---|
| Filename | modeM0/AS1G05_045T01_9000000468_03572cztM0_level2.evt | modeM0/AS1G05_045T01_9000000468_03572cztM0_level2_quad_clean.evt |
| Size (bytes) | 454,199,040 | 79,470,720 |
| Size | 433.2 MB | 75.8 MB |
| Events in quadrant A | 3,271,295 | 491,415 |
| Events in quadrant B | 3,671,920 | 490,998 |
| Events in quadrant C | 3,118,391 | 482,317 |
| Events in quadrant D | 3,232,173 | 468,451 |
| Mode M0 | |||
|---|---|---|---|
| Quadrant | BADHDUFLAG | Total packets | Discarded packets |
| A | 0 | 14278 | 3 |
| B | 0 | 15121 | 2 |
| C | 0 | 13989 | 2 |
| D | 0 | 14474 | 2 |
| Mode M9 | |||
|---|---|---|---|
| Quadrant | BADHDUFLAG | Total packets | Discarded packets |
| A | 0 | 13 | 0 |
| B | 0 | 13 | 0 |
| C | 0 | 13 | 0 |
| D | 0 | 14 | 0 |
| Mode SS | |||
|---|---|---|---|
| Quadrant | BADHDUFLAG | Total packets | Discarded packets |
| A | 0 | 138 | 0 |
| B | 0 | 138 | 0 |
| C | 0 | 138 | 0 |
| D | 0 | 138 | 0 |
| Quadrant | Total seconds | Saturated seconds | Saturation percentage |
|---|---|---|---|
| A | 6789 | 98 | 1.443512% |
| B | 6789 | 118 | 1.738106% |
| C | 6789 | 64 | 0.942701% |
| D | 6789 | 90 | 1.325674% |
Noise dominated data is calculated using 1-second bins in cleaned event files. If a bin has >2000 counts, and if more than 50% of those come from <1% of pixels, then it is considered to be noise-dominated and hence unusable.
| Quadrant | # 1 sec bins | Bins with >0 counts | Bins with >2000 counts | High rate bins dominated by noise | Noise dominated (total time) | Noise dominated (detector-on time) | Marked lightcurve |
|---|---|---|---|---|---|---|---|
| A | 7869 | 6789 | 4 | 4 | 0.05% | 0.06% | 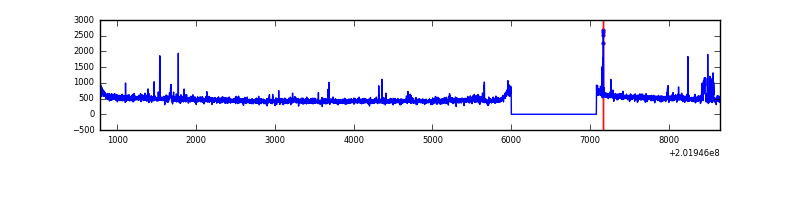 |
| B | 7868 | 6788 | 17 | 17 | 0.22% | 0.25% | 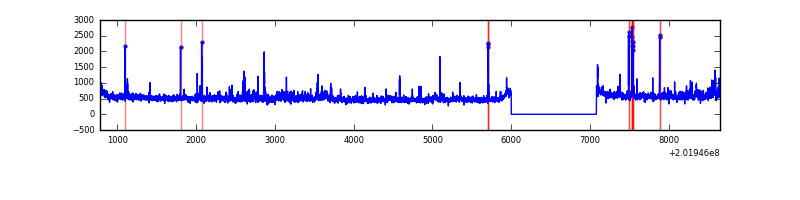 |
| C | 7868 | 6788 | 0 | 0 | 0.00% | 0.00% | 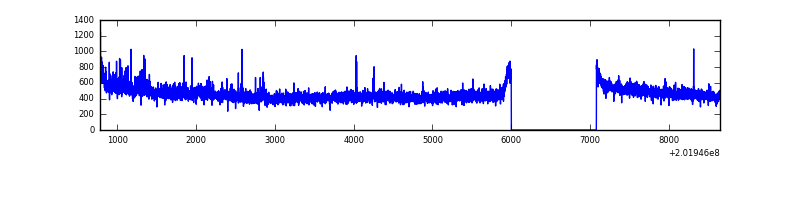 |
| D | 7868 | 6788 | 33 | 33 | 0.42% | 0.49% | 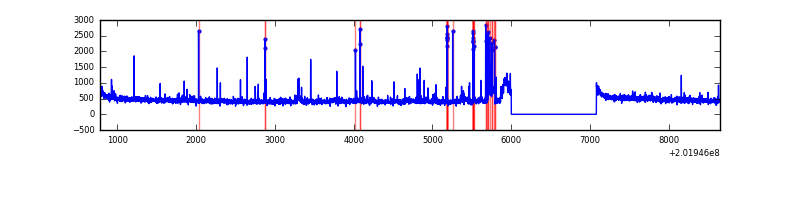 |
Top three noisy pixels from each quadrant. If the there are fewer than three noisy pixels in the level2.evt file, extra rows are filled as -1
| Pixel properties | Quadrant properties | ||||||
|---|---|---|---|---|---|---|---|
| Quadrant | DetID | PixID | Counts | Sigma | Mean | Median | Sigma |
| A | 0 | 118 | 100473 | 596.78 | 809 | 792 | 167.0 |
| A | 15 | 174 | 19979 | 114.87 | 809 | 792 | 167.0 |
| A | 0 | 226 | 17555 | 100.36 | 809 | 792 | 167.0 |
| B | 15 | 204 | 250851 | 1588.82 | 812 | 793 | 157.4 |
| B | 14 | 167 | 61695 | 386.96 | 812 | 793 | 157.4 |
| B | 4 | 81 | 45837 | 286.2 | 812 | 793 | 157.4 |
| C | 15 | 208 | 68953 | 375.46 | 777 | 780 | 181.6 |
| C | 8 | 208 | 7070 | 34.64 | 777 | 780 | 181.6 |
| C | 13 | 61 | 6817 | 33.25 | 777 | 780 | 181.6 |
| D | 1 | 84 | 110046 | 579.85 | 778 | 753 | 188.5 |
| D | 13 | 223 | 75393 | 396.0 | 778 | 753 | 188.5 |
| D | 5 | 233 | 18339 | 93.3 | 778 | 753 | 188.5 |
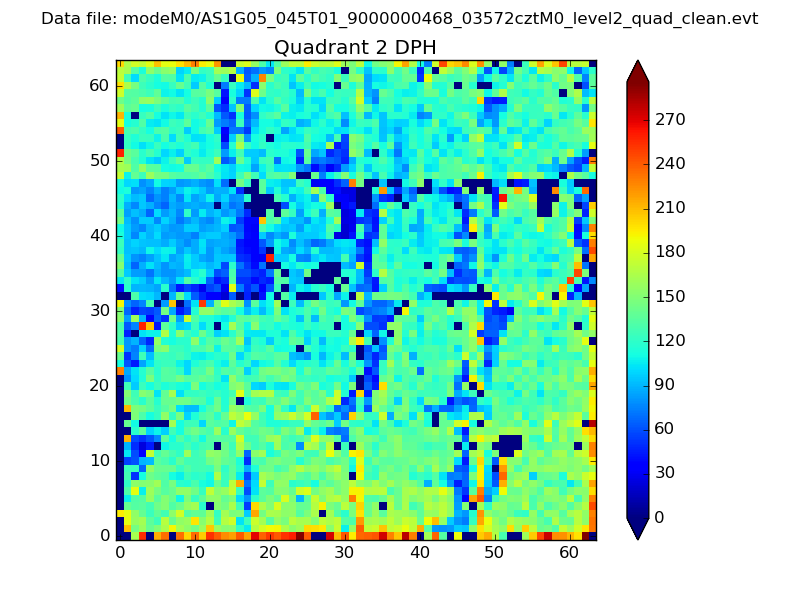
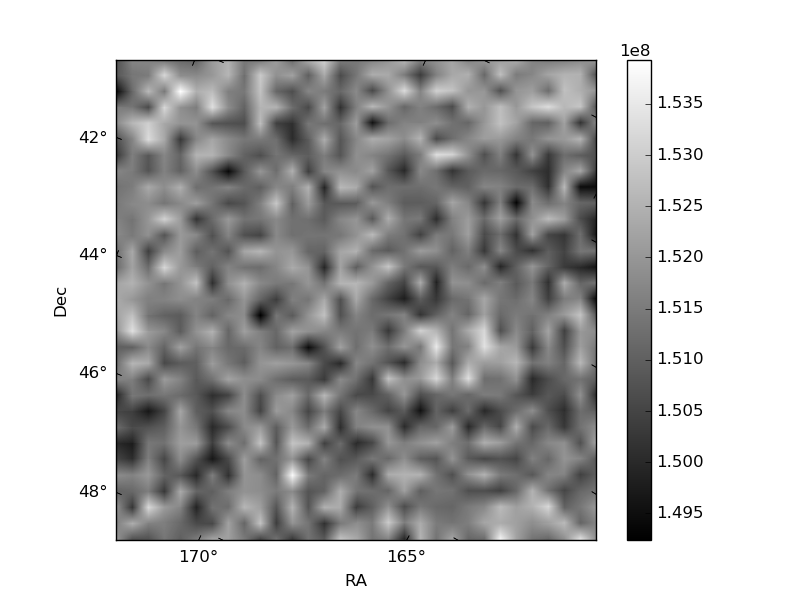
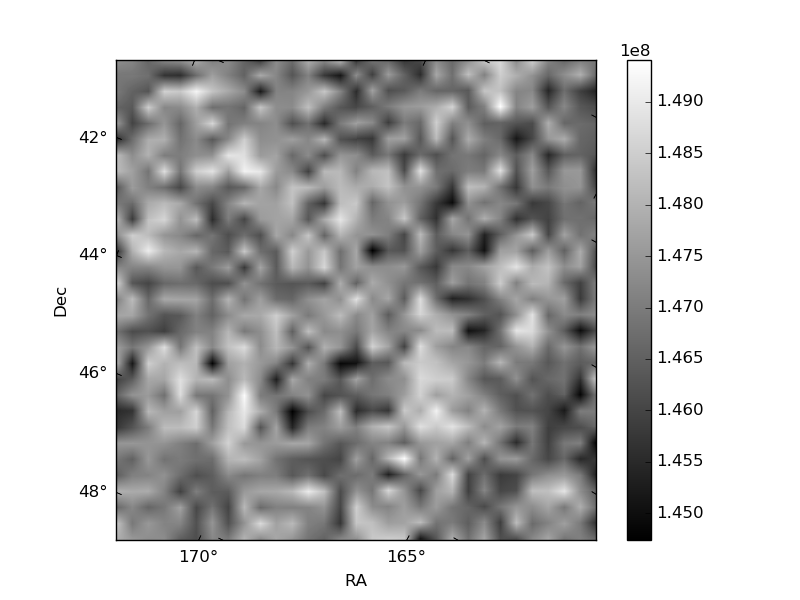
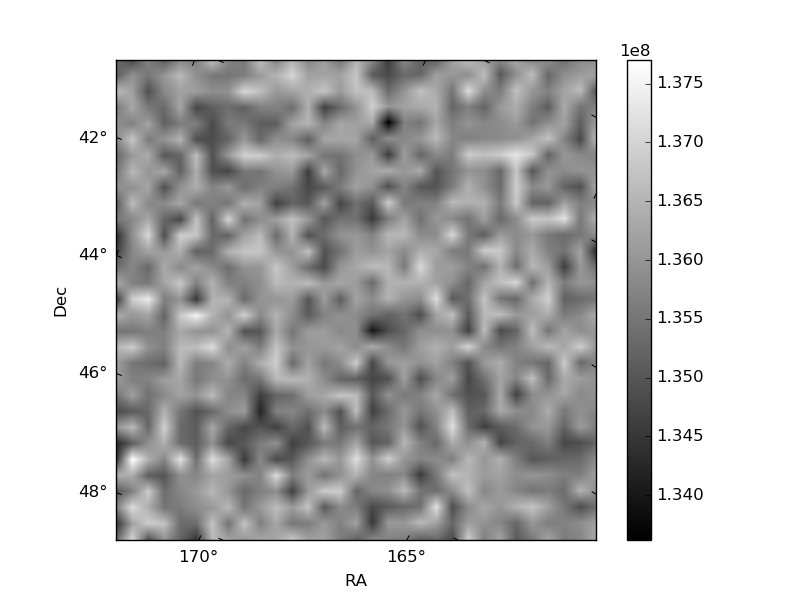
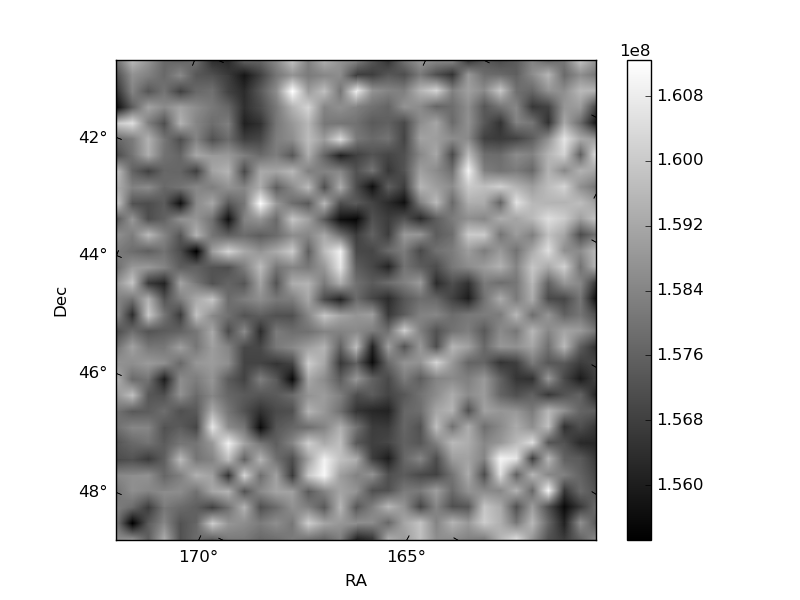
Histogram calculated using DETX and DETY for each event in the final _common_clean file
| Quadrant A | 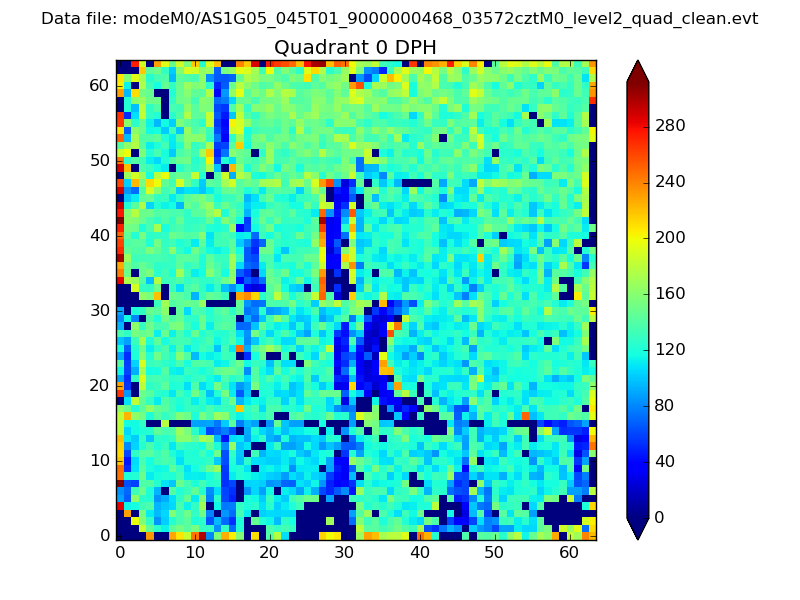 |
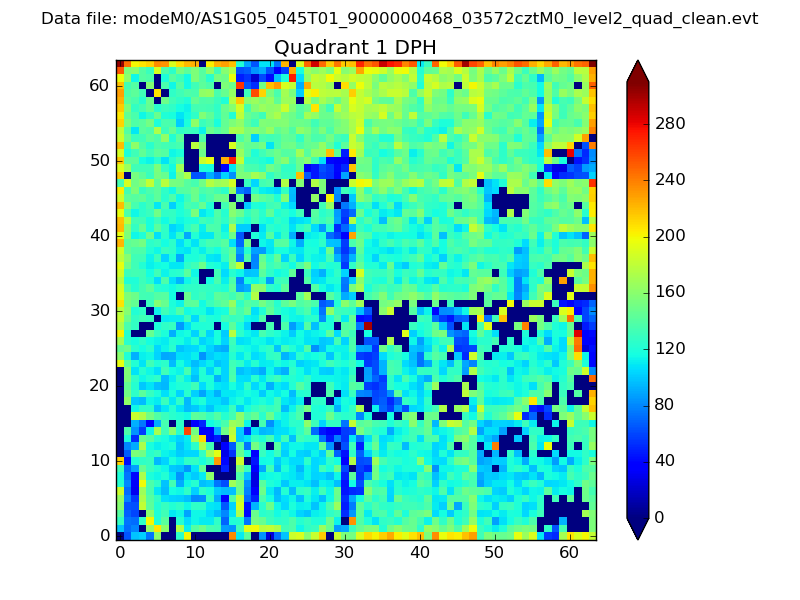 |
Quadrant B |
|---|---|---|---|
| Quadrant D | 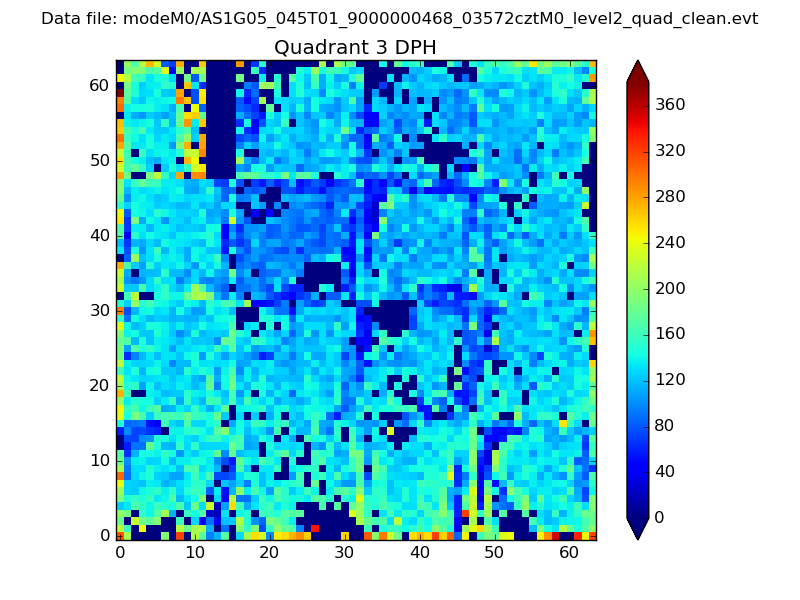 |
 |
Quadrant C |
| Plot type | Count rate plots | Images |
|---|---|---|
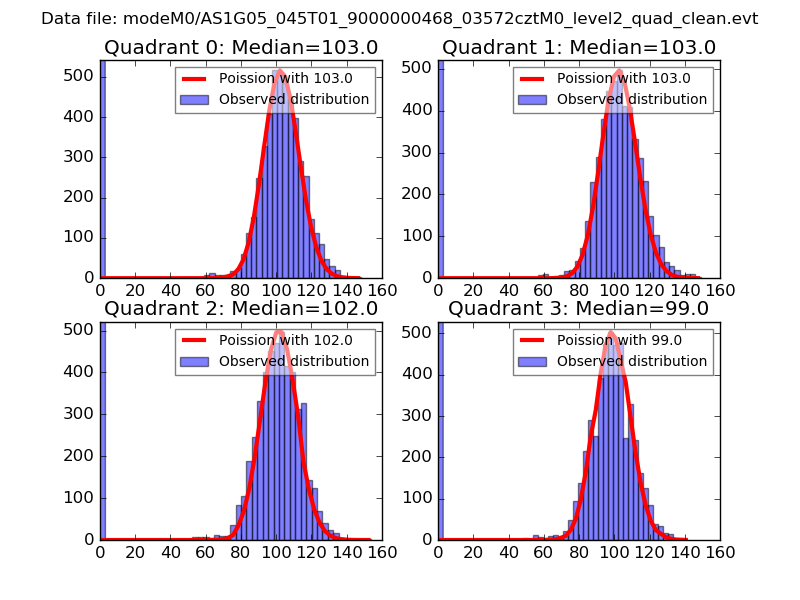
| Comparison with Poisson distribution Blue bars denote a histogram of data divided into 1 sec bins. Red curve is a Poisson curve with rate = median count rate of data. |
 |
 |
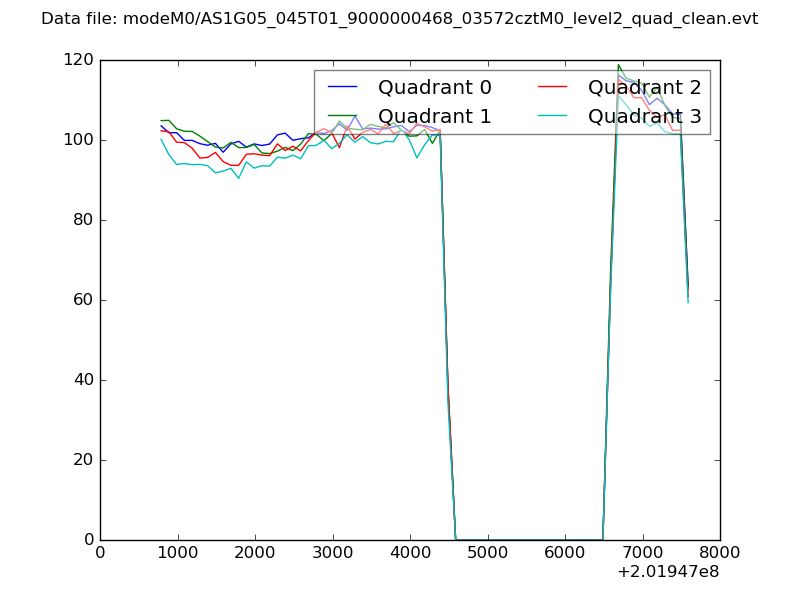
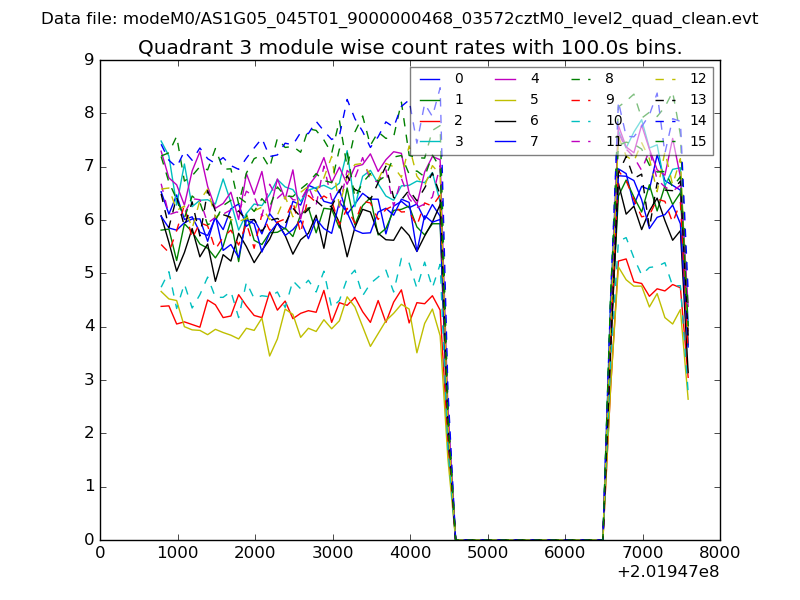
| Quadrant-wise count rates Data is divided into 100 sec bins |
 |
|
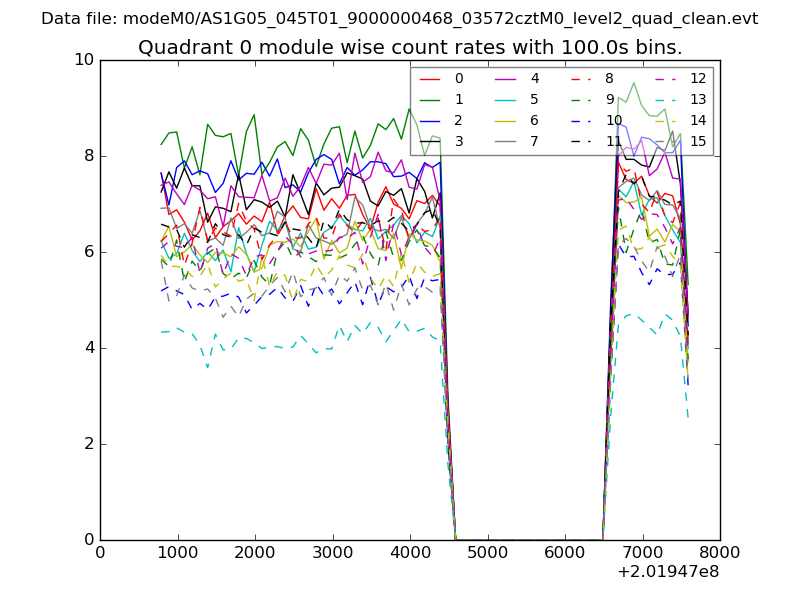
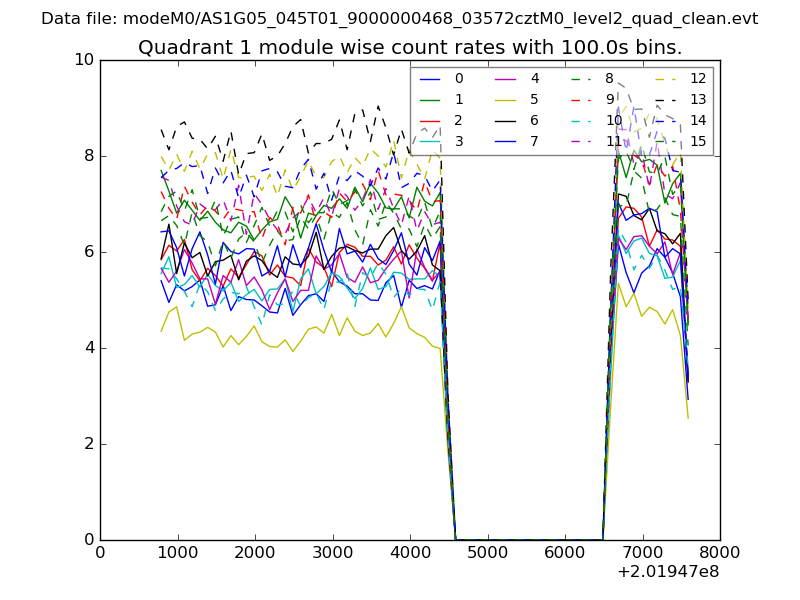
| Module-wise count rates for Quadrant A Data is divided into 100 sec bins |
 |
 |
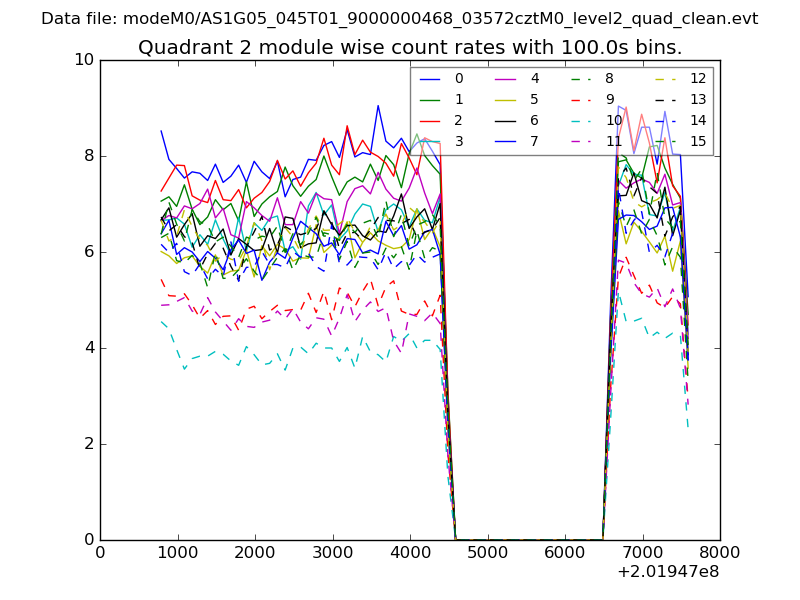
| Module-wise count rates for Quadrant B Data is divided into 100 sec bins |
 |
 |
| Module-wise count rates for Quadrant C Data is divided into 100 sec bins |
 |
 |
| Module-wise count rates for Quadrant D Data is divided into 100 sec bins |
 |
 |
| Parameter | Plot |
|---|---|
| CZT HV Monitor | 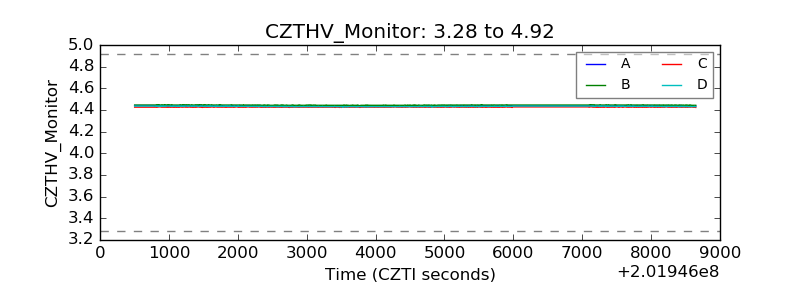 |
| D_VDD | 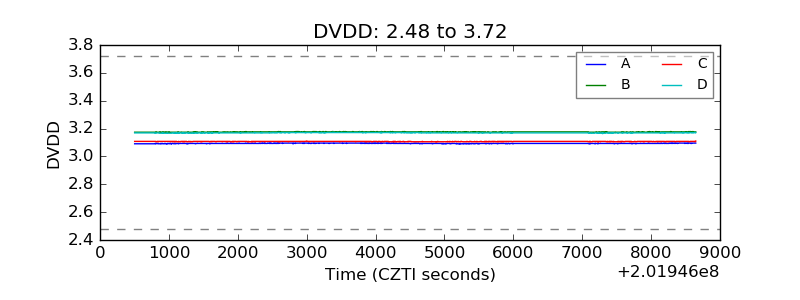 |
| Temperature 1 | 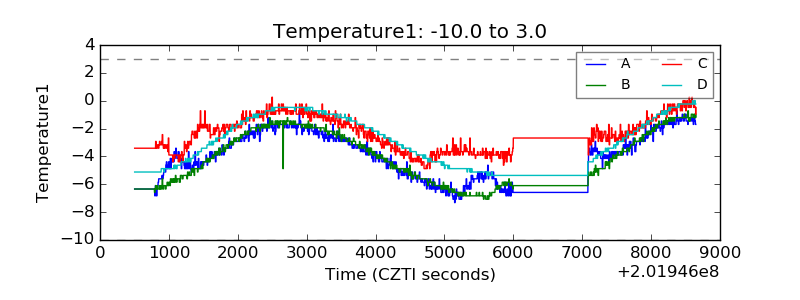 |
| Veto HV Monitor | 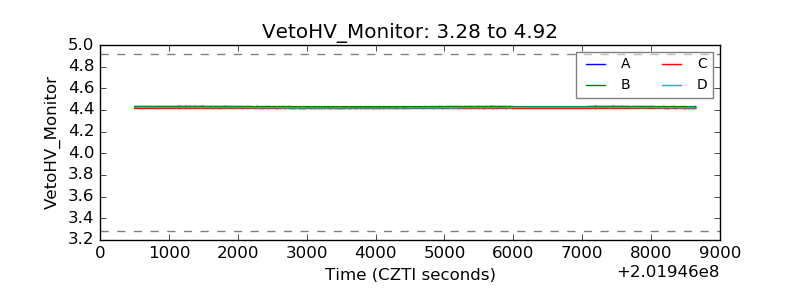 |
| Veto LLD | 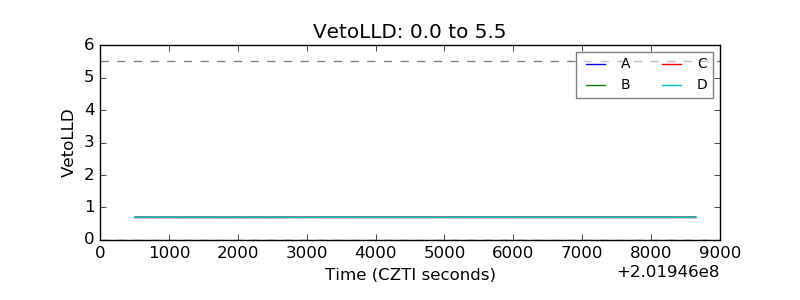 |
| Alpha Counter | 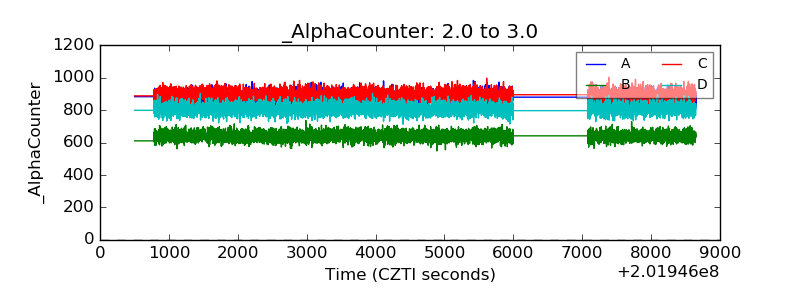 |
| _CPM_Rate | 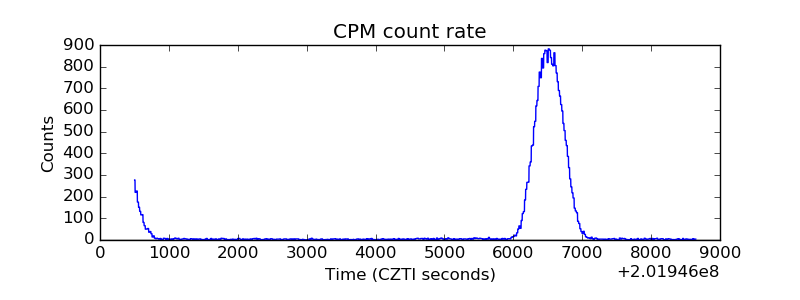 |
| CZT Counter | 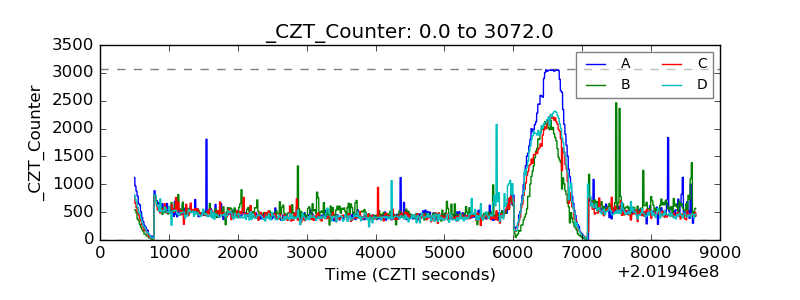 |
| +2.5 Volts monitor |  |
| +5 Volts monitor |  |
| _ROLL_ROT | 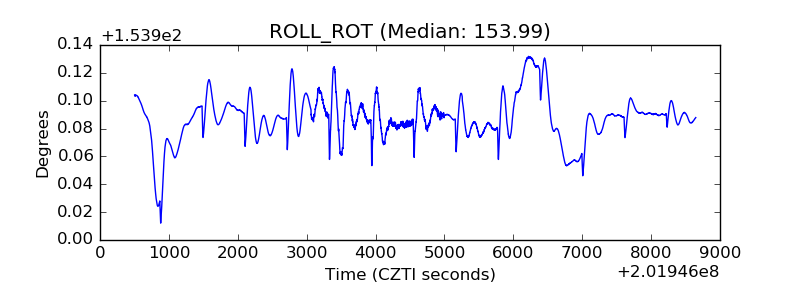 |
| _Roll_DEC | 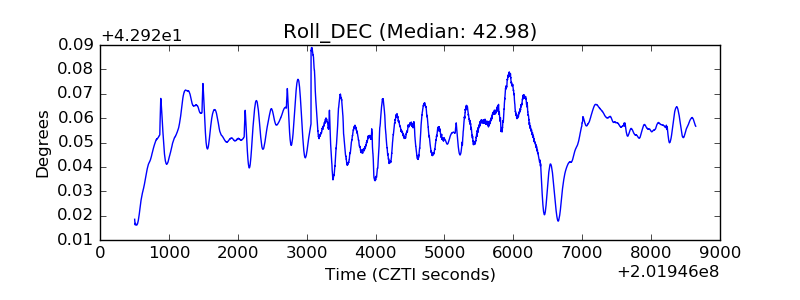 |
| _Roll_RA | 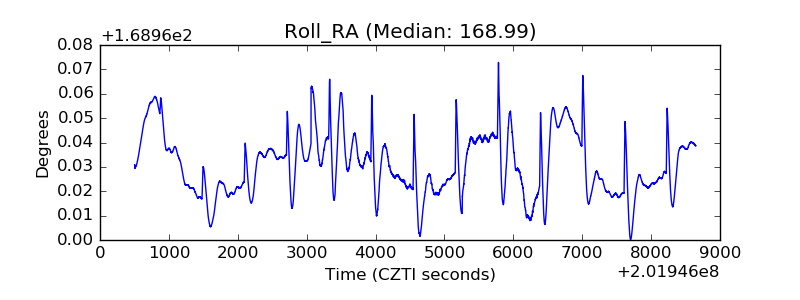 |
| Veto Counter | 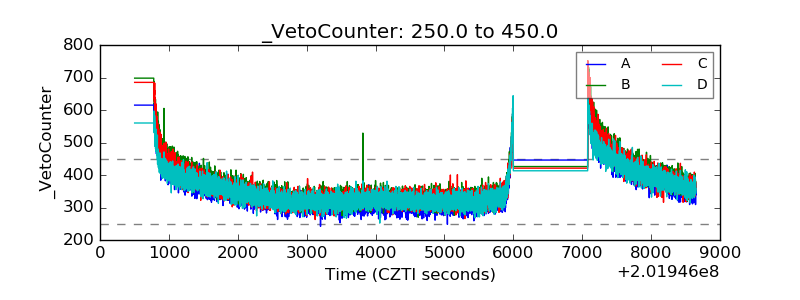 |