| Param | Original file | Final file |
|---|---|---|
| Filename | modeM0/AS1G05_045T01_9000000468_03573cztM0_level2.evt | modeM0/AS1G05_045T01_9000000468_03573cztM0_level2_quad_clean.evt |
| Size (bytes) | 483,456,960 | 90,190,080 |
| Size | 461.1 MB | 86.0 MB |
| Events in quadrant A | 3,383,479 | 578,880 |
| Events in quadrant B | 4,320,102 | 572,538 |
| Events in quadrant C | 3,143,564 | 565,246 |
| Events in quadrant D | 3,338,231 | 546,617 |
| Mode M0 | |||
|---|---|---|---|
| Quadrant | BADHDUFLAG | Total packets | Discarded packets |
| A | 0 | 14513 | 3 |
| B | 0 | 17505 | 2 |
| C | 0 | 13983 | 2 |
| D | 0 | 14574 | 2 |
| Mode M9 | |||
|---|---|---|---|
| Quadrant | BADHDUFLAG | Total packets | Discarded packets |
| A | 0 | 18 | 0 |
| B | 0 | 18 | 0 |
| C | 0 | 18 | 0 |
| D | 0 | 19 | 0 |
| Mode SS | |||
|---|---|---|---|
| Quadrant | BADHDUFLAG | Total packets | Discarded packets |
| A | 0 | 136 | 0 |
| B | 0 | 136 | 0 |
| C | 0 | 136 | 0 |
| D | 0 | 136 | 0 |
| Quadrant | Total seconds | Saturated seconds | Saturation percentage |
|---|---|---|---|
| A | 6715 | 134 | 1.995532% |
| B | 6715 | 161 | 2.397617% |
| C | 6715 | 91 | 1.355175% |
| D | 6715 | 141 | 2.099777% |
Noise dominated data is calculated using 1-second bins in cleaned event files. If a bin has >2000 counts, and if more than 50% of those come from <1% of pixels, then it is considered to be noise-dominated and hence unusable.
| Quadrant | # 1 sec bins | Bins with >0 counts | Bins with >2000 counts | High rate bins dominated by noise | Noise dominated (total time) | Noise dominated (detector-on time) | Marked lightcurve |
|---|---|---|---|---|---|---|---|
| A | 7859 | 6715 | 6 | 6 | 0.08% | 0.09% | 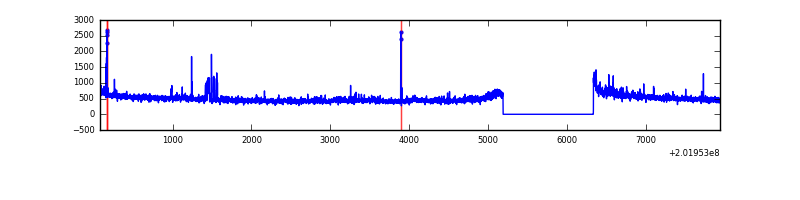 |
| B | 7859 | 6715 | 23 | 23 | 0.29% | 0.34% |  |
| C | 7859 | 6715 | 0 | 0 | 0.00% | 0.00% |  |
| D | 7859 | 6715 | 53 | 53 | 0.67% | 0.79% | 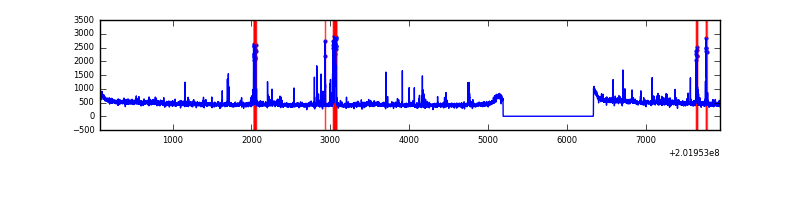 |
Top three noisy pixels from each quadrant. If the there are fewer than three noisy pixels in the level2.evt file, extra rows are filled as -1
| Pixel properties | Quadrant properties | ||||||
|---|---|---|---|---|---|---|---|
| Quadrant | DetID | PixID | Counts | Sigma | Mean | Median | Sigma |
| A | 0 | 118 | 92349 | 540.68 | 821 | 802 | 169.3 |
| A | 7 | 16 | 50511 | 293.58 | 821 | 802 | 169.3 |
| A | 15 | 174 | 26086 | 149.33 | 821 | 802 | 169.3 |
| B | 15 | 204 | 815787 | 5161.99 | 822 | 801 | 157.9 |
| B | 6 | 205 | 72577 | 454.62 | 822 | 801 | 157.9 |
| B | 4 | 81 | 63872 | 399.48 | 822 | 801 | 157.9 |
| C | 1 | 16 | 43983 | 234.13 | 791 | 793 | 184.5 |
| C | 13 | 61 | 6816 | 32.65 | 791 | 793 | 184.5 |
| C | 7 | 189 | 6213 | 29.38 | 791 | 793 | 184.5 |
| D | 1 | 193 | 148962 | 777.22 | 792 | 769 | 190.7 |
| D | 13 | 223 | 52532 | 271.48 | 792 | 769 | 190.7 |
| D | 7 | 39 | 22018 | 111.44 | 792 | 769 | 190.7 |
Histogram calculated using DETX and DETY for each event in the final _common_clean file
| Quadrant A | 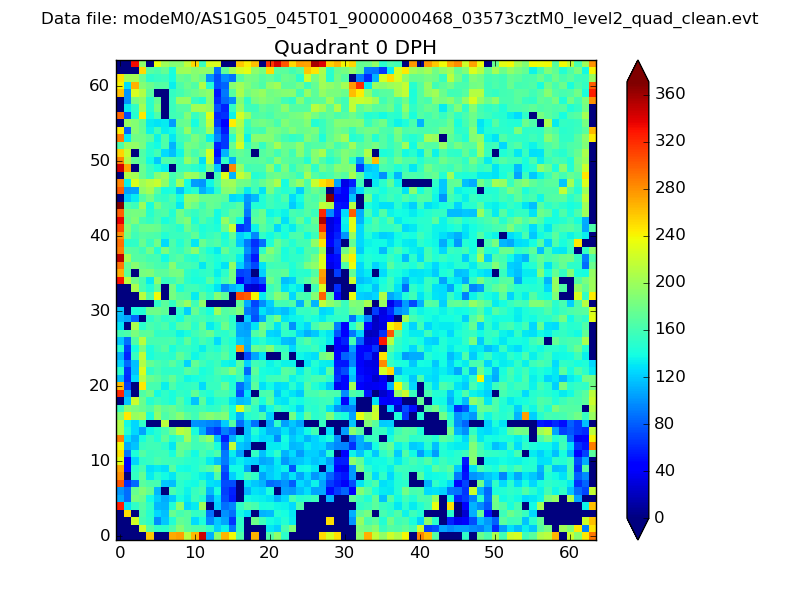 |
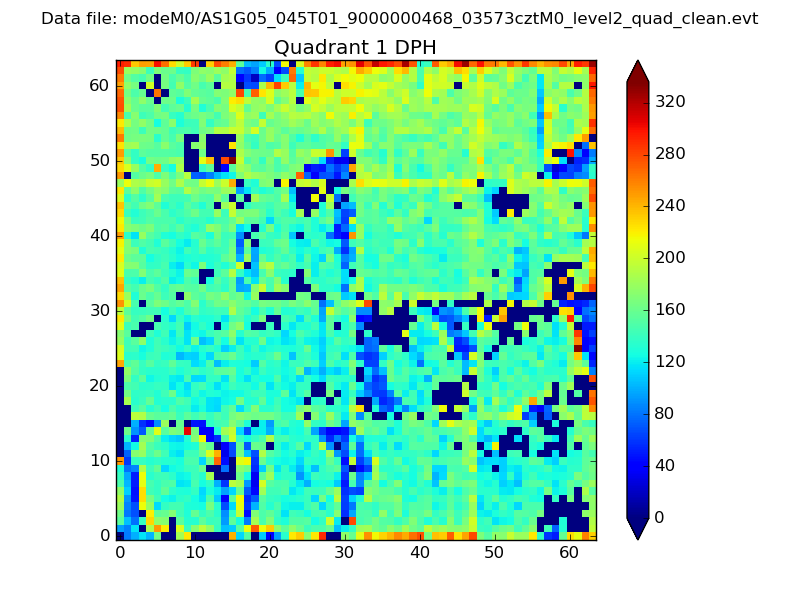 |
Quadrant B |
|---|---|---|---|
| Quadrant D |  |
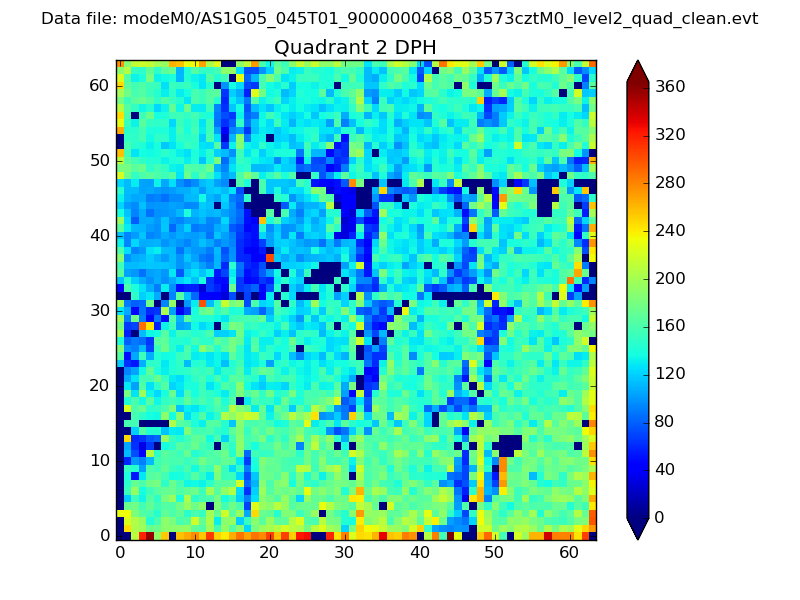 |
Quadrant C |
| Plot type | Count rate plots | Images |
|---|---|---|
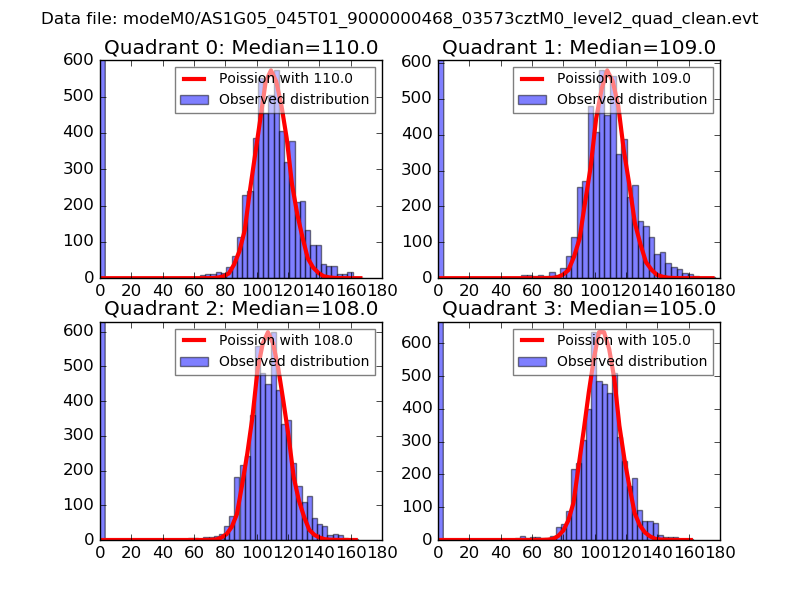
| Comparison with Poisson distribution Blue bars denote a histogram of data divided into 1 sec bins. Red curve is a Poisson curve with rate = median count rate of data. |
 |
 |
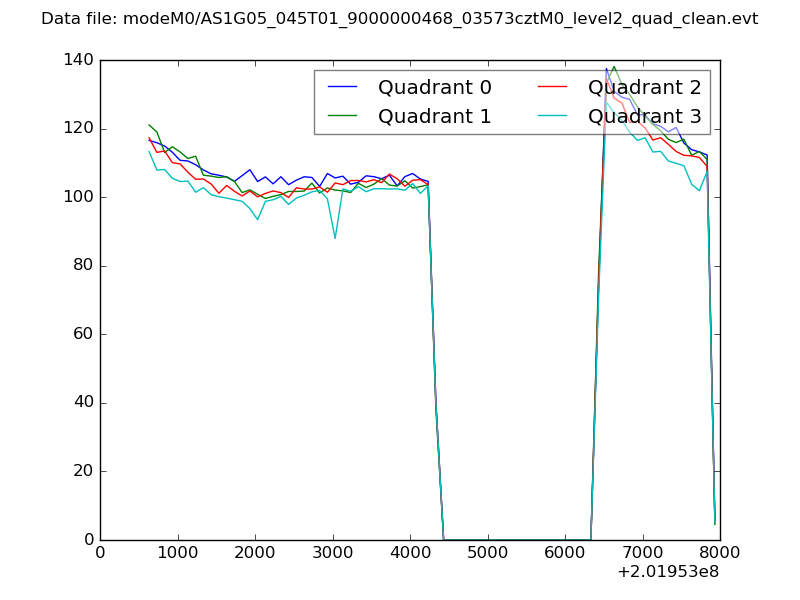
| Quadrant-wise count rates Data is divided into 100 sec bins |
 |
|
| Module-wise count rates for Quadrant A Data is divided into 100 sec bins |
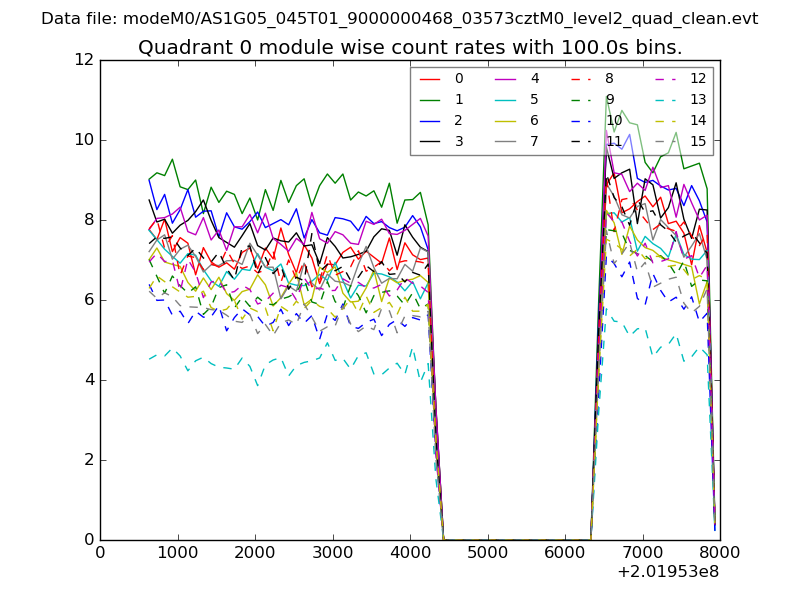 |
 |
| Module-wise count rates for Quadrant B Data is divided into 100 sec bins |
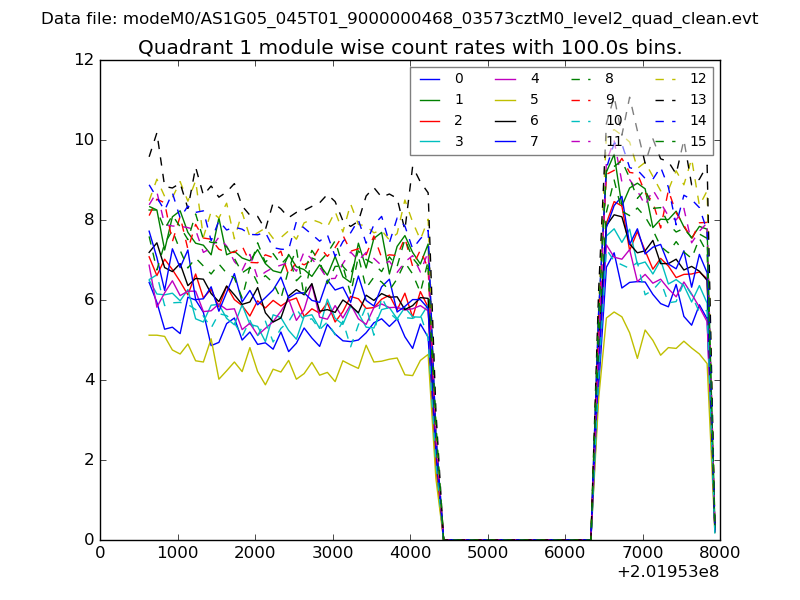 |
 |
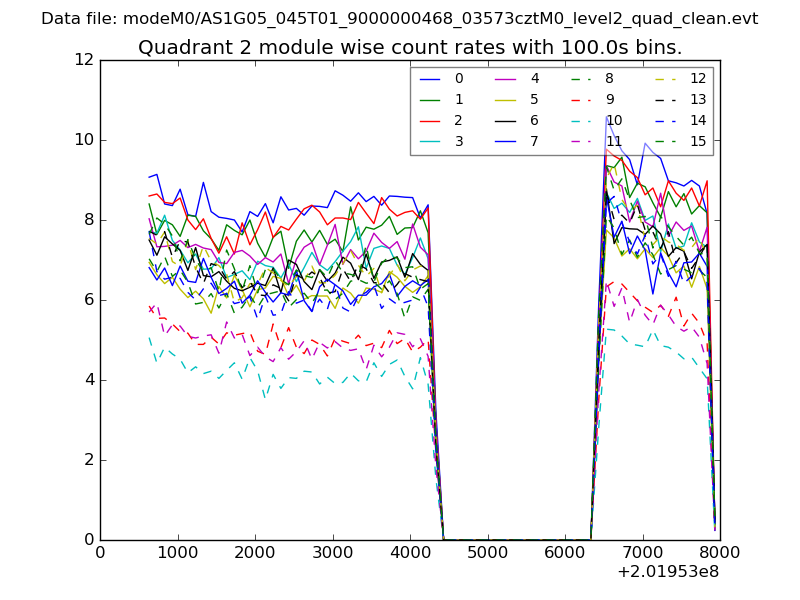
| Module-wise count rates for Quadrant C Data is divided into 100 sec bins |
 |
 |
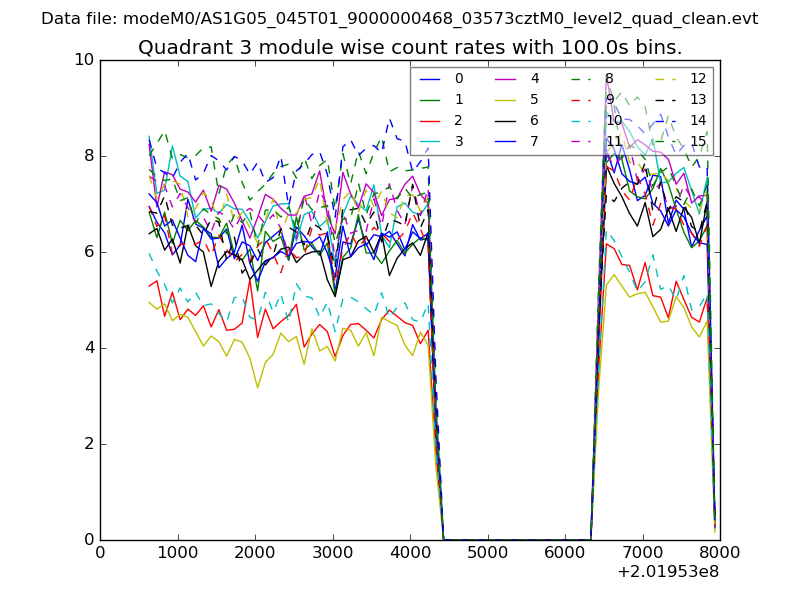
| Module-wise count rates for Quadrant D Data is divided into 100 sec bins |
 |
 |
| Parameter | Plot |
|---|---|
| CZT HV Monitor | 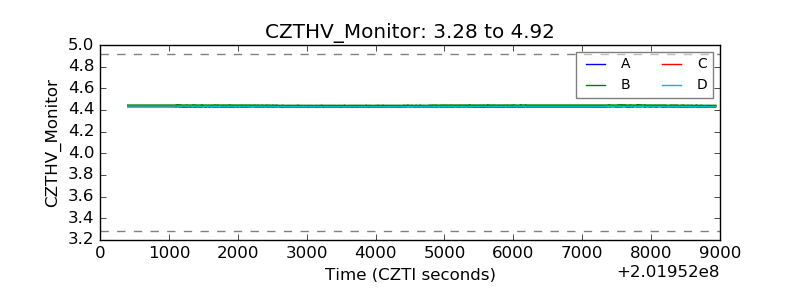 |
| D_VDD | 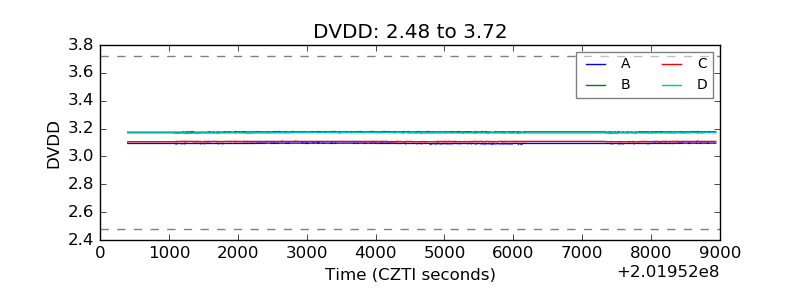 |
| Temperature 1 | 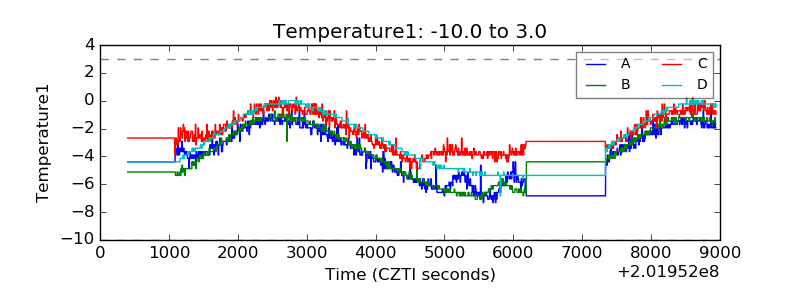 |
| Veto HV Monitor | 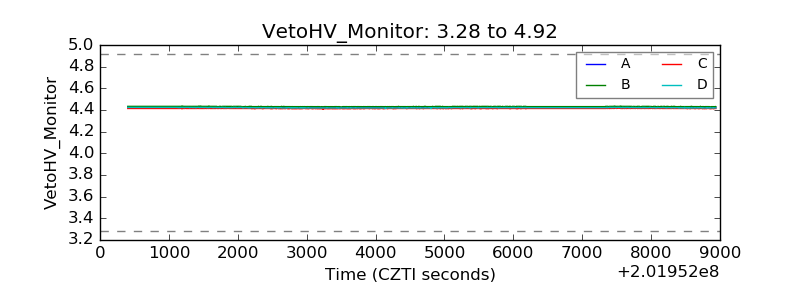 |
| Veto LLD | 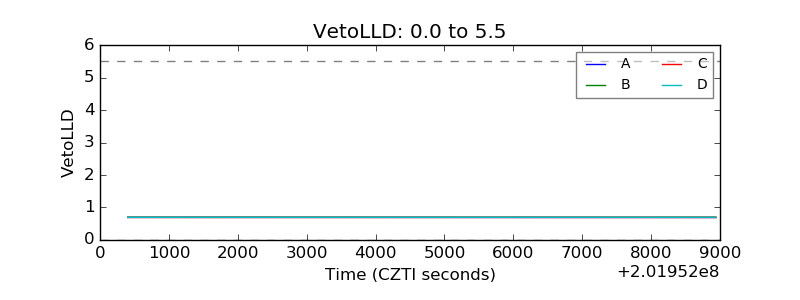 |
| Alpha Counter | 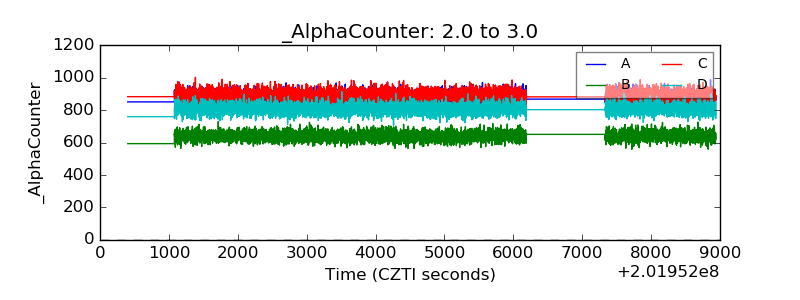 |
| _CPM_Rate | 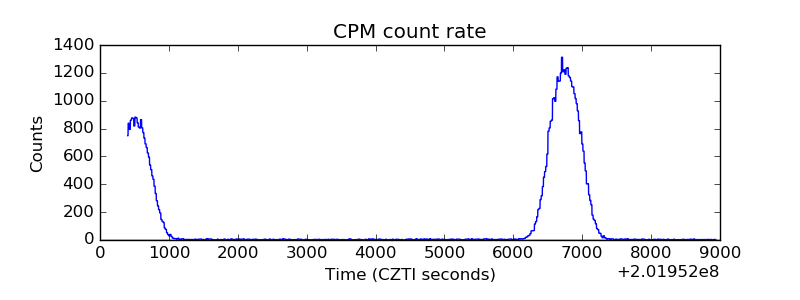 |
| CZT Counter | 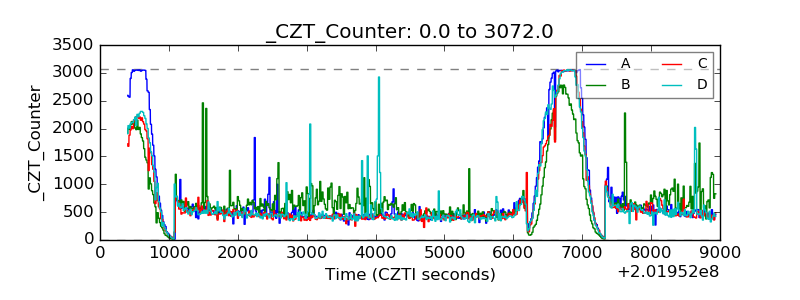 |
| +2.5 Volts monitor |  |
| +5 Volts monitor |  |
| _ROLL_ROT | 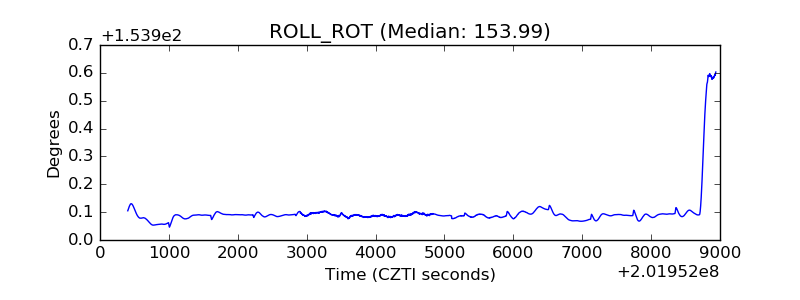 |
| _Roll_DEC | 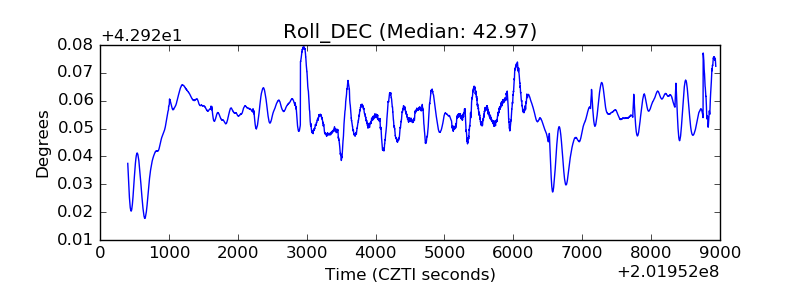 |
| _Roll_RA | 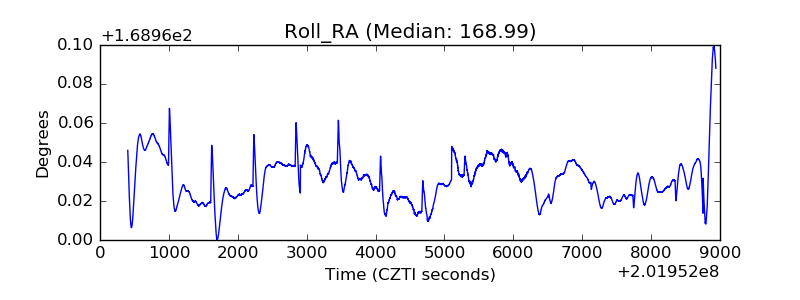 |
| Veto Counter | 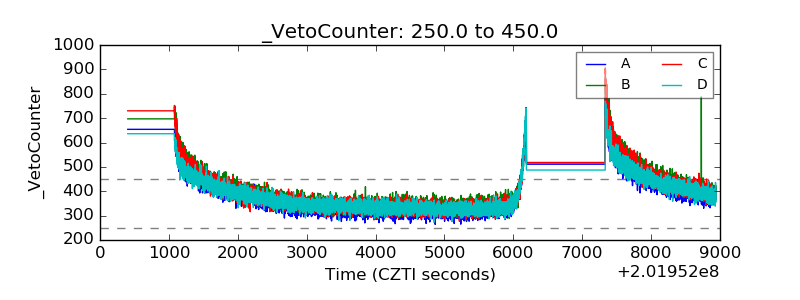 |