| Param | Original file | Final file |
|---|---|---|
| Filename | modeM0/AS1G05_045T01_9000000468_03574cztM0_level2.evt | modeM0/AS1G05_045T01_9000000468_03574cztM0_level2_quad_clean.evt |
| Size (bytes) | 427,792,320 | 86,423,040 |
| Size | 408.0 MB | 82.4 MB |
| Events in quadrant A | 2,936,485 | 561,430 |
| Events in quadrant B | 3,838,263 | 555,947 |
| Events in quadrant C | 2,763,277 | 550,487 |
| Events in quadrant D | 3,013,826 | 534,182 |
| Mode M0 | |||
|---|---|---|---|
| Quadrant | BADHDUFLAG | Total packets | Discarded packets |
| A | 0 | 12619 | 2 |
| B | 0 | 15522 | 1 |
| C | 0 | 12292 | 1 |
| D | 0 | 13032 | 1 |
| Mode M9 | |||
|---|---|---|---|
| Quadrant | BADHDUFLAG | Total packets | Discarded packets |
| A | 0 | 13 | 0 |
| B | 0 | 13 | 0 |
| C | 0 | 13 | 0 |
| D | 0 | 13 | 0 |
| Mode SS | |||
|---|---|---|---|
| Quadrant | BADHDUFLAG | Total packets | Discarded packets |
| A | 0 | 120 | 0 |
| B | 0 | 120 | 0 |
| C | 0 | 120 | 0 |
| D | 0 | 120 | 0 |
| Quadrant | Total seconds | Saturated seconds | Saturation percentage |
|---|---|---|---|
| A | 5944 | 65 | 1.093540% |
| B | 5944 | 76 | 1.278600% |
| C | 5944 | 37 | 0.622476% |
| D | 5944 | 87 | 1.463661% |
Noise dominated data is calculated using 1-second bins in cleaned event files. If a bin has >2000 counts, and if more than 50% of those come from <1% of pixels, then it is considered to be noise-dominated and hence unusable.
| Quadrant | # 1 sec bins | Bins with >0 counts | Bins with >2000 counts | High rate bins dominated by noise | Noise dominated (total time) | Noise dominated (detector-on time) | Marked lightcurve |
|---|---|---|---|---|---|---|---|
| A | 7224 | 5945 | 5 | 5 | 0.07% | 0.08% |  |
| B | 7224 | 5945 | 4 | 4 | 0.06% | 0.07% |  |
| C | 7224 | 5945 | 1 | 1 | 0.01% | 0.02% | 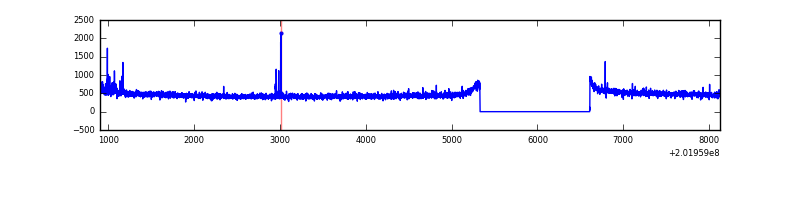 |
| D | 7224 | 5945 | 43 | 43 | 0.60% | 0.72% | 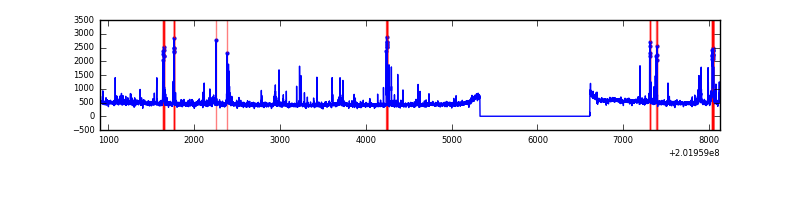 |
Top three noisy pixels from each quadrant. If the there are fewer than three noisy pixels in the level2.evt file, extra rows are filled as -1
| Pixel properties | Quadrant properties | ||||||
|---|---|---|---|---|---|---|---|
| Quadrant | DetID | PixID | Counts | Sigma | Mean | Median | Sigma |
| A | 0 | 50 | 80543 | 552.68 | 716 | 703 | 144.5 |
| A | 0 | 118 | 51295 | 350.22 | 716 | 703 | 144.5 |
| A | 3 | 1 | 18432 | 122.73 | 716 | 703 | 144.5 |
| B | 15 | 204 | 892549 | 6545.2 | 718 | 701 | 136.3 |
| B | 0 | 229 | 34632 | 249.02 | 718 | 701 | 136.3 |
| B | 14 | 167 | 31491 | 225.97 | 718 | 701 | 136.3 |
| C | 1 | 16 | 32701 | 198.17 | 694 | 697 | 161.5 |
| C | 14 | 48 | 12353 | 72.17 | 694 | 697 | 161.5 |
| C | 13 | 61 | 5995 | 32.81 | 694 | 697 | 161.5 |
| D | 13 | 223 | 109458 | 651.69 | 696 | 677 | 166.9 |
| D | 1 | 193 | 94589 | 562.61 | 696 | 677 | 166.9 |
| D | 5 | 233 | 43106 | 254.19 | 696 | 677 | 166.9 |
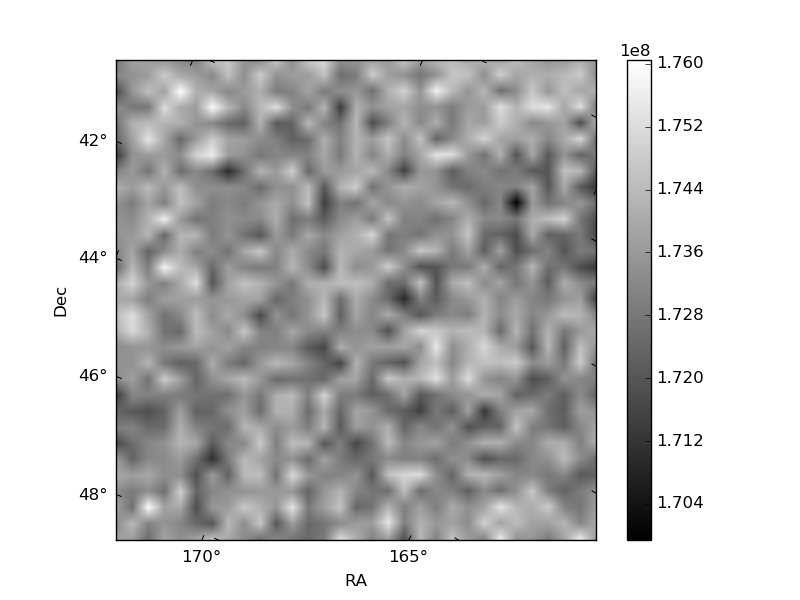
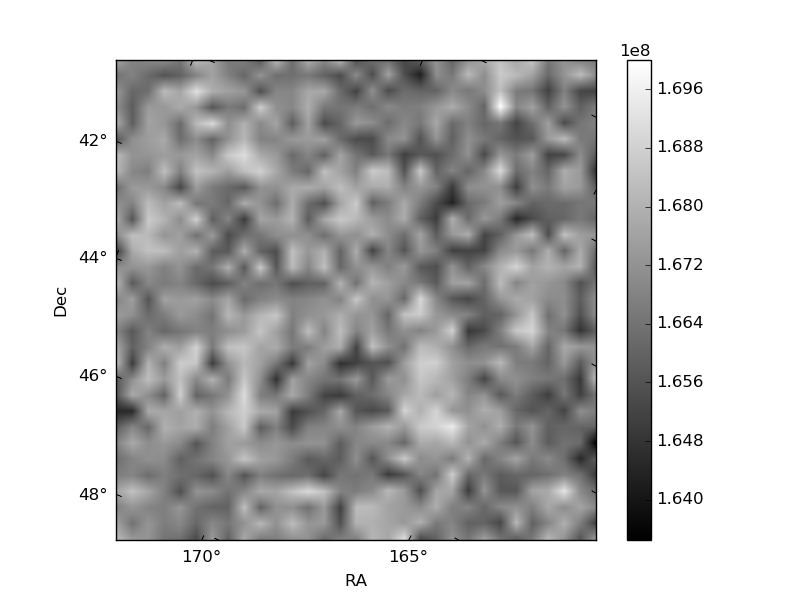
Histogram calculated using DETX and DETY for each event in the final _common_clean file
| Quadrant A |  |
 |
Quadrant B |
|---|---|---|---|
| Quadrant D | 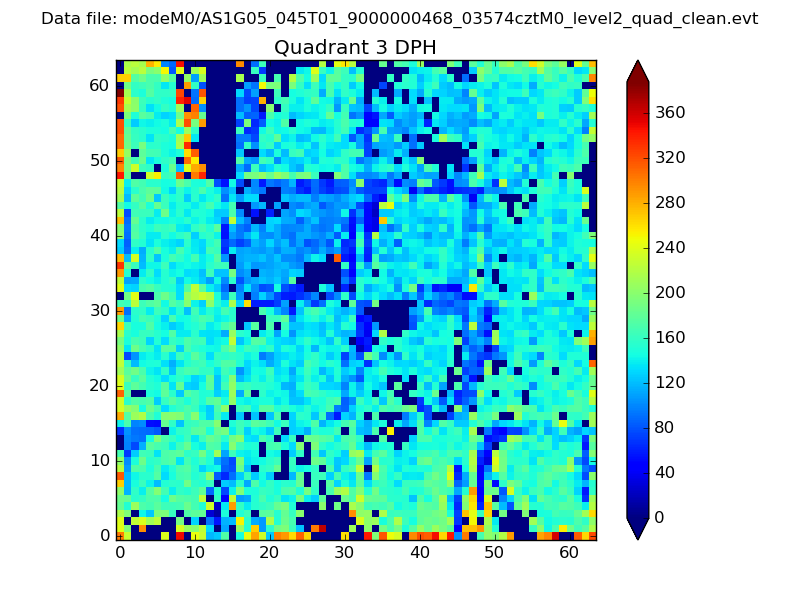 |
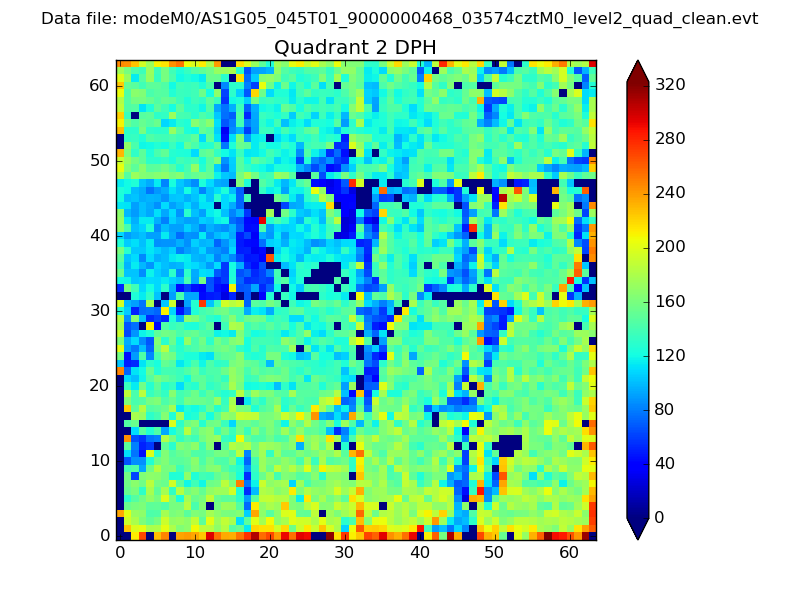 |
Quadrant C |
| Plot type | Count rate plots | Images |
|---|---|---|
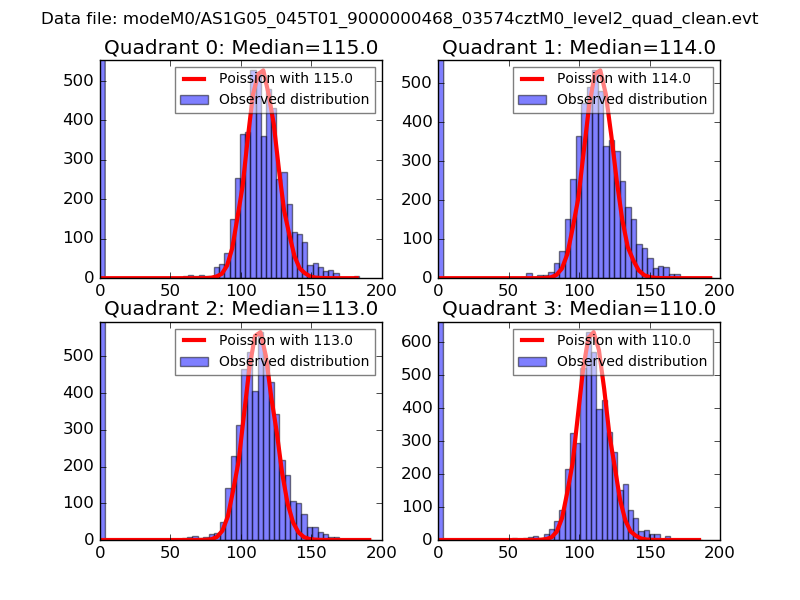
| Comparison with Poisson distribution Blue bars denote a histogram of data divided into 1 sec bins. Red curve is a Poisson curve with rate = median count rate of data. |
 |
 |
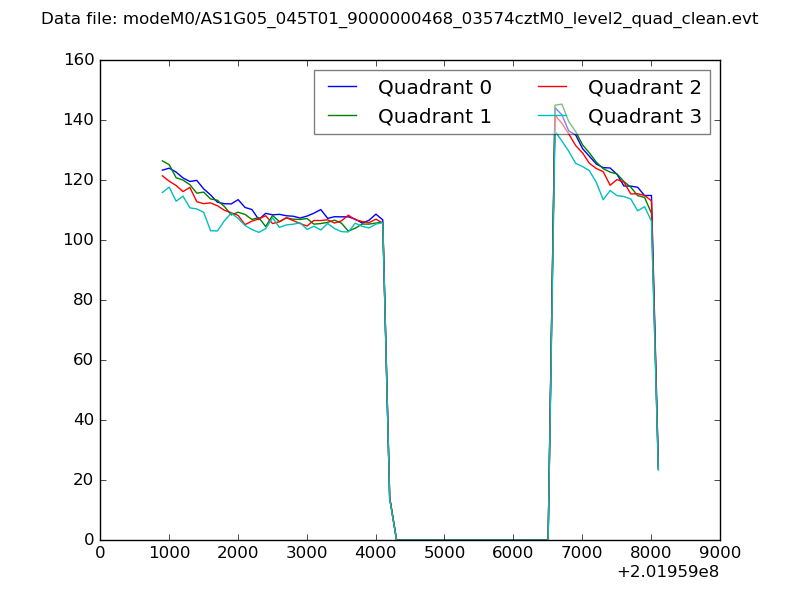
| Quadrant-wise count rates Data is divided into 100 sec bins |
 |
|
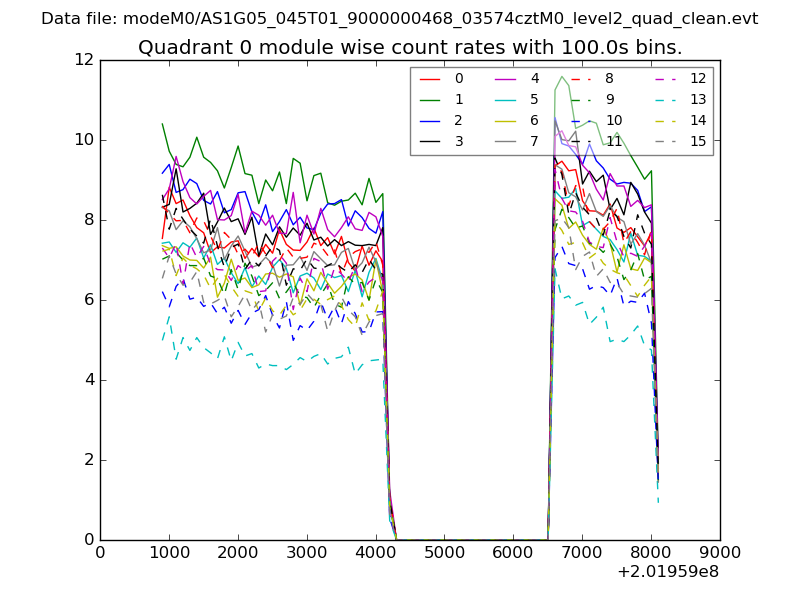
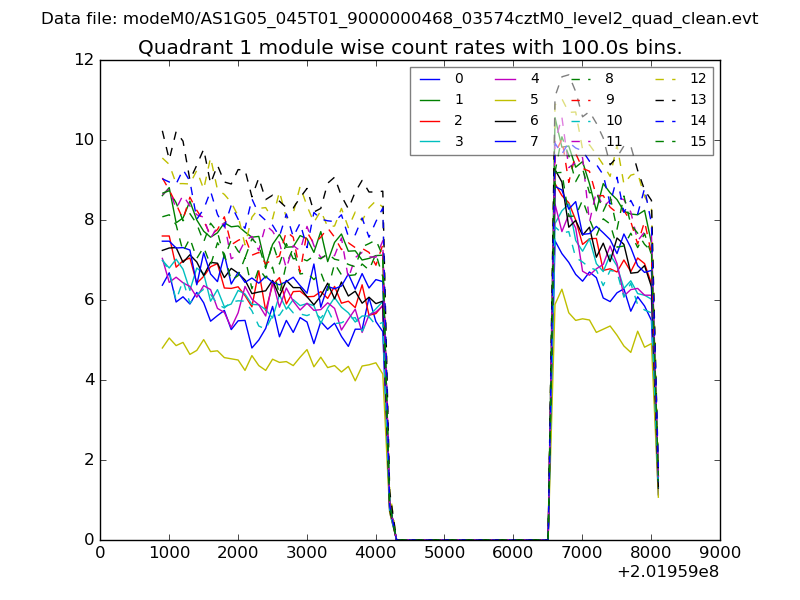
| Module-wise count rates for Quadrant A Data is divided into 100 sec bins |
 |
 |
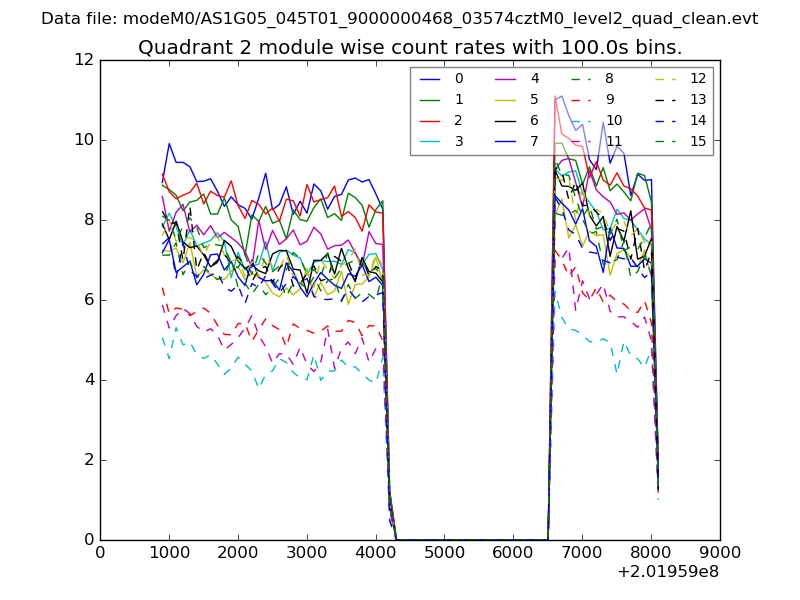
| Module-wise count rates for Quadrant B Data is divided into 100 sec bins |
 |
 |
| Module-wise count rates for Quadrant C Data is divided into 100 sec bins |
 |
 |
| Module-wise count rates for Quadrant D Data is divided into 100 sec bins |
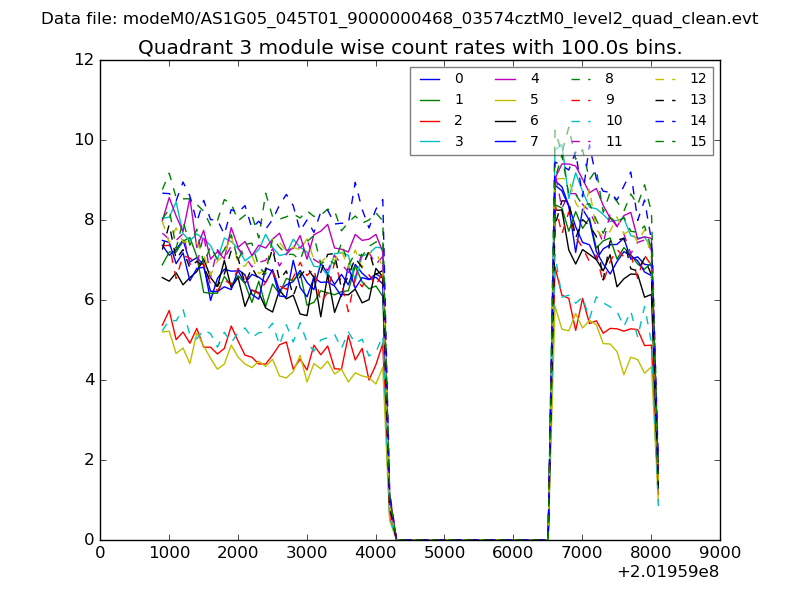 |
 |
| Parameter | Plot |
|---|---|
| CZT HV Monitor | 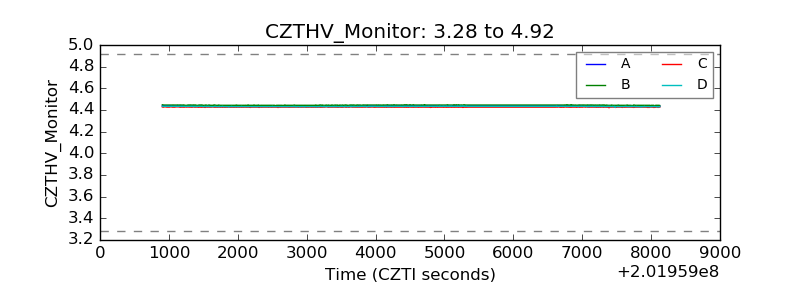 |
| D_VDD | 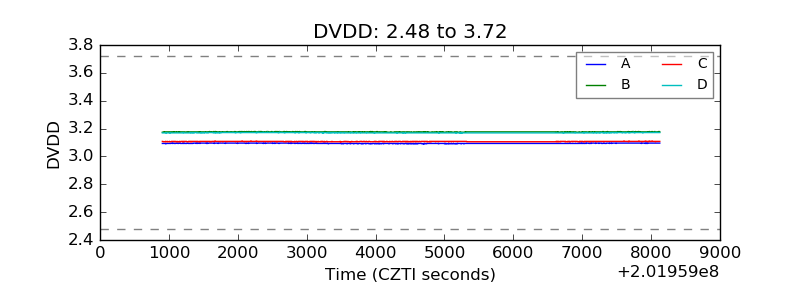 |
| Temperature 1 | 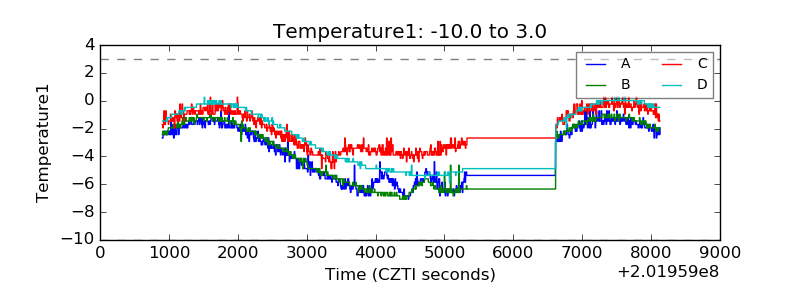 |
| Veto HV Monitor | 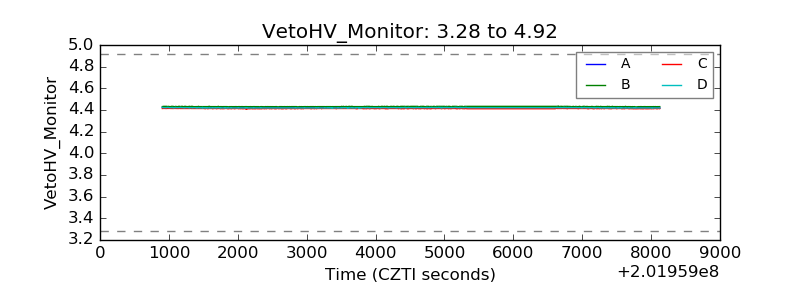 |
| Veto LLD | 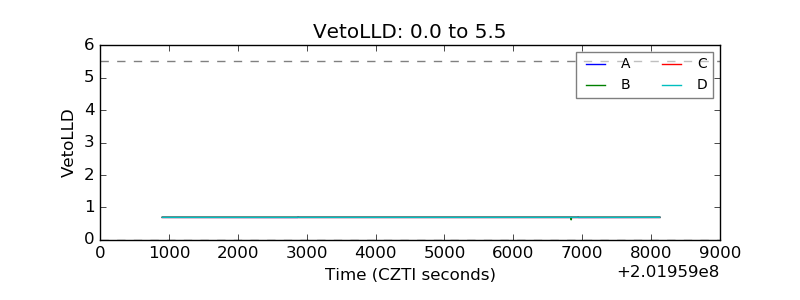 |
| Alpha Counter | 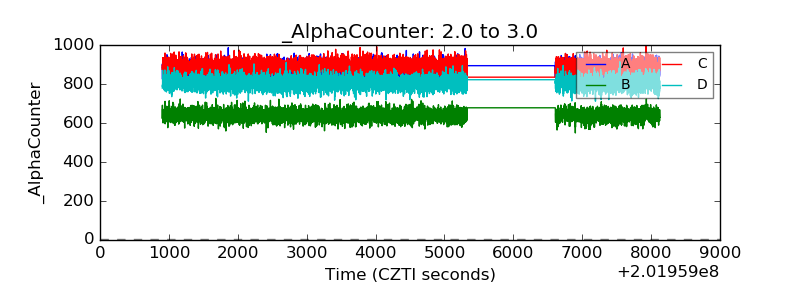 |
| _CPM_Rate | 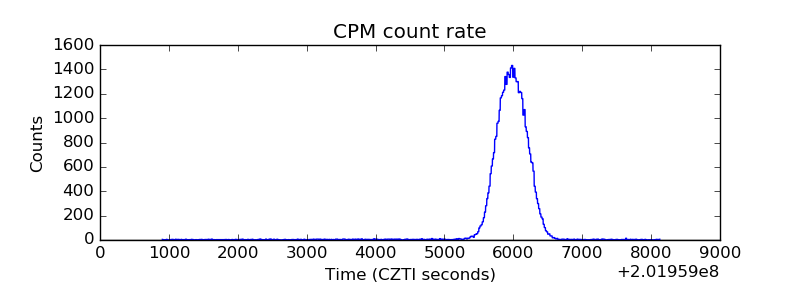 |
| CZT Counter | 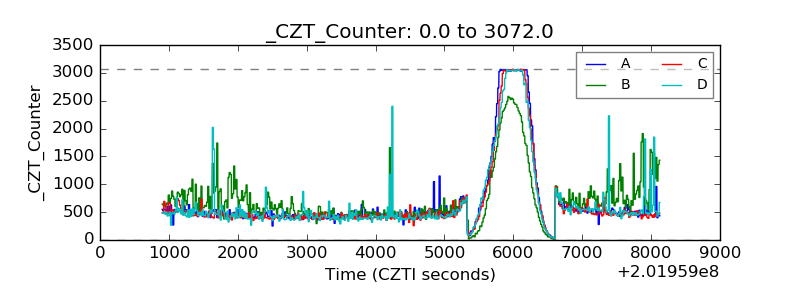 |
| +2.5 Volts monitor | 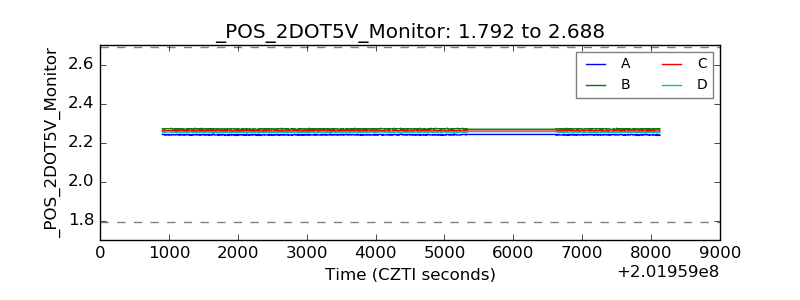 |
| +5 Volts monitor |  |
| _ROLL_ROT | 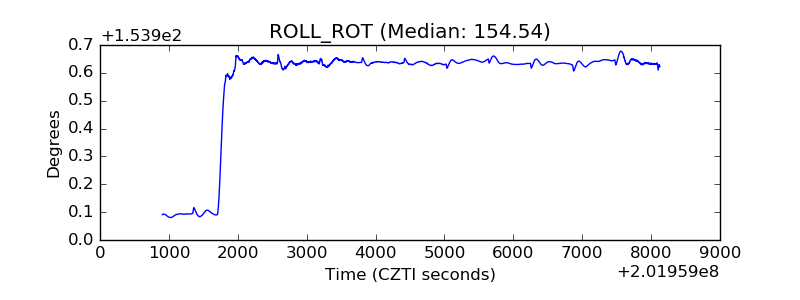 |
| _Roll_DEC | 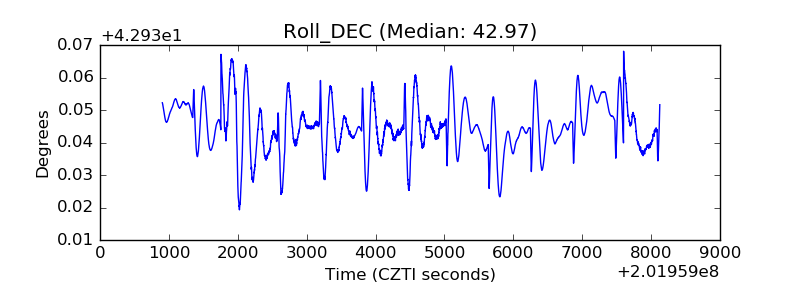 |
| _Roll_RA | 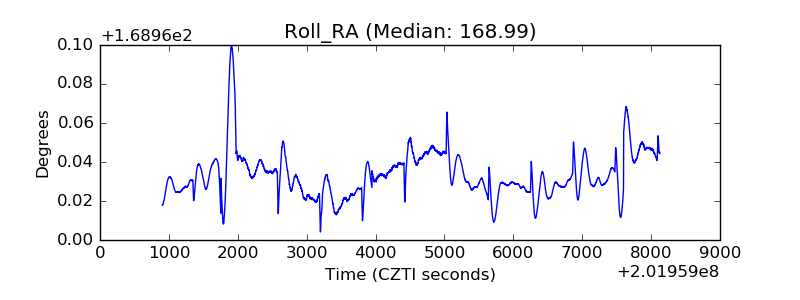 |
| Veto Counter | 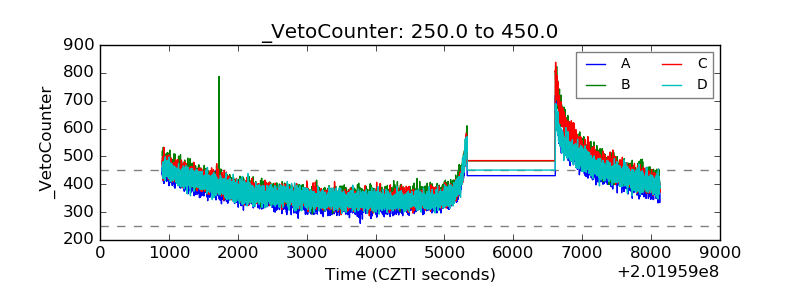 |