| Param | Original file | Final file |
|---|---|---|
| Filename | modeM0/AS1G05_045T01_9000000468_03575cztM0_level2.evt | modeM0/AS1G05_045T01_9000000468_03575cztM0_level2_quad_clean.evt |
| Size (bytes) | 462,522,240 | 81,682,560 |
| Size | 441.1 MB | 77.9 MB |
| Events in quadrant A | 3,064,719 | 522,479 |
| Events in quadrant B | 4,217,471 | 518,417 |
| Events in quadrant C | 3,134,660 | 515,632 |
| Events in quadrant D | 3,184,039 | 498,589 |
| Mode M0 | |||
|---|---|---|---|
| Quadrant | BADHDUFLAG | Total packets | Discarded packets |
| A | 0 | 13053 | 2 |
| B | 0 | 16719 | 1 |
| C | 0 | 13325 | 1 |
| D | 0 | 13507 | 1 |
| Mode M9 | |||
|---|---|---|---|
| Quadrant | BADHDUFLAG | Total packets | Discarded packets |
| A | 0 | 13 | 0 |
| B | 0 | 13 | 0 |
| C | 0 | 13 | 0 |
| D | 0 | 13 | 0 |
| Mode SS | |||
|---|---|---|---|
| Quadrant | BADHDUFLAG | Total packets | Discarded packets |
| A | 0 | 122 | 0 |
| B | 0 | 122 | 0 |
| C | 0 | 122 | 0 |
| D | 0 | 122 | 0 |
| Quadrant | Total seconds | Saturated seconds | Saturation percentage |
|---|---|---|---|
| A | 5989 | 106 | 1.769912% |
| B | 5989 | 190 | 3.172483% |
| C | 5989 | 50 | 0.834864% |
| D | 5989 | 90 | 1.502755% |
Noise dominated data is calculated using 1-second bins in cleaned event files. If a bin has >2000 counts, and if more than 50% of those come from <1% of pixels, then it is considered to be noise-dominated and hence unusable.
| Quadrant | # 1 sec bins | Bins with >0 counts | Bins with >2000 counts | High rate bins dominated by noise | Noise dominated (total time) | Noise dominated (detector-on time) | Marked lightcurve |
|---|---|---|---|---|---|---|---|
| A | 7289 | 5990 | 29 | 29 | 0.40% | 0.48% | 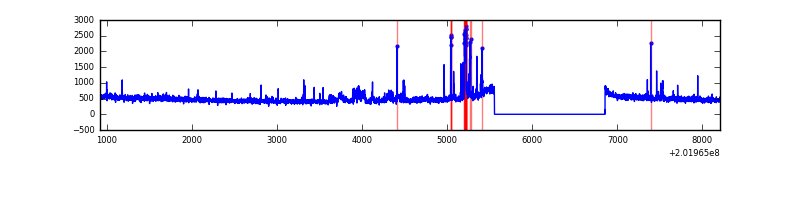 |
| B | 7289 | 5990 | 97 | 97 | 1.33% | 1.62% | 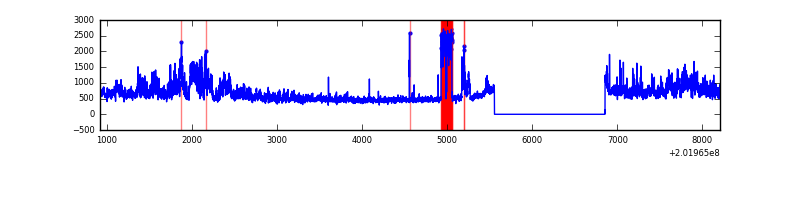 |
| C | 7289 | 5990 | 0 | 0 | 0.00% | 0.00% | 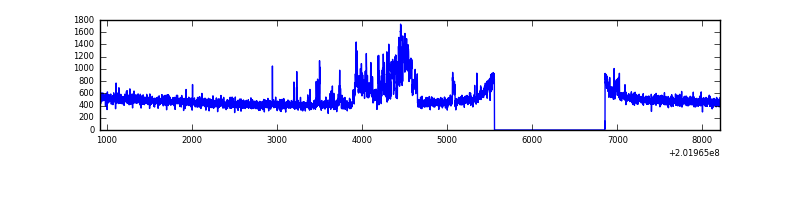 |
| D | 7289 | 5990 | 51 | 51 | 0.70% | 0.85% | 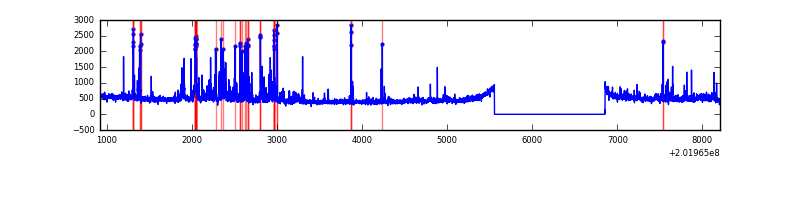 |
Top three noisy pixels from each quadrant. If the there are fewer than three noisy pixels in the level2.evt file, extra rows are filled as -1
| Pixel properties | Quadrant properties | ||||||
|---|---|---|---|---|---|---|---|
| Quadrant | DetID | PixID | Counts | Sigma | Mean | Median | Sigma |
| A | 0 | 50 | 122356 | 834.01 | 721 | 707 | 145.9 |
| A | 0 | 118 | 101537 | 691.28 | 721 | 707 | 145.9 |
| A | 7 | 16 | 28321 | 189.32 | 721 | 707 | 145.9 |
| B | 15 | 204 | 913040 | 6722.4 | 720 | 704 | 135.7 |
| B | 4 | 81 | 318639 | 2342.65 | 720 | 704 | 135.7 |
| B | 0 | 182 | 56144 | 408.5 | 720 | 704 | 135.7 |
| C | 2 | 53 | 367440 | 2246.28 | 704 | 709 | 163.3 |
| C | 1 | 16 | 8567 | 48.13 | 704 | 709 | 163.3 |
| C | 13 | 61 | 6132 | 33.22 | 704 | 709 | 163.3 |
| D | 1 | 193 | 166090 | 975.21 | 704 | 683 | 169.6 |
| D | 13 | 70 | 90713 | 530.8 | 704 | 683 | 169.6 |
| D | 13 | 223 | 57111 | 332.69 | 704 | 683 | 169.6 |
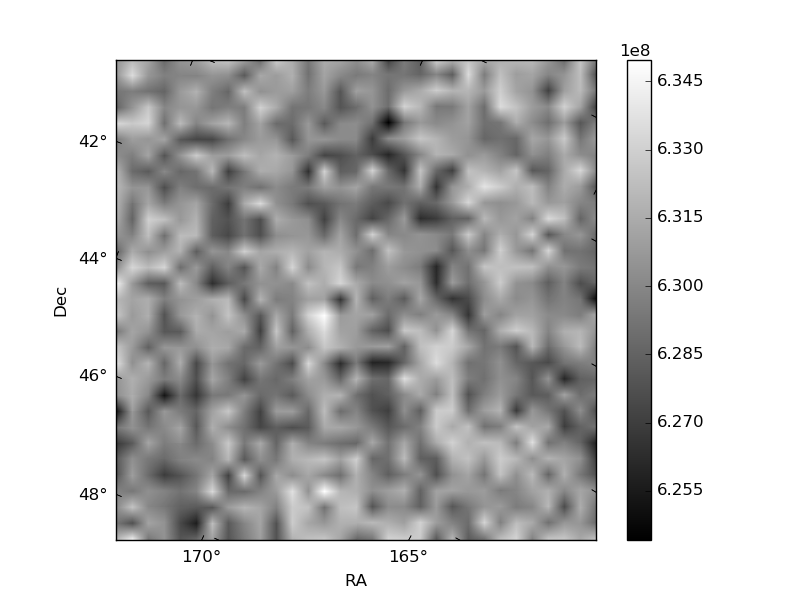
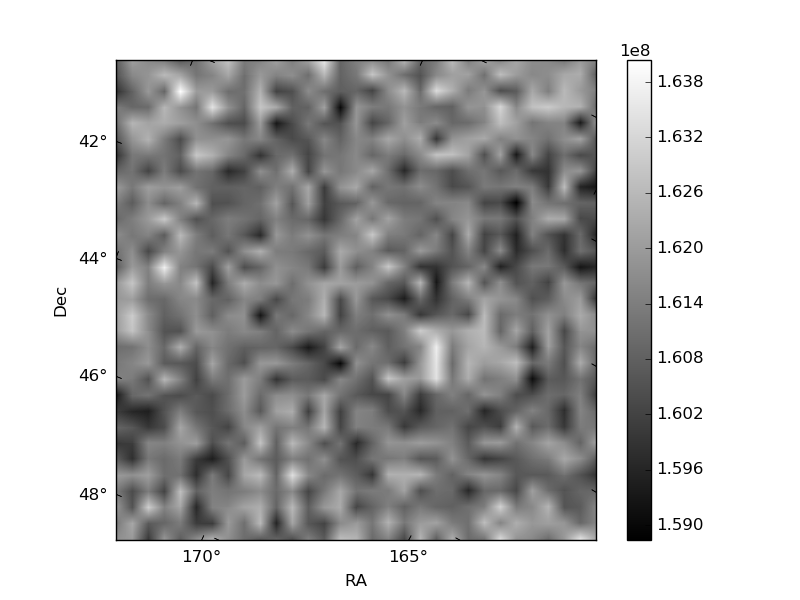
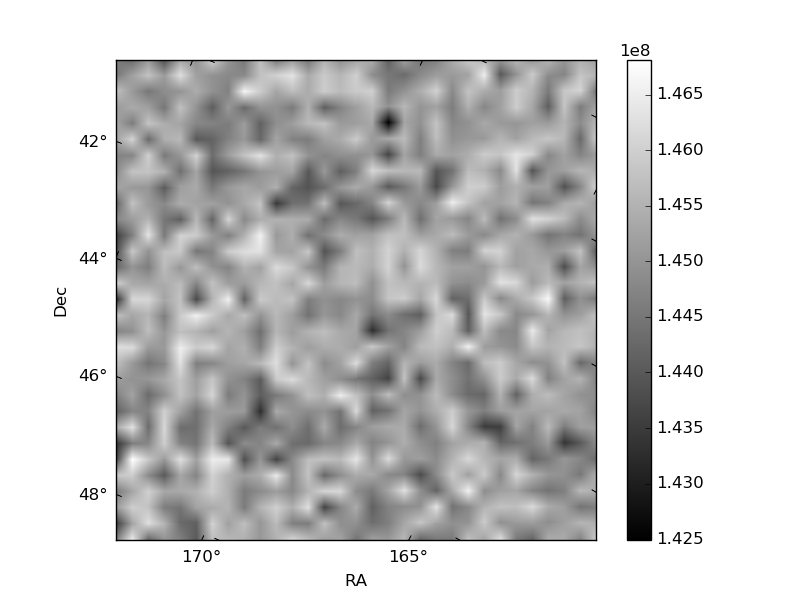
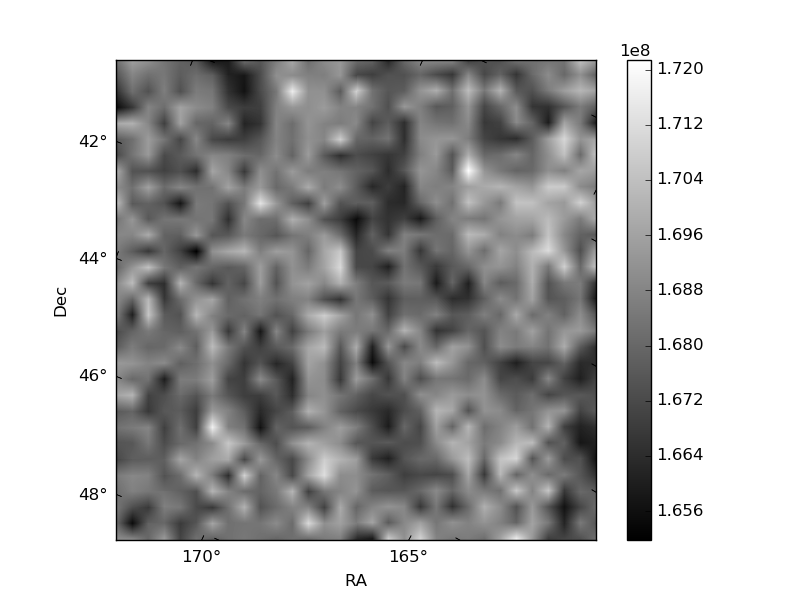
Histogram calculated using DETX and DETY for each event in the final _common_clean file
| Quadrant A | 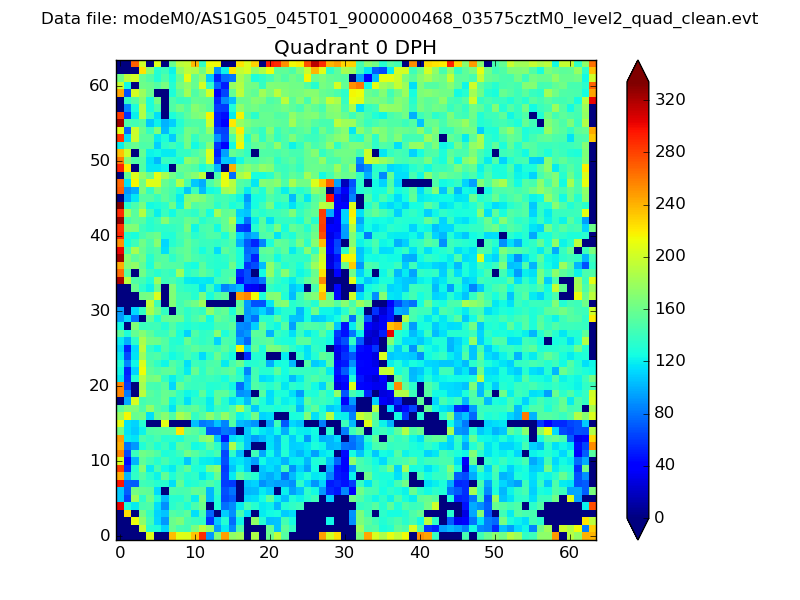 |
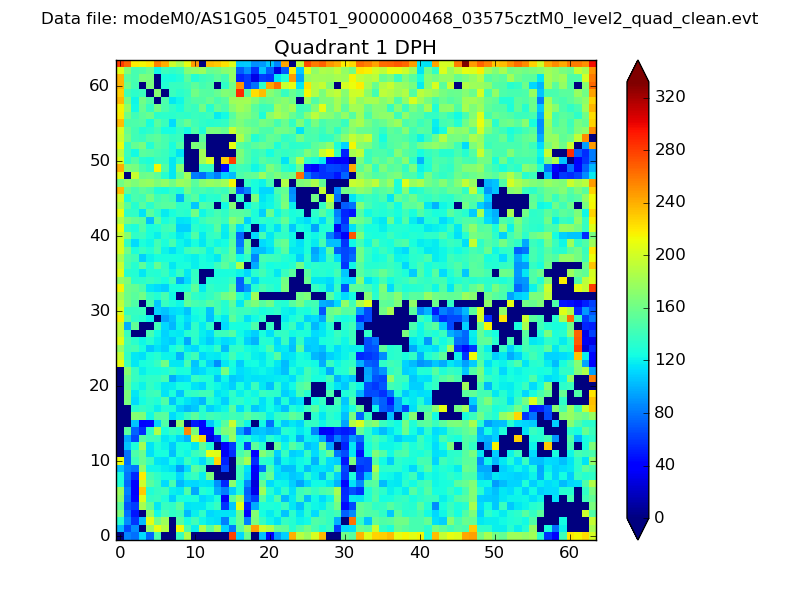 |
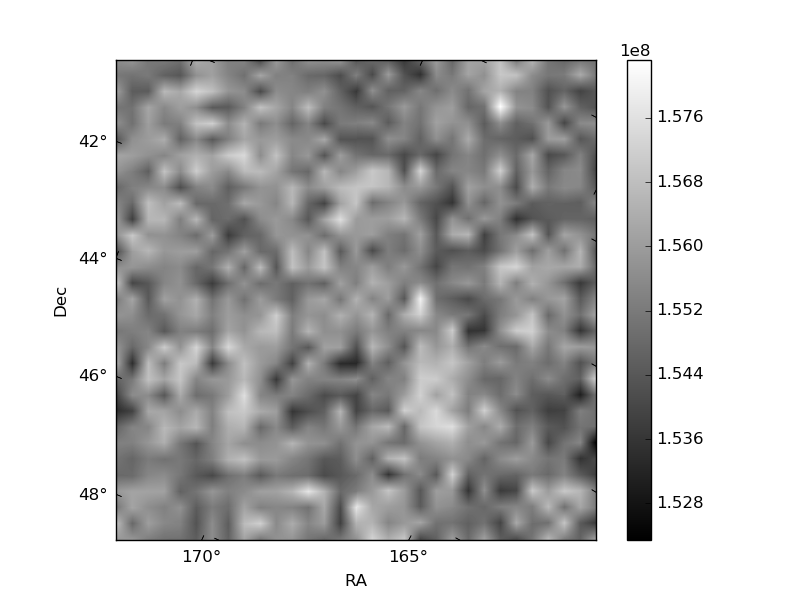
Quadrant B |
|---|---|---|---|
| Quadrant D | 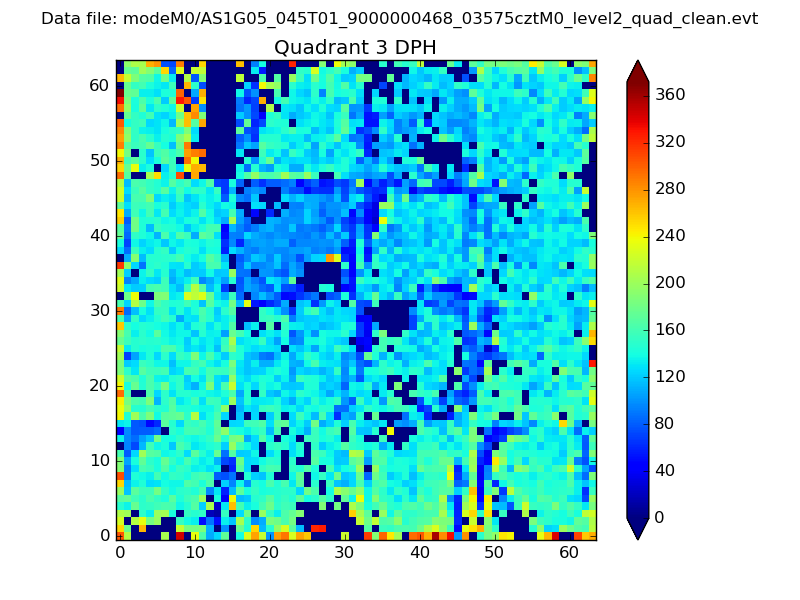 |
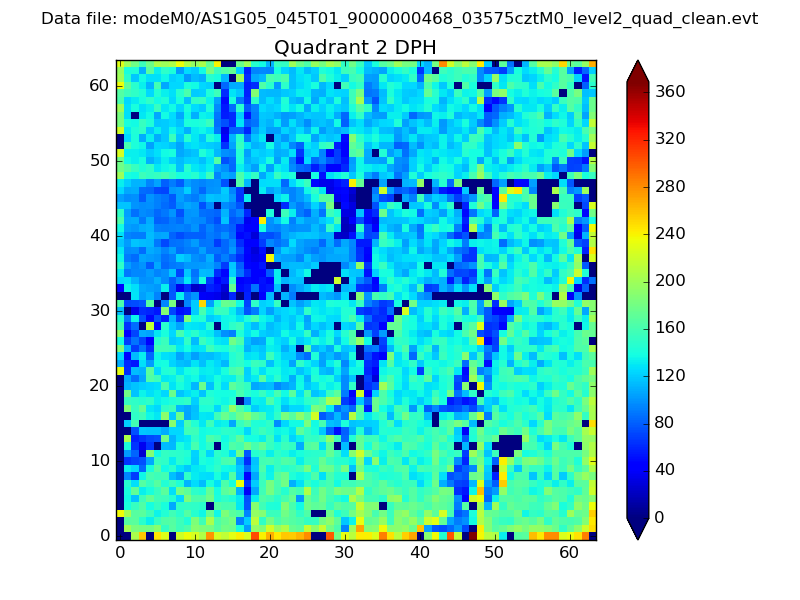 |
Quadrant C |
| Plot type | Count rate plots | Images |
|---|---|---|
| Comparison with Poisson distribution Blue bars denote a histogram of data divided into 1 sec bins. Red curve is a Poisson curve with rate = median count rate of data. |
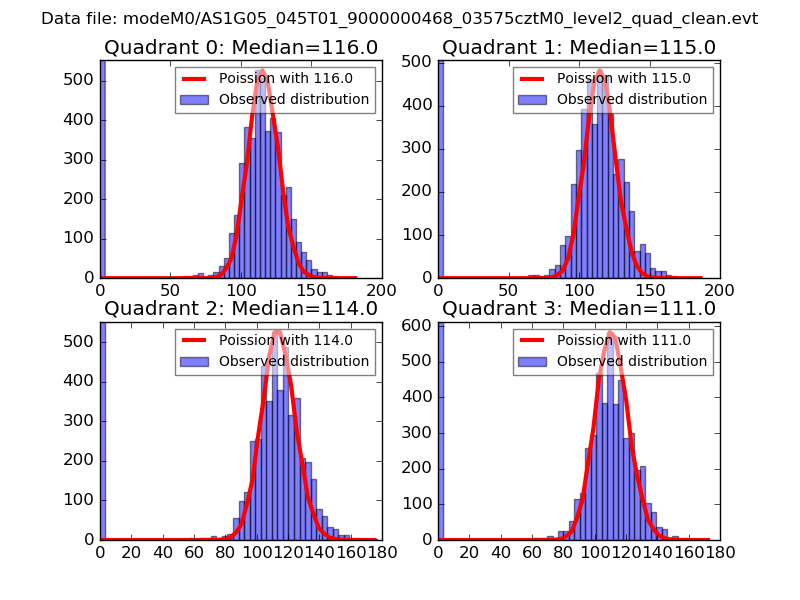 |
 |
| Quadrant-wise count rates Data is divided into 100 sec bins |
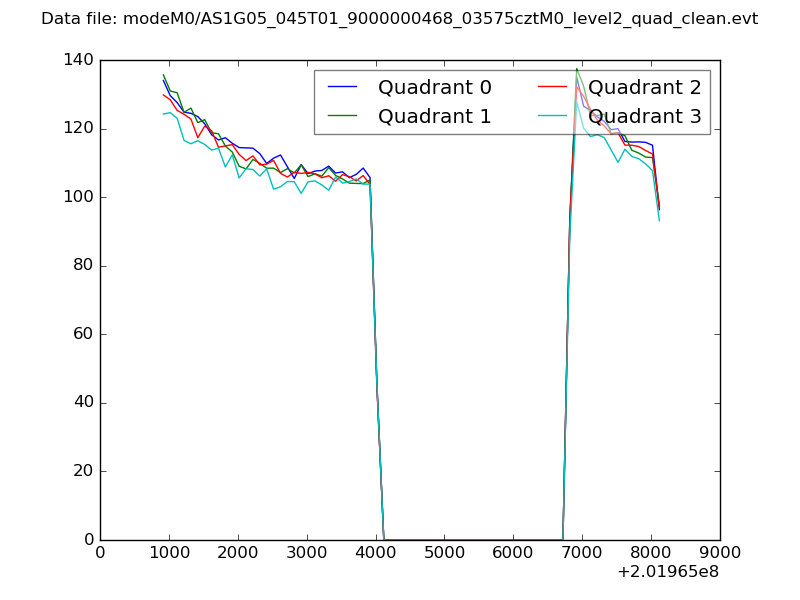 |
|
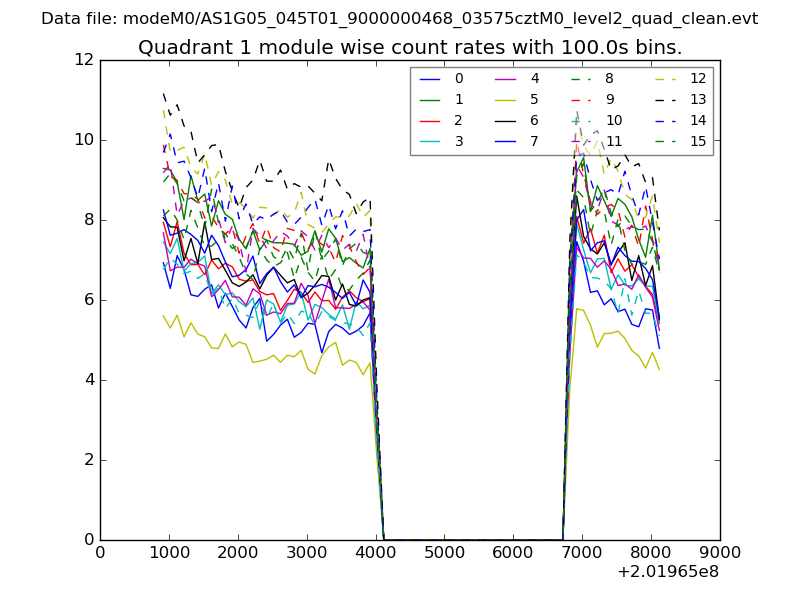
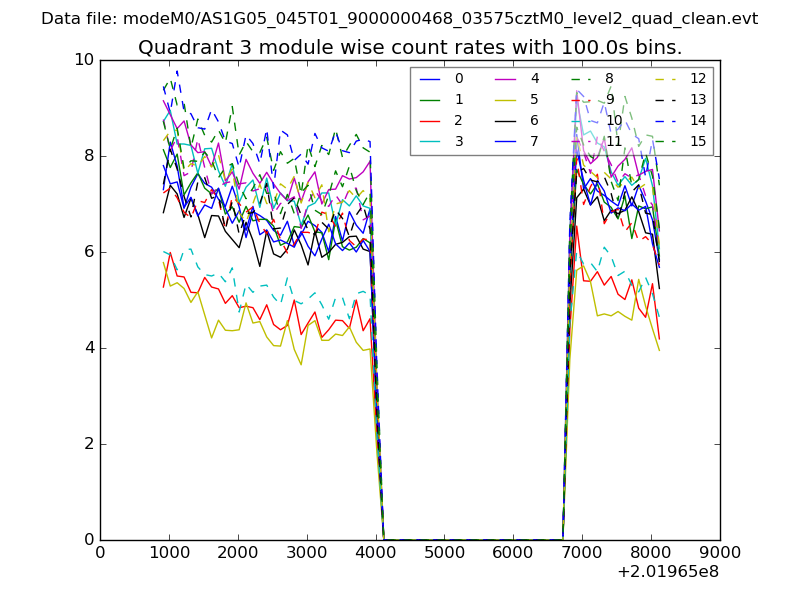
| Module-wise count rates for Quadrant A Data is divided into 100 sec bins |
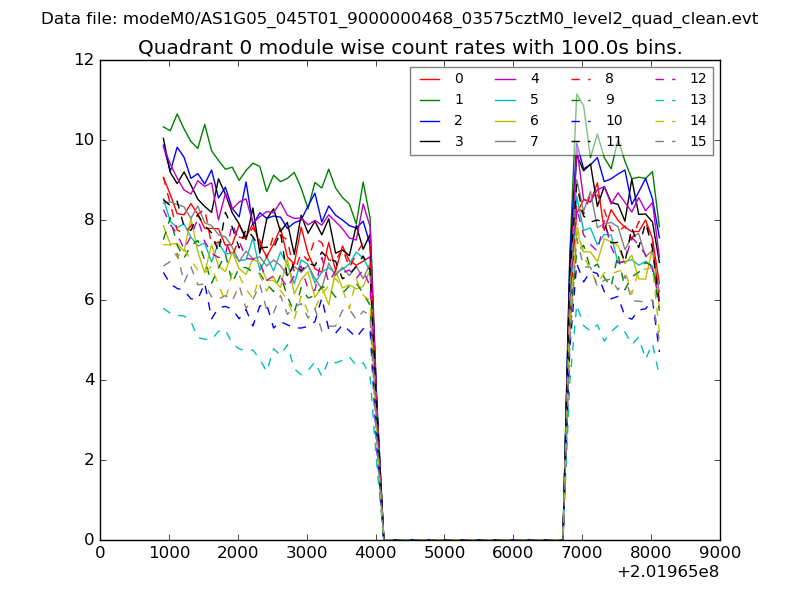 |
 |
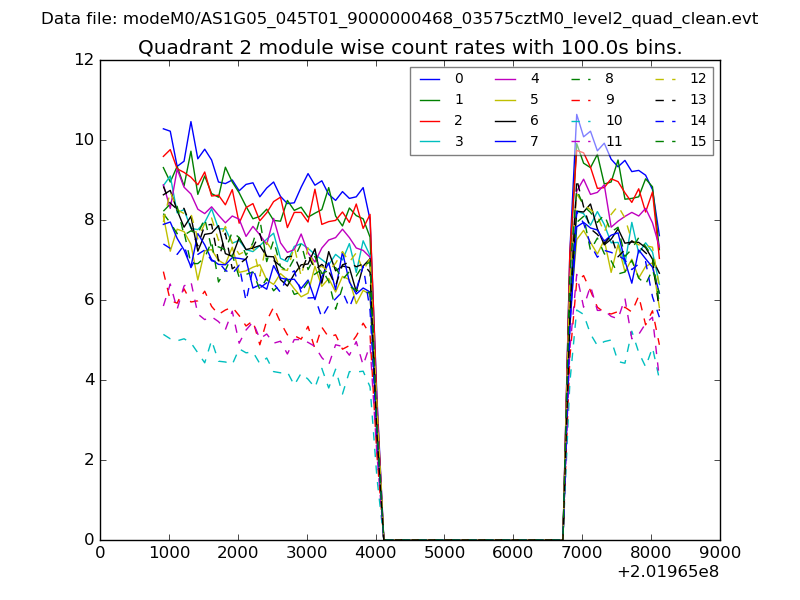
| Module-wise count rates for Quadrant B Data is divided into 100 sec bins |
 |
 |
| Module-wise count rates for Quadrant C Data is divided into 100 sec bins |
 |
 |
| Module-wise count rates for Quadrant D Data is divided into 100 sec bins |
 |
 |
| Parameter | Plot |
|---|---|
| CZT HV Monitor | 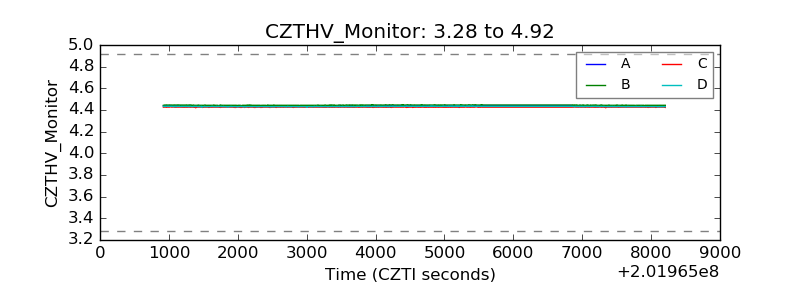 |
| D_VDD |  |
| Temperature 1 | 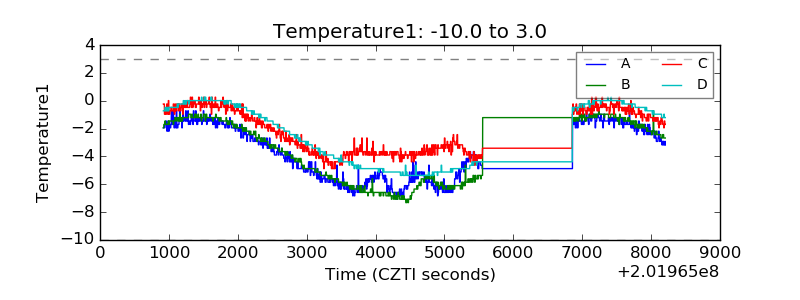 |
| Veto HV Monitor | 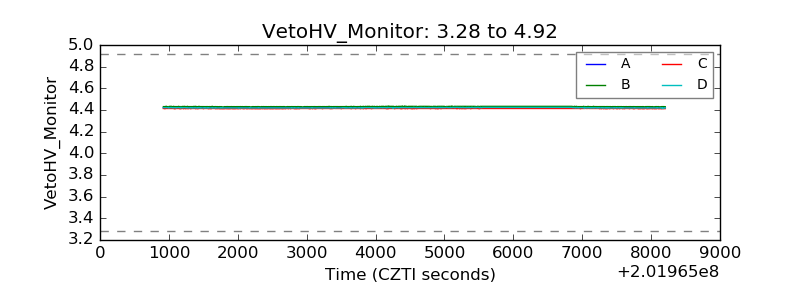 |
| Veto LLD | 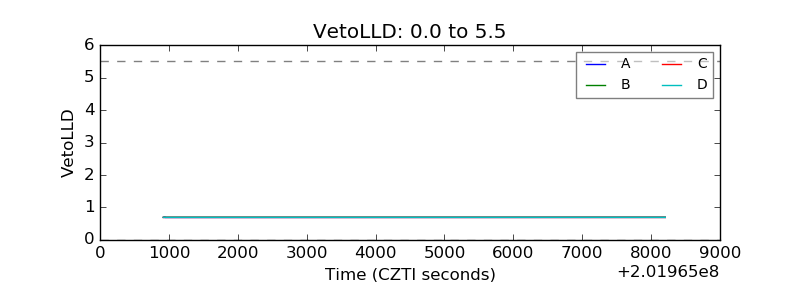 |
| Alpha Counter | 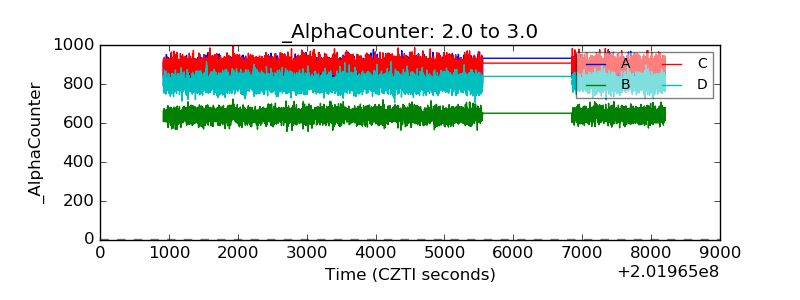 |
| _CPM_Rate | 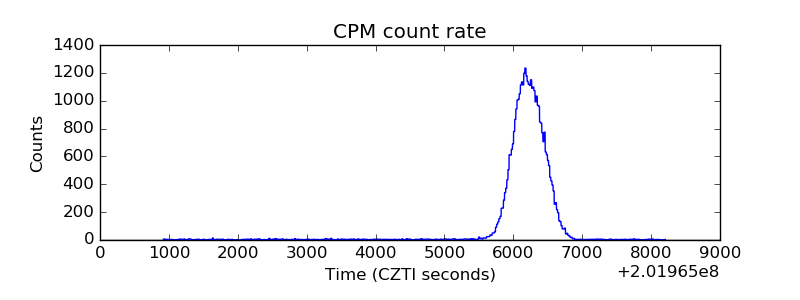 |
| CZT Counter | 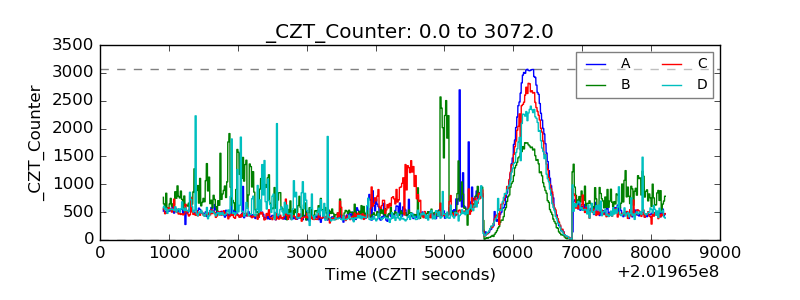 |
| +2.5 Volts monitor |  |
| +5 Volts monitor |  |
| _ROLL_ROT | 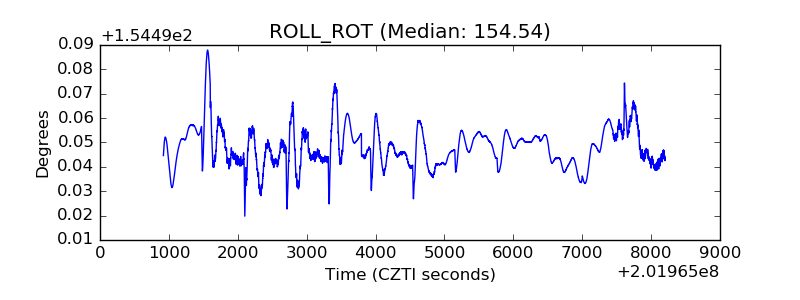 |
| _Roll_DEC | 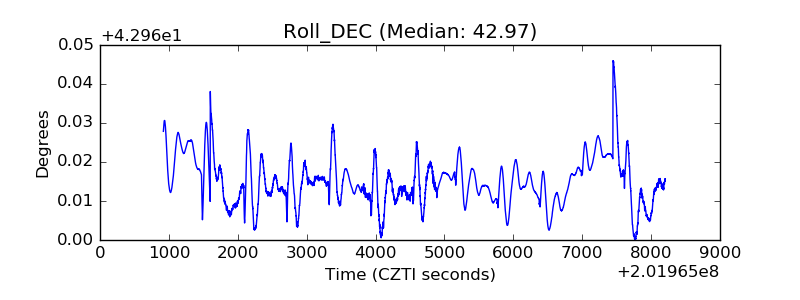 |
| _Roll_RA | 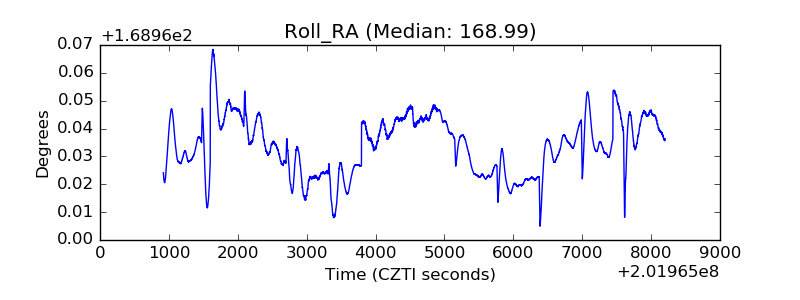 |
| Veto Counter | 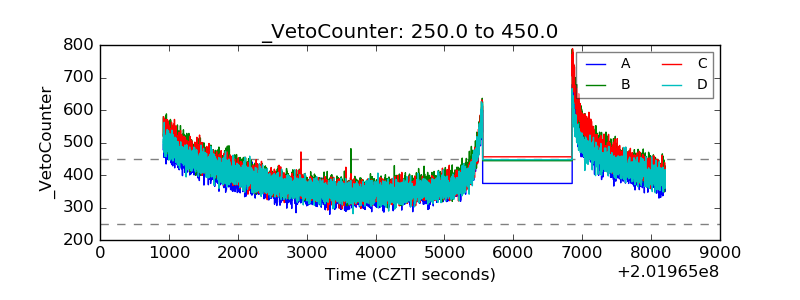 |