| Param | Original file | Final file |
|---|---|---|
| Filename | modeM0/AS1G05_045T01_9000000468_03576cztM0_level2.evt | modeM0/AS1G05_045T01_9000000468_03576cztM0_level2_quad_clean.evt |
| Size (bytes) | 448,937,280 | 86,454,720 |
| Size | 428.1 MB | 82.4 MB |
| Events in quadrant A | 2,990,651 | 552,641 |
| Events in quadrant B | 4,080,217 | 550,557 |
| Events in quadrant C | 2,880,040 | 549,918 |
| Events in quadrant D | 3,222,916 | 531,045 |
| Mode M0 | |||
|---|---|---|---|
| Quadrant | BADHDUFLAG | Total packets | Discarded packets |
| A | 0 | 13158 | 3 |
| B | 0 | 16468 | 2 |
| C | 0 | 12874 | 2 |
| D | 0 | 13870 | 2 |
| Mode M9 | |||
|---|---|---|---|
| Quadrant | BADHDUFLAG | Total packets | Discarded packets |
| A | 0 | 12 | 0 |
| B | 0 | 12 | 0 |
| C | 0 | 12 | 0 |
| D | 0 | 13 | 0 |
| Mode SS | |||
|---|---|---|---|
| Quadrant | BADHDUFLAG | Total packets | Discarded packets |
| A | 0 | 128 | 0 |
| B | 0 | 128 | 0 |
| C | 0 | 128 | 0 |
| D | 0 | 128 | 0 |
| Quadrant | Total seconds | Saturated seconds | Saturation percentage |
|---|---|---|---|
| A | 6210 | 50 | 0.805153% |
| B | 6210 | 84 | 1.352657% |
| C | 6210 | 38 | 0.611916% |
| D | 6210 | 53 | 0.853462% |
Noise dominated data is calculated using 1-second bins in cleaned event files. If a bin has >2000 counts, and if more than 50% of those come from <1% of pixels, then it is considered to be noise-dominated and hence unusable.
| Quadrant | # 1 sec bins | Bins with >0 counts | Bins with >2000 counts | High rate bins dominated by noise | Noise dominated (total time) | Noise dominated (detector-on time) | Marked lightcurve |
|---|---|---|---|---|---|---|---|
| A | 7460 | 6211 | 2 | 2 | 0.03% | 0.03% | 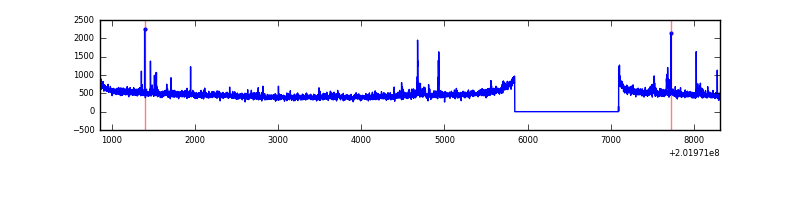 |
| B | 7460 | 6211 | 10 | 10 | 0.13% | 0.16% | 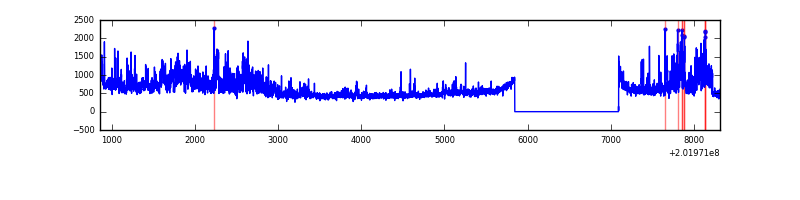 |
| C | 7460 | 6211 | 1 | 1 | 0.01% | 0.02% | 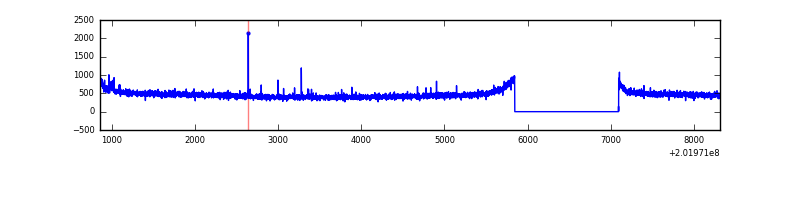 |
| D | 7460 | 6211 | 34 | 34 | 0.46% | 0.55% | 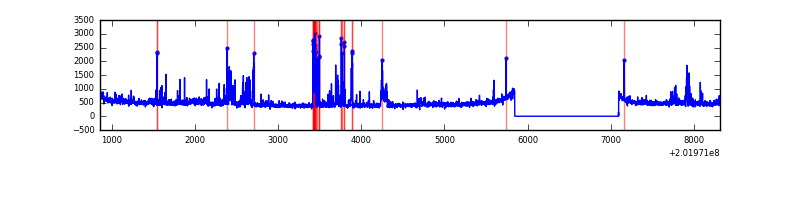 |
Top three noisy pixels from each quadrant. If the there are fewer than three noisy pixels in the level2.evt file, extra rows are filled as -1
| Pixel properties | Quadrant properties | ||||||
|---|---|---|---|---|---|---|---|
| Quadrant | DetID | PixID | Counts | Sigma | Mean | Median | Sigma |
| A | 0 | 50 | 41089 | 268.47 | 740 | 724 | 150.4 |
| A | 3 | 1 | 34509 | 224.7 | 740 | 724 | 150.4 |
| A | 8 | 15 | 25847 | 167.09 | 740 | 724 | 150.4 |
| B | 15 | 204 | 932333 | 6602.26 | 748 | 730 | 141.1 |
| B | 4 | 81 | 74789 | 524.86 | 748 | 730 | 141.1 |
| B | 0 | 229 | 44781 | 312.19 | 748 | 730 | 141.1 |
| C | 2 | 53 | 13230 | 73.48 | 728 | 731 | 170.1 |
| C | 1 | 16 | 6426 | 33.48 | 728 | 731 | 170.1 |
| C | 13 | 61 | 6212 | 32.22 | 728 | 731 | 170.1 |
| D | 14 | 34 | 124736 | 707.21 | 725 | 706 | 175.4 |
| D | 13 | 70 | 89253 | 504.89 | 725 | 706 | 175.4 |
| D | 13 | 46 | 51279 | 288.36 | 725 | 706 | 175.4 |
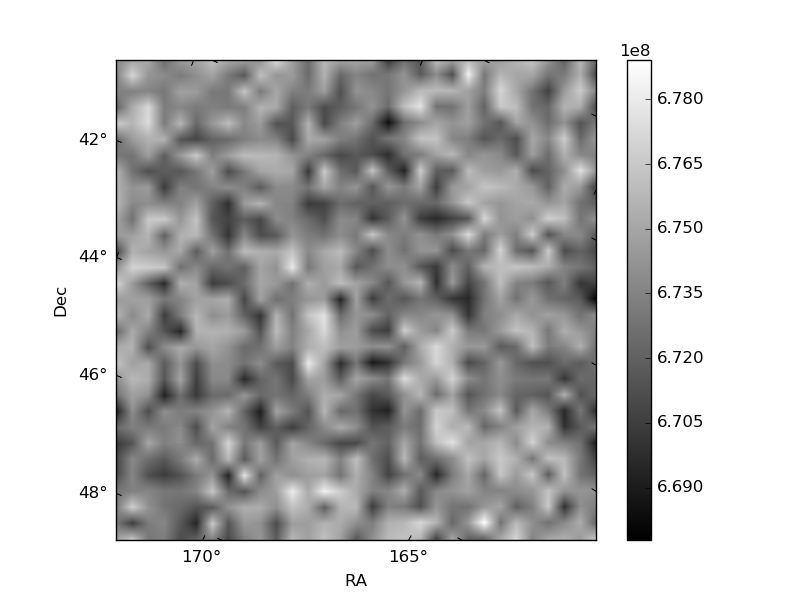
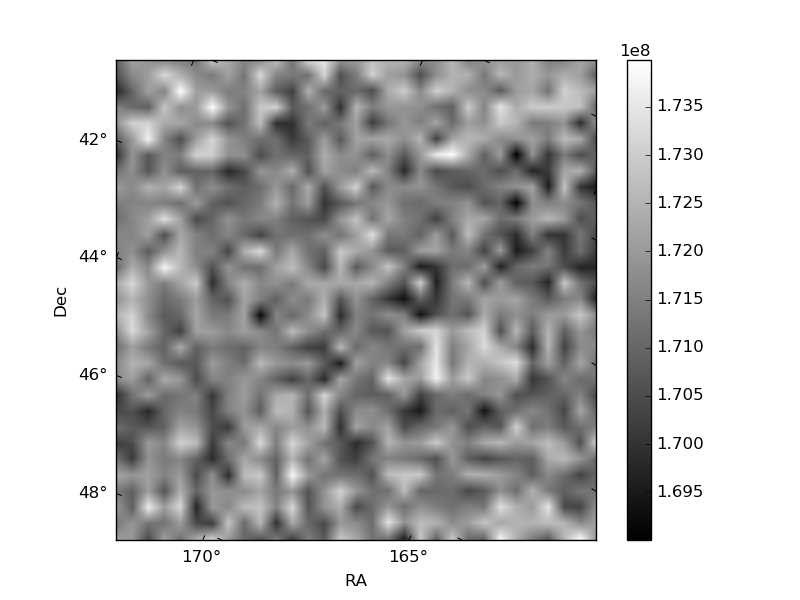
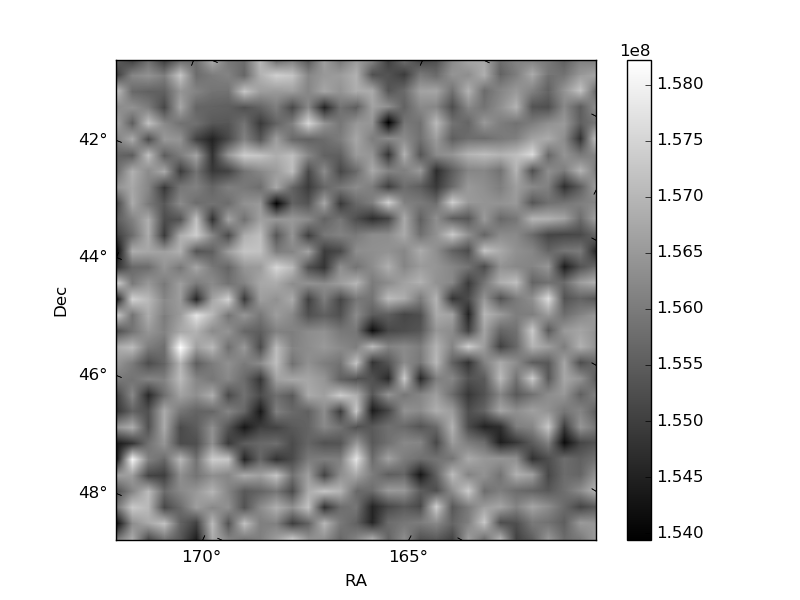
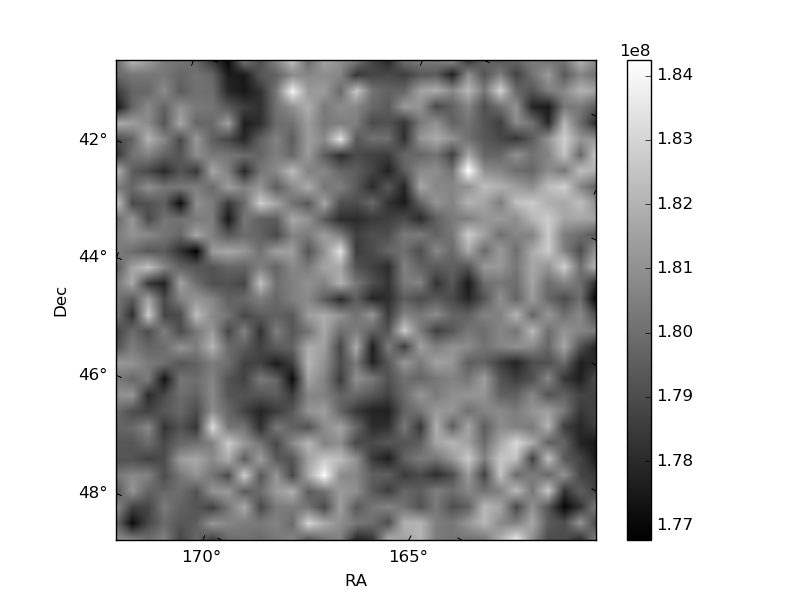
Histogram calculated using DETX and DETY for each event in the final _common_clean file
| Quadrant A | 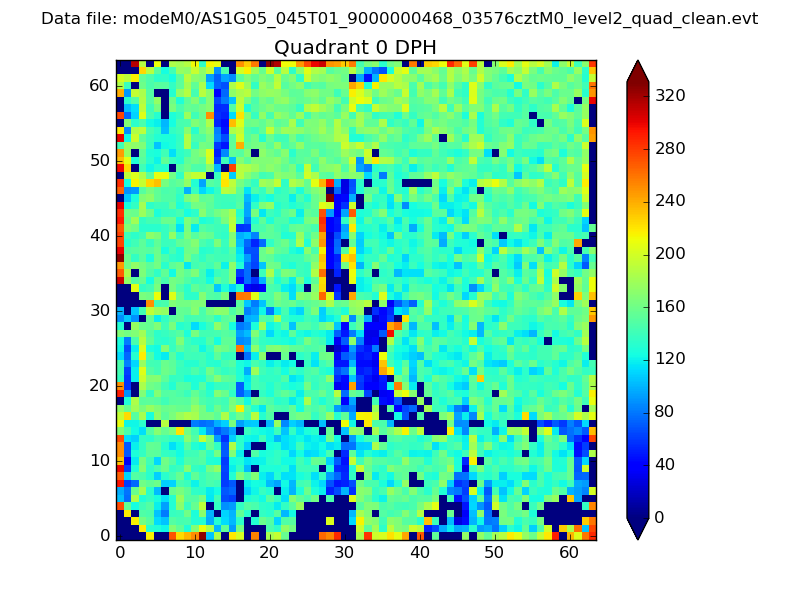 |
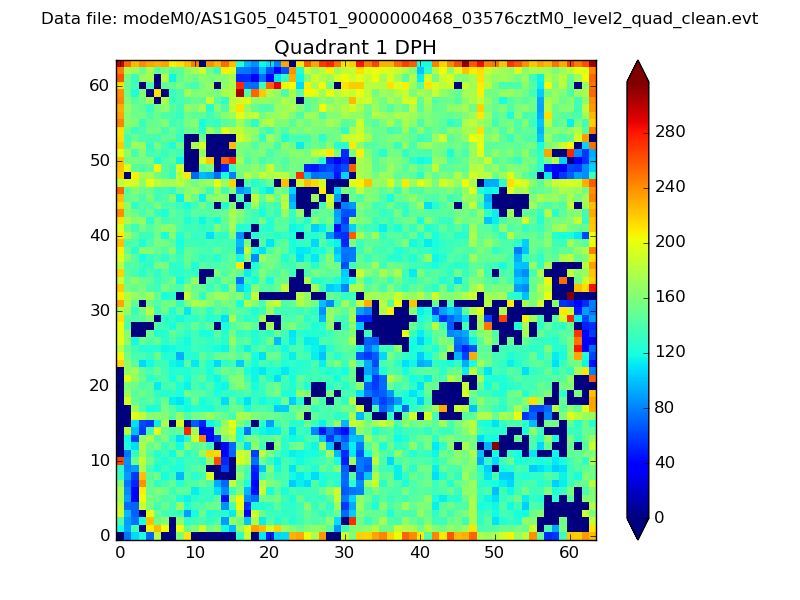 |
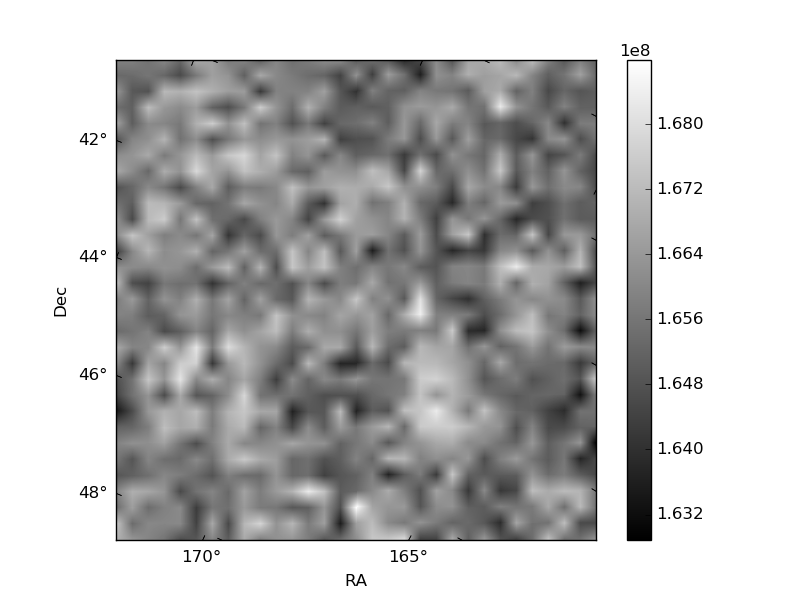
Quadrant B |
|---|---|---|---|
| Quadrant D | 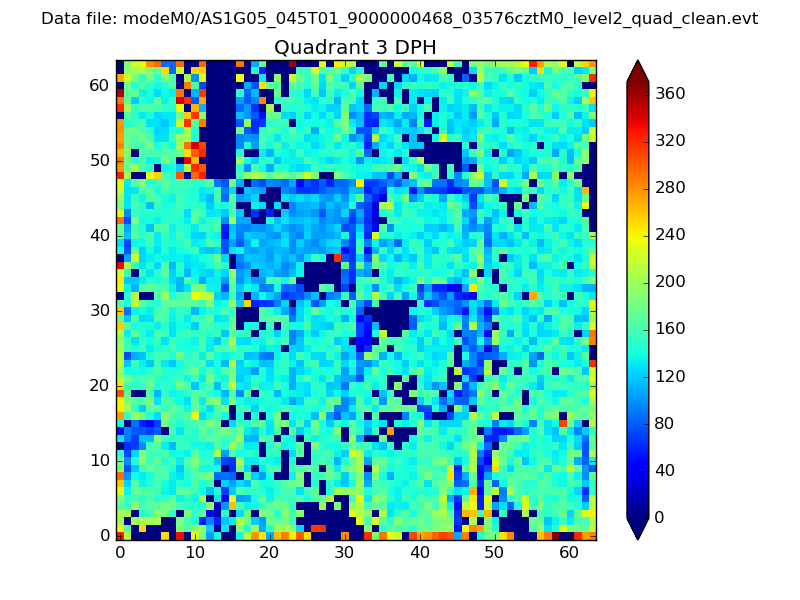 |
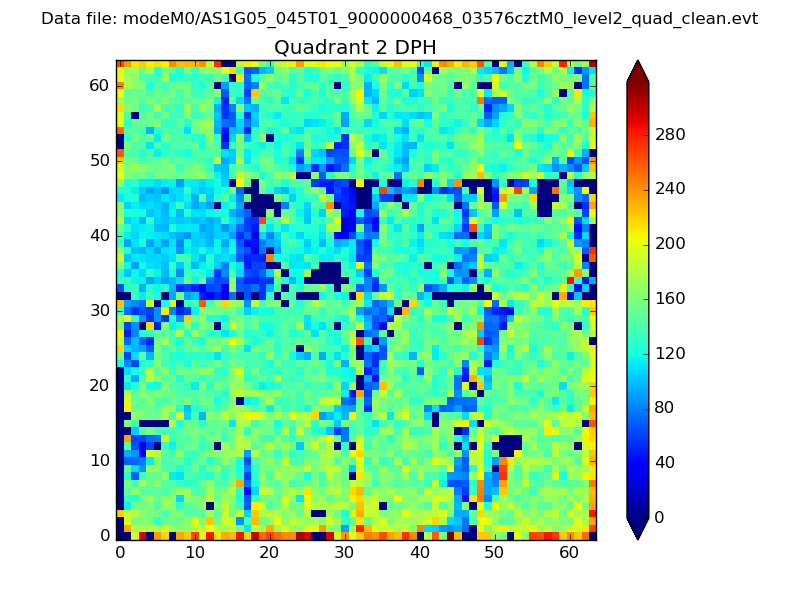 |
Quadrant C |
| Plot type | Count rate plots | Images |
|---|---|---|
| Comparison with Poisson distribution Blue bars denote a histogram of data divided into 1 sec bins. Red curve is a Poisson curve with rate = median count rate of data. |
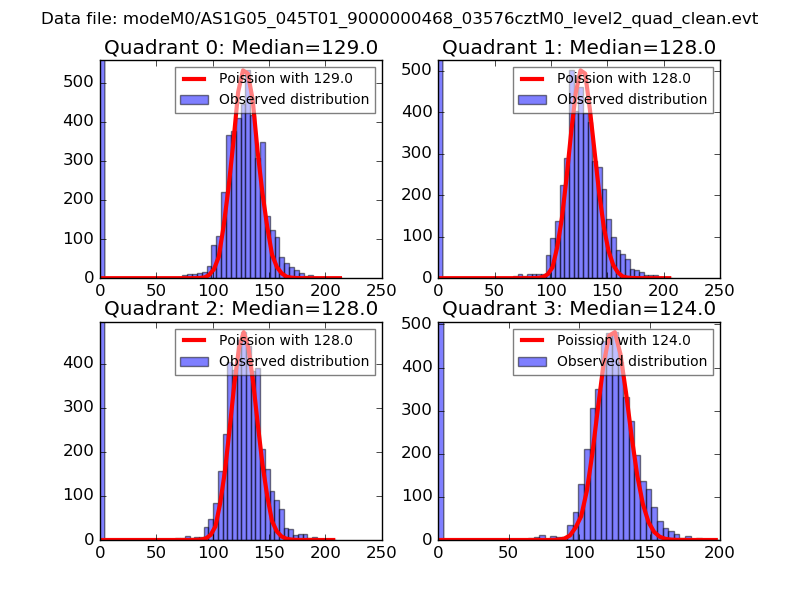 |
 |
| Quadrant-wise count rates Data is divided into 100 sec bins |
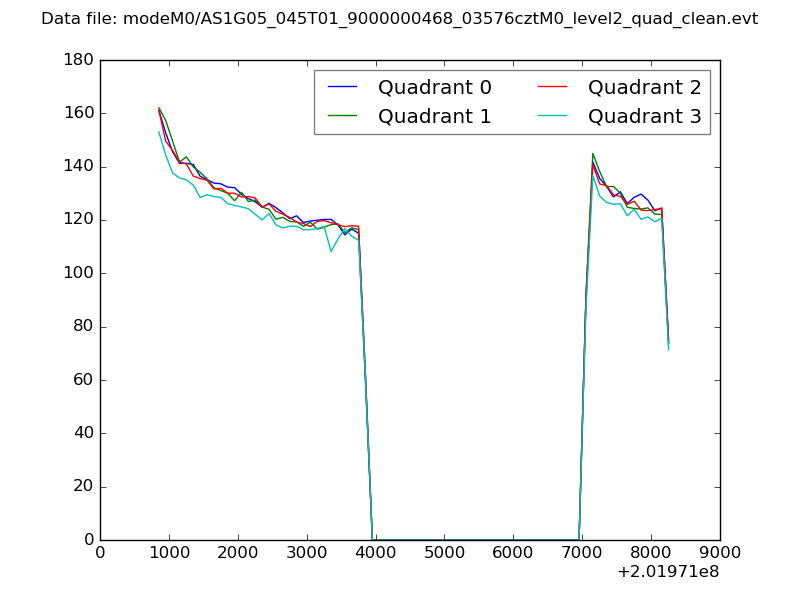 |
|
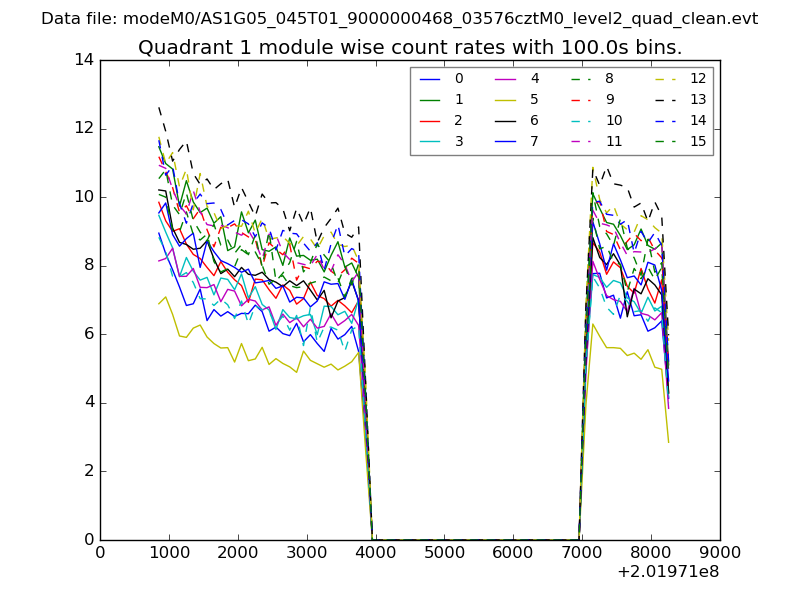
| Module-wise count rates for Quadrant A Data is divided into 100 sec bins |
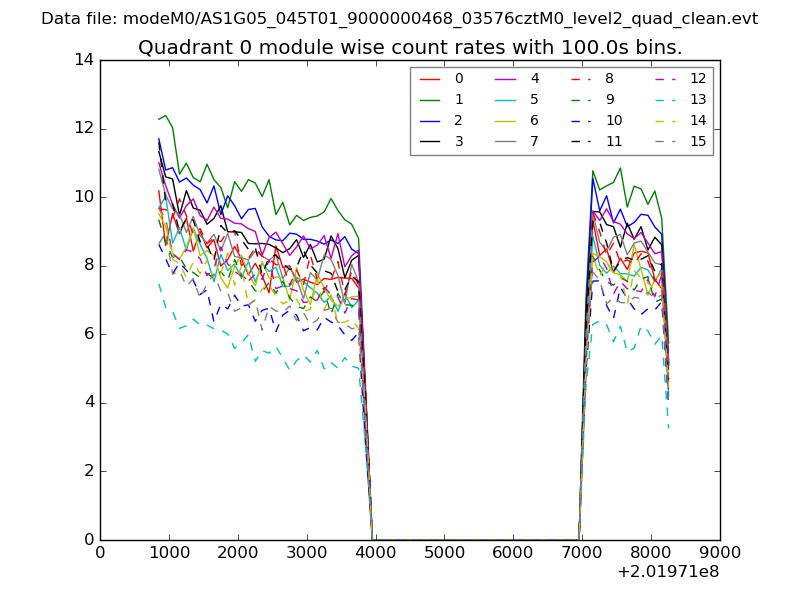 |
 |
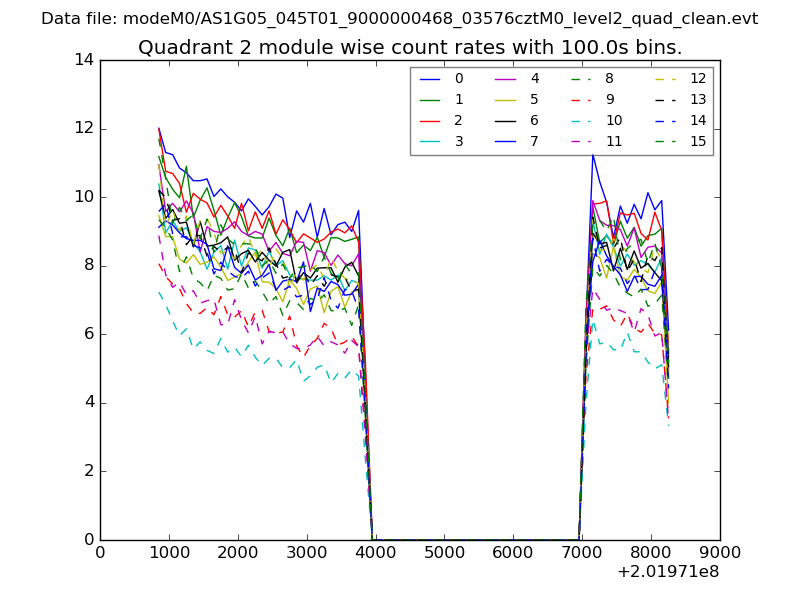
| Module-wise count rates for Quadrant B Data is divided into 100 sec bins |
 |
 |
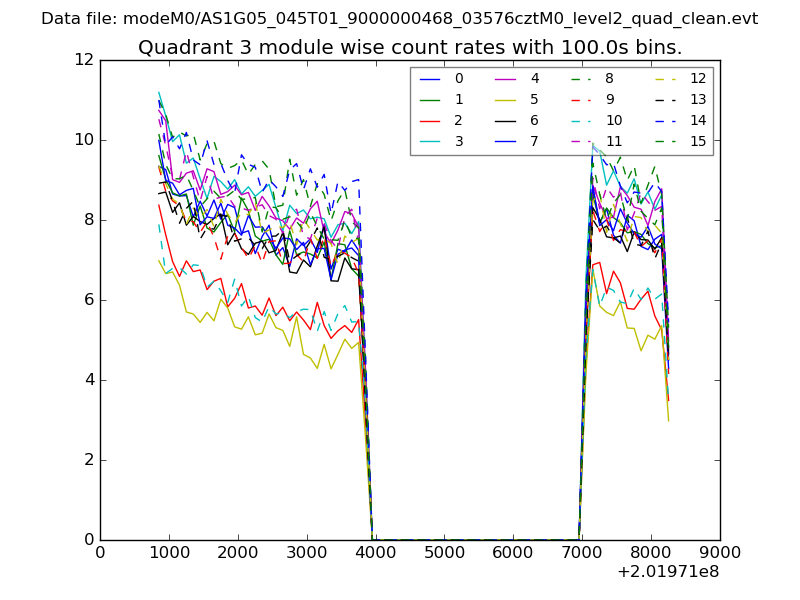
| Module-wise count rates for Quadrant C Data is divided into 100 sec bins |
 |
 |
| Module-wise count rates for Quadrant D Data is divided into 100 sec bins |
 |
 |
| Parameter | Plot |
|---|---|
| CZT HV Monitor |  |
| D_VDD | 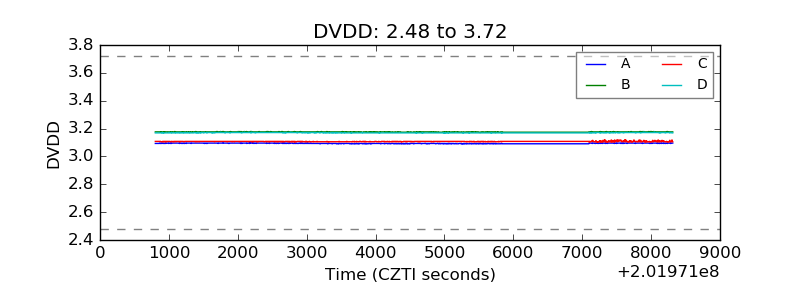 |
| Temperature 1 | 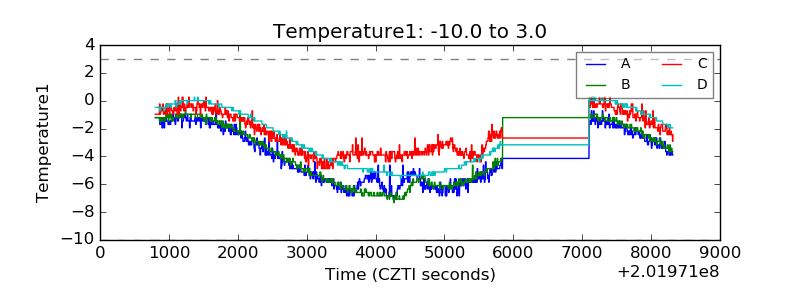 |
| Veto HV Monitor | 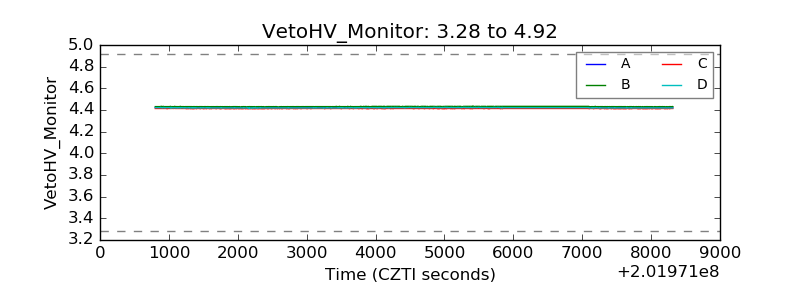 |
| Veto LLD | 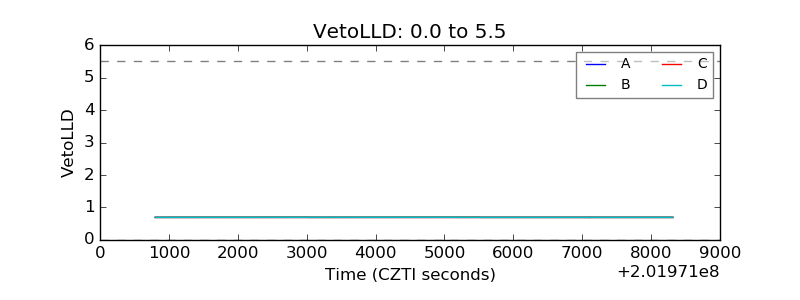 |
| Alpha Counter | 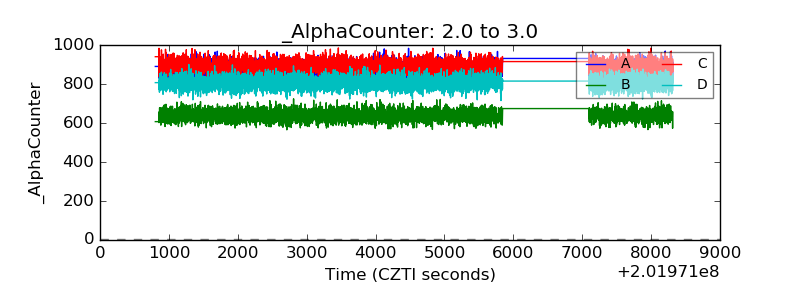 |
| _CPM_Rate | 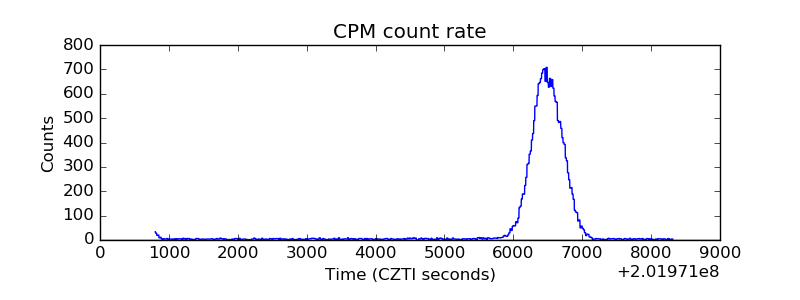 |
| CZT Counter | 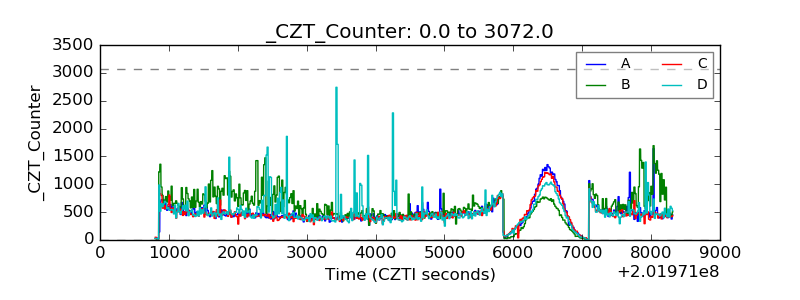 |
| +2.5 Volts monitor |  |
| +5 Volts monitor |  |
| _ROLL_ROT | 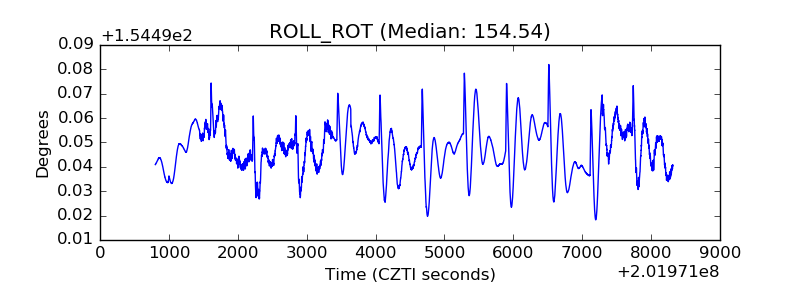 |
| _Roll_DEC | 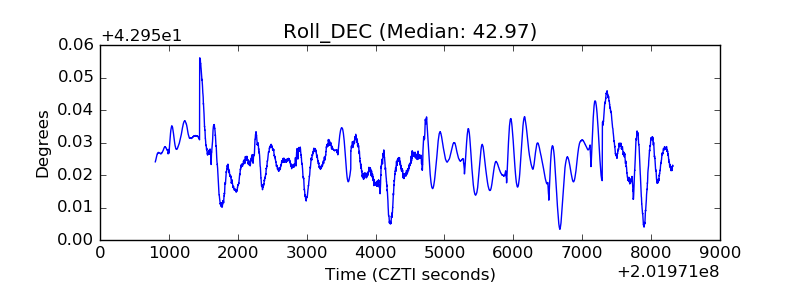 |
| _Roll_RA | 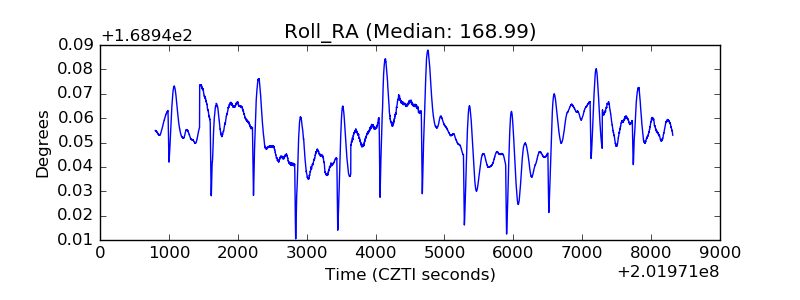 |
| Veto Counter | 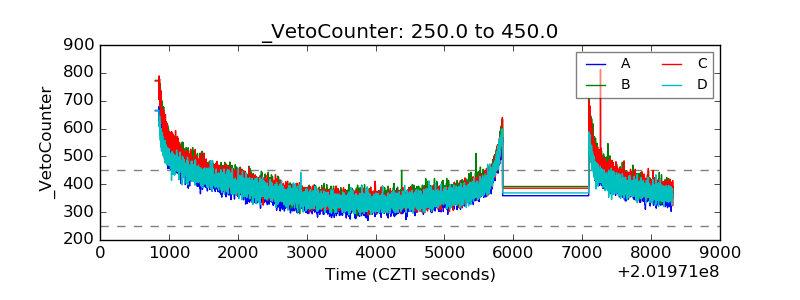 |