| Param | Original file | Final file |
|---|---|---|
| Filename | modeM0/AS1G05_045T01_9000000468_03580cztM0_level2.evt | modeM0/AS1G05_045T01_9000000468_03580cztM0_level2_quad_clean.evt |
| Size (bytes) | 109,474,560 | 24,215,040 |
| Size | 104.4 MB | 23.1 MB |
| Events in quadrant A | 666,488 | 161,305 |
| Events in quadrant B | 1,021,327 | 159,489 |
| Events in quadrant C | 673,906 | 161,522 |
| Events in quadrant D | 862,087 | 152,380 |
| Mode M0 | |||
|---|---|---|---|
| Quadrant | BADHDUFLAG | Total packets | Discarded packets |
| A | 0 | 2887 | 1 |
| B | 0 | 3980 | 1 |
| C | 0 | 2874 | 1 |
| D | 0 | 3478 | 1 |
| Mode M9 | |||
|---|---|---|---|
| Quadrant | BADHDUFLAG | Total packets | Discarded packets |
| A | 0 | 3 | 0 |
| B | 0 | 3 | 0 |
| C | 0 | 3 | 0 |
| D | 0 | 3 | 0 |
| Mode SS | |||
|---|---|---|---|
| Quadrant | BADHDUFLAG | Total packets | Discarded packets |
| A | 0 | 28 | 0 |
| B | 0 | 28 | 0 |
| C | 0 | 28 | 0 |
| D | 0 | 28 | 0 |
| Quadrant | Total seconds | Saturated seconds | Saturation percentage |
|---|---|---|---|
| A | 1308 | 22 | 1.681957% |
| B | 1308 | 92 | 7.033639% |
| C | 1308 | 19 | 1.452599% |
| D | 1308 | 60 | 4.587156% |
Noise dominated data is calculated using 1-second bins in cleaned event files. If a bin has >2000 counts, and if more than 50% of those come from <1% of pixels, then it is considered to be noise-dominated and hence unusable.
| Quadrant | # 1 sec bins | Bins with >0 counts | Bins with >2000 counts | High rate bins dominated by noise | Noise dominated (total time) | Noise dominated (detector-on time) | Marked lightcurve |
|---|---|---|---|---|---|---|---|
| A | 1558 | 1309 | 0 | 0 | 0.00% | 0.00% | 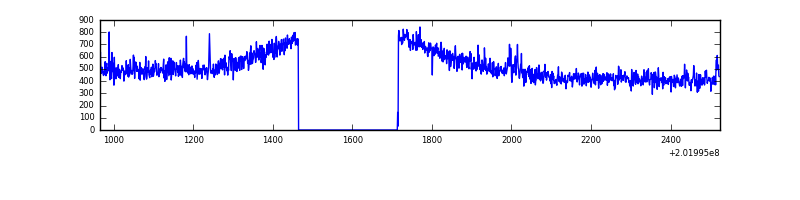 |
| B | 1558 | 1309 | 7 | 7 | 0.45% | 0.53% | 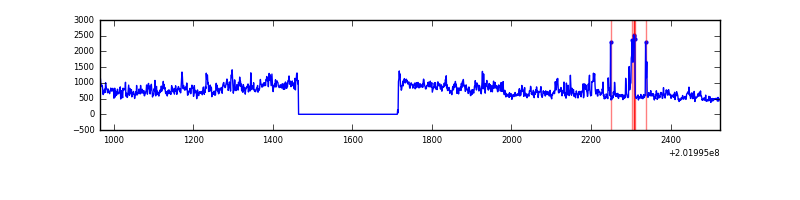 |
| C | 1558 | 1309 | 0 | 0 | 0.00% | 0.00% | 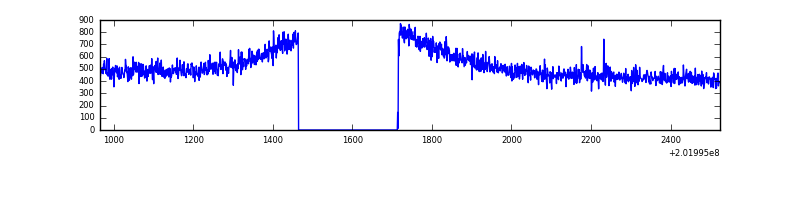 |
| D | 1558 | 1309 | 44 | 44 | 2.82% | 3.36% | 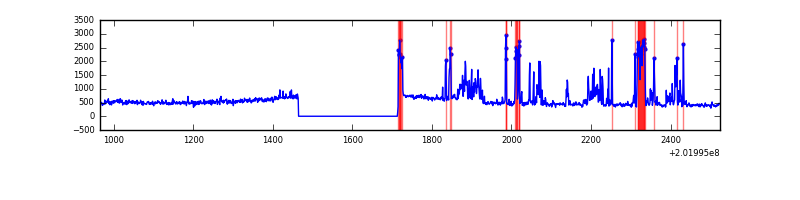 |
Top three noisy pixels from each quadrant. If the there are fewer than three noisy pixels in the level2.evt file, extra rows are filled as -1
| Pixel properties | Quadrant properties | ||||||
|---|---|---|---|---|---|---|---|
| Quadrant | DetID | PixID | Counts | Sigma | Mean | Median | Sigma |
| A | 3 | 1 | 3833 | 97.07 | 170 | 165 | 37.8 |
| A | 0 | 118 | 2184 | 53.43 | 170 | 165 | 37.8 |
| A | 15 | 234 | 2144 | 52.37 | 170 | 165 | 37.8 |
| B | 15 | 204 | 277115 | 7800.78 | 172 | 167 | 35.5 |
| B | 5 | 172 | 43398 | 1217.69 | 172 | 167 | 35.5 |
| B | 3 | 0 | 9258 | 256.07 | 172 | 167 | 35.5 |
| C | 8 | 128 | 3129 | 70.78 | 170 | 169 | 41.8 |
| C | 1 | 16 | 1583 | 33.81 | 170 | 169 | 41.8 |
| C | 13 | 61 | 1427 | 30.08 | 170 | 169 | 41.8 |
| D | 14 | 34 | 119782 | 2865.78 | 166 | 160 | 41.7 |
| D | 13 | 70 | 35606 | 849.18 | 166 | 160 | 41.7 |
| D | 7 | 39 | 31995 | 762.67 | 166 | 160 | 41.7 |
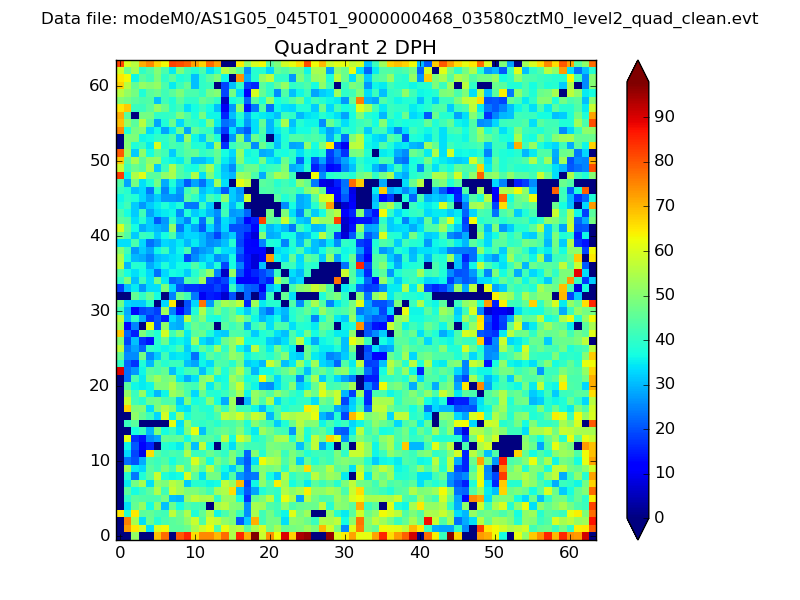
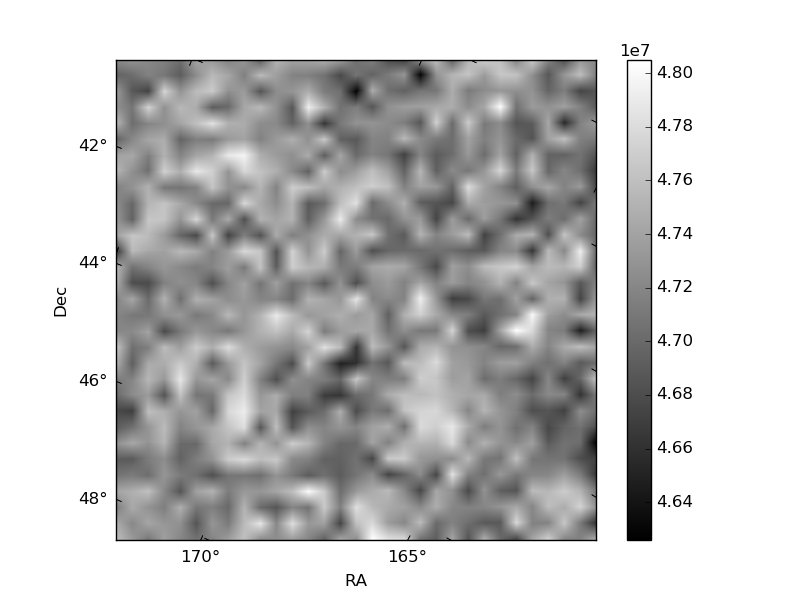
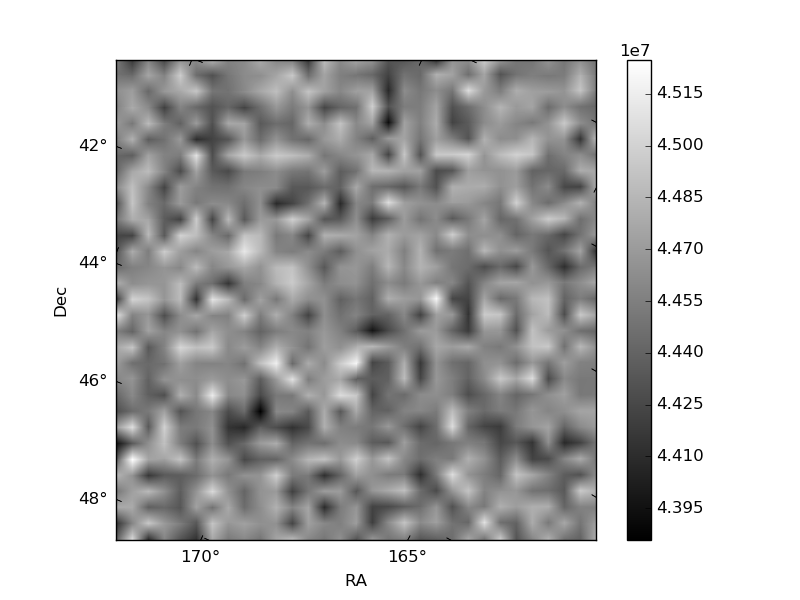
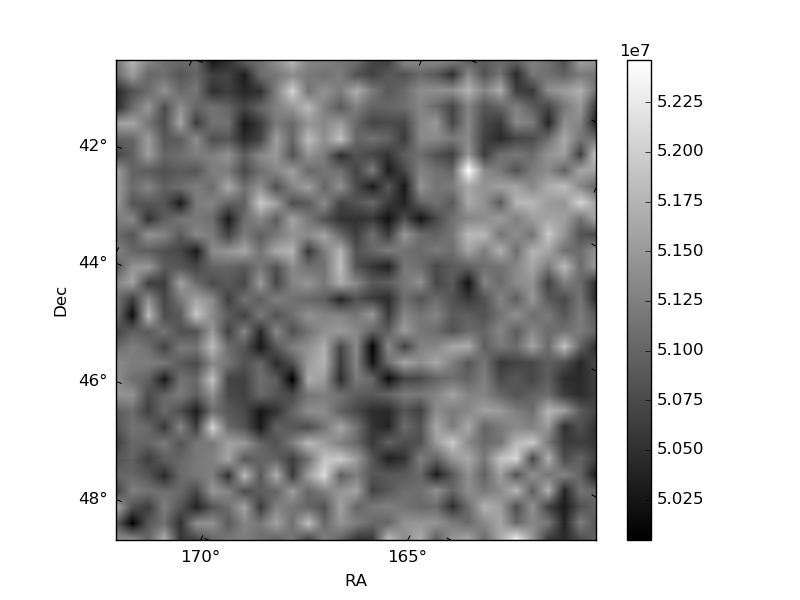
Histogram calculated using DETX and DETY for each event in the final _common_clean file
| Quadrant A | 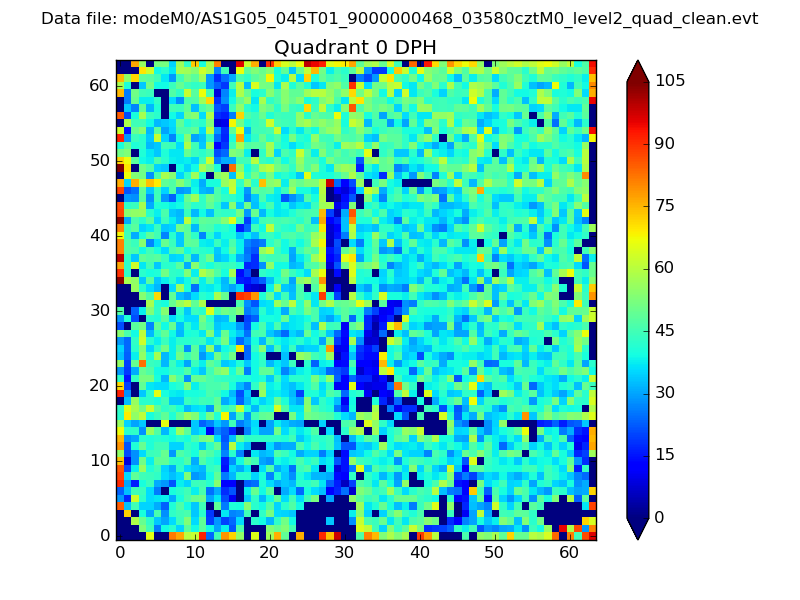 |
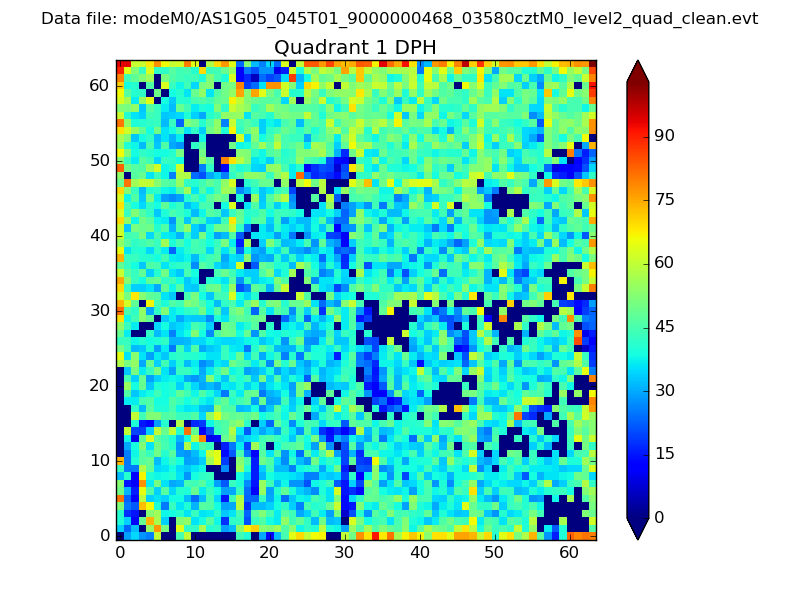 |
Quadrant B |
|---|---|---|---|
| Quadrant D | 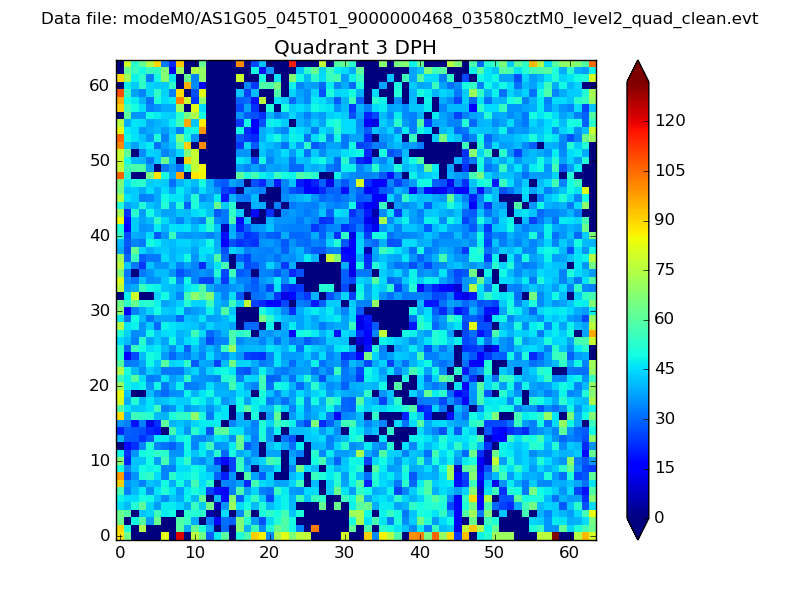 |
 |
Quadrant C |
| Plot type | Count rate plots | Images |
|---|---|---|
| Comparison with Poisson distribution Blue bars denote a histogram of data divided into 1 sec bins. Red curve is a Poisson curve with rate = median count rate of data. |
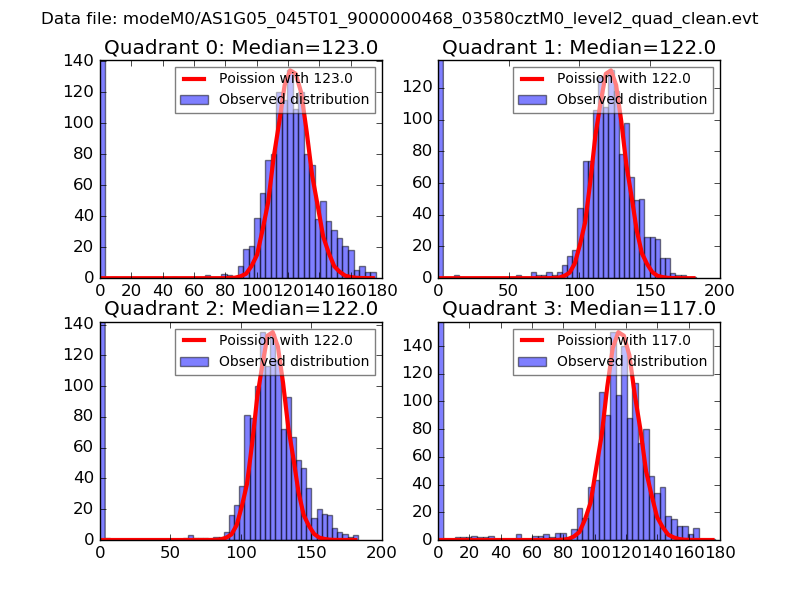 |
 |
| Quadrant-wise count rates Data is divided into 100 sec bins |
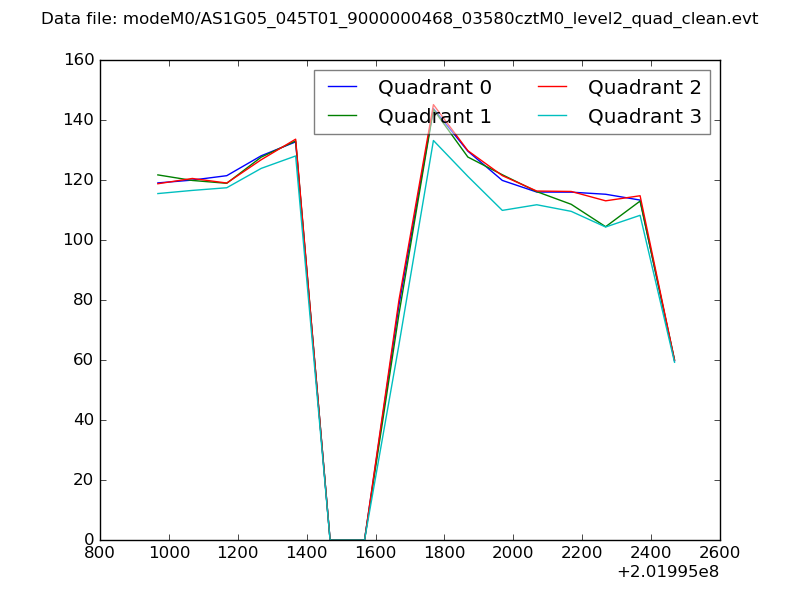 |
|
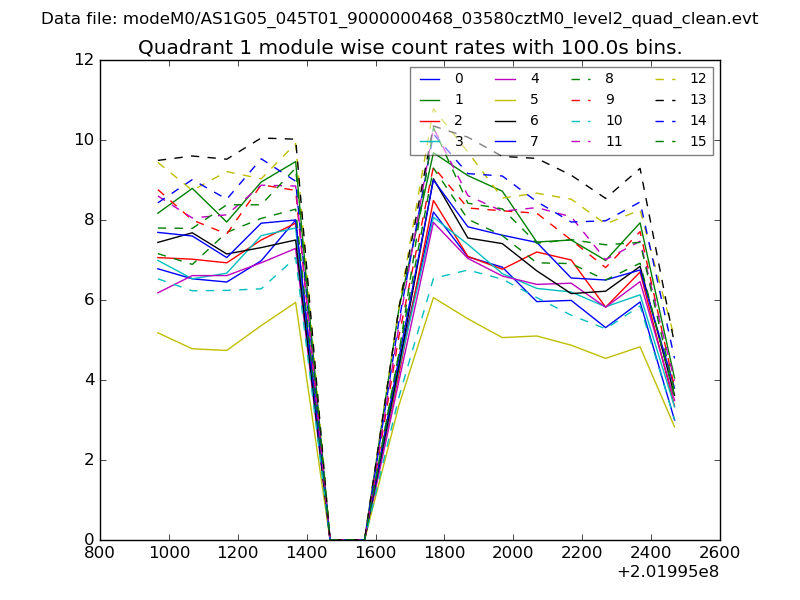
| Module-wise count rates for Quadrant A Data is divided into 100 sec bins |
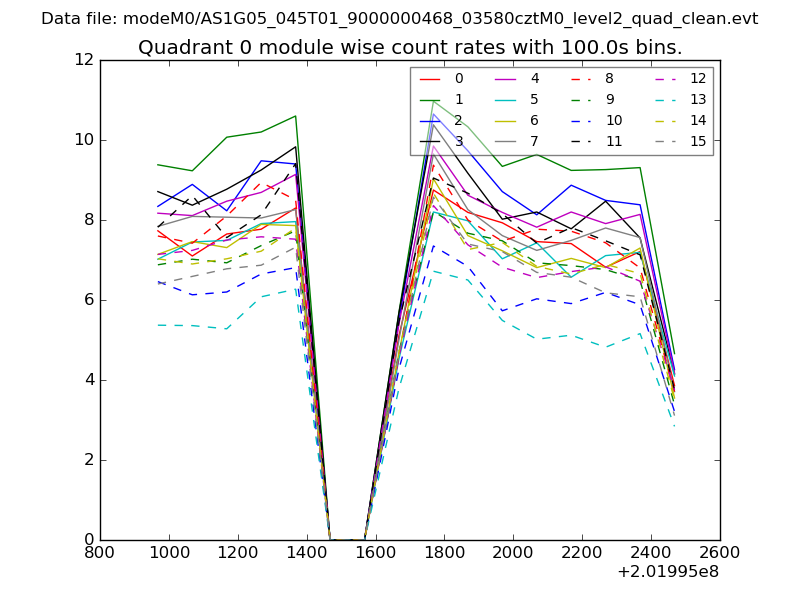 |
 |
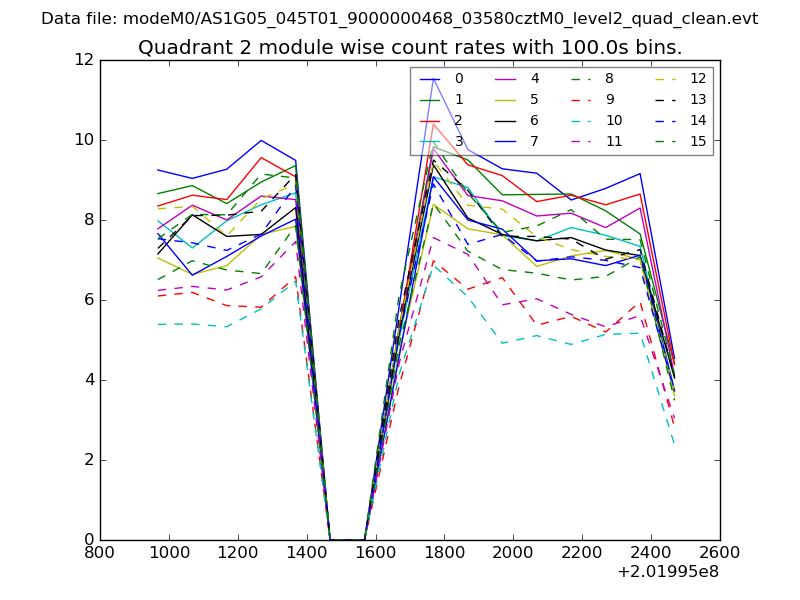
| Module-wise count rates for Quadrant B Data is divided into 100 sec bins |
 |
 |
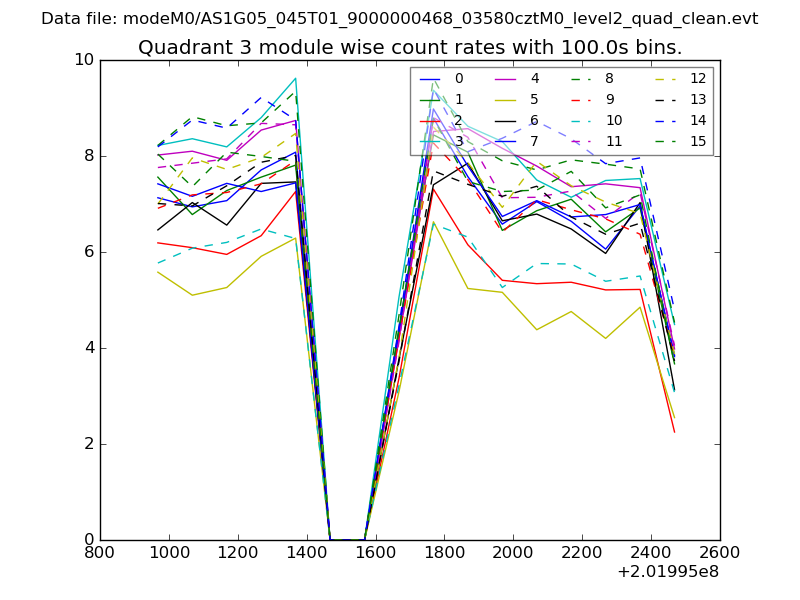
| Module-wise count rates for Quadrant C Data is divided into 100 sec bins |
 |
 |
| Module-wise count rates for Quadrant D Data is divided into 100 sec bins |
 |
 |
| Parameter | Plot |
|---|---|
| CZT HV Monitor | 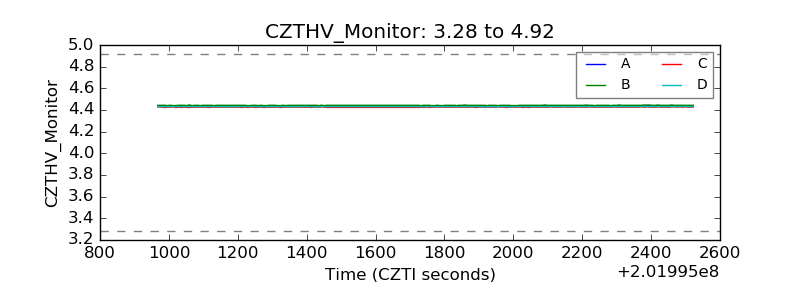 |
| D_VDD | 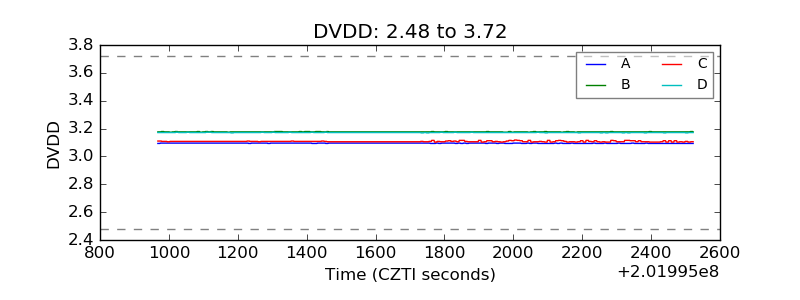 |
| Temperature 1 | 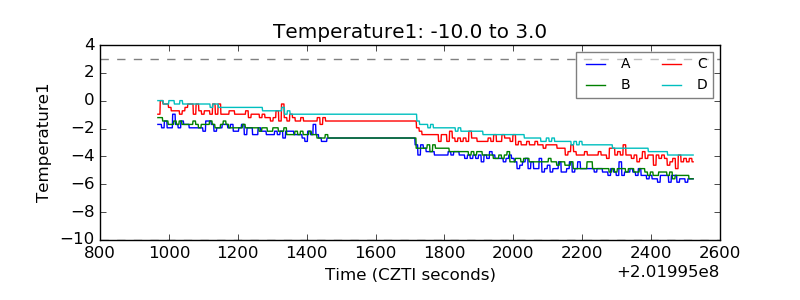 |
| Veto HV Monitor | 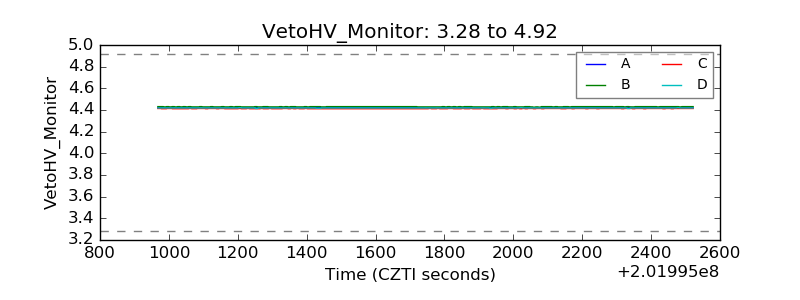 |
| Veto LLD | 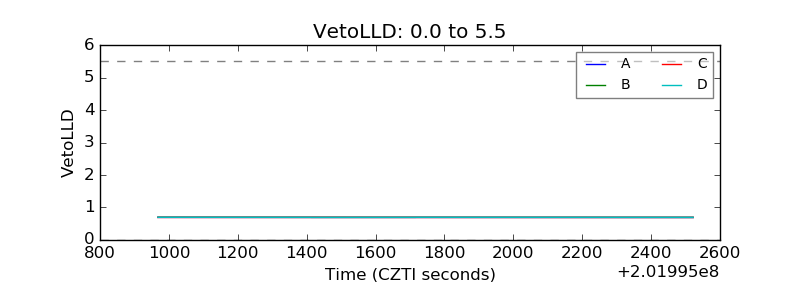 |
| Alpha Counter | 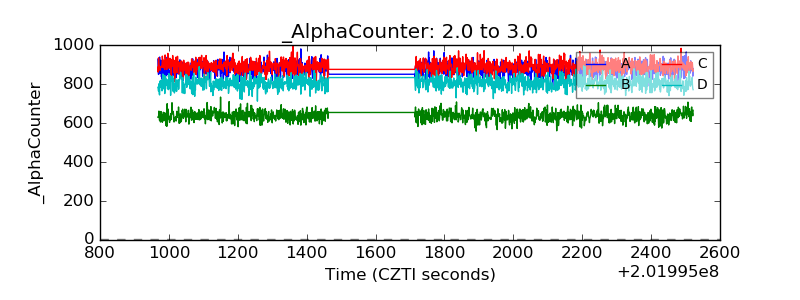 |
| _CPM_Rate |  |
| CZT Counter | 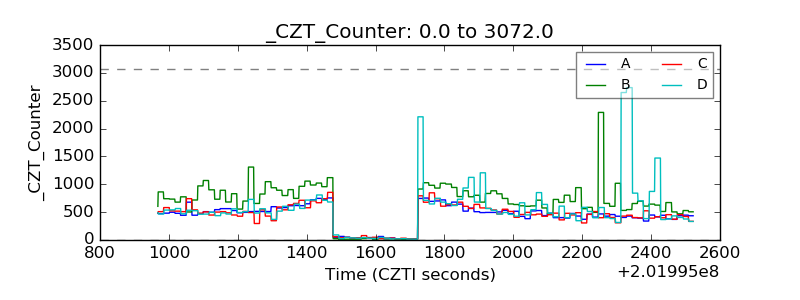 |
| +2.5 Volts monitor |  |
| +5 Volts monitor |  |
| _ROLL_ROT | 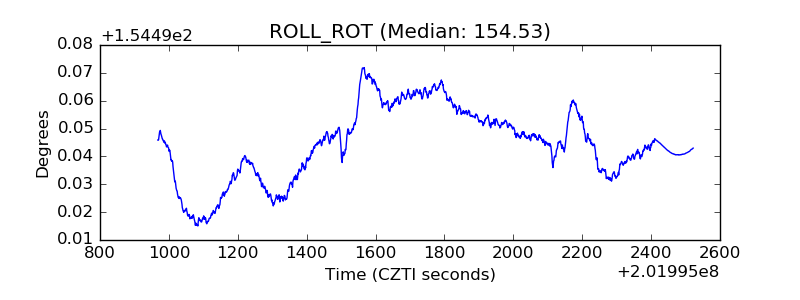 |
| _Roll_DEC | 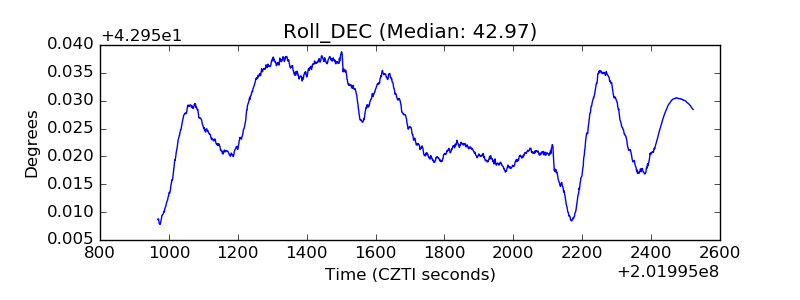 |
| _Roll_RA |  |
| Veto Counter | 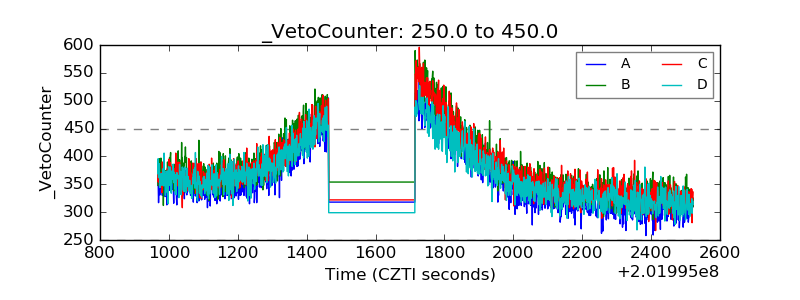 |