| Param | Original file | Final file |
|---|---|---|
| Filename | modeM0/AS1G05_246T03_9000000470cztM0_level2.fits | modeM0/AS1G05_246T03_9000000470cztM0_level2_quad_clean.evt |
| Size (bytes) | 587,718,720 | 640,635,840 |
| Size | 560.5 MB | 611.0 MB |
| Events in quadrant A | 3,533,318 | 3,904,774 |
| Events in quadrant B | 3,410,494 | 3,922,555 |
| Events in quadrant C | 3,407,904 | 3,641,488 |
| Events in quadrant D | 3,021,464 | 3,509,480 |
| Mode SS | |||
|---|---|---|---|
| Quadrant | BADHDUFLAG | Total packets | Discarded packets |
| A | 0 | 1314 | 0 |
| B | 0 | 1314 | 0 |
| C | 0 | 1314 | 0 |
| D | 0 | 1314 | 0 |
| Mode M0 | |||
|---|---|---|---|
| Quadrant | BADHDUFLAG | Total packets | Discarded packets |
| A | 0 | 134143 | 0 |
| B | 0 | 141204 | 0 |
| C | 0 | 156547 | 0 |
| D | 0 | 137836 | 0 |
| Mode M9 | |||
|---|---|---|---|
| Quadrant | BADHDUFLAG | Total packets | Discarded packets |
| A | 0 | 106 | 0 |
| B | 0 | 106 | 0 |
| C | 0 | 106 | 0 |
| D | 0 | 106 | 0 |
| Quadrant | Total seconds | Saturated seconds | Saturation percentage |
|---|---|---|---|
| A | 64517 | 821 | 1.272533% |
| B | 64517 | 902 | 1.398081% |
| C | 64517 | 3244 | 5.028132% |
| D | 64517 | 927 | 1.436831% |
Noise dominated data is calculated using 1-second bins in cleaned event files. If a bin has >2000 counts, and if more than 50% of those come from <1% of pixels, then it is considered to be noise-dominated and hence unusable.
| Quadrant | # 1 sec bins | Bins with >0 counts | Bins with >2000 counts | High rate bins dominated by noise | Noise dominated (total time) | Noise dominated (detector-on time) | Marked lightcurve |
|---|---|---|---|---|---|---|---|
| A | 74947 | 64517 | 0 | 0 | 0.00% | 0.00% |  |
| B | 74946 | 64514 | 0 | 0 | 0.00% | 0.00% |  |
| C | 74946 | 64389 | 0 | 0 | 0.00% | 0.00% |  |
| D | 74947 | 64514 | 0 | 0 | 0.00% | 0.00% |  |
Top three noisy pixels from each quadrant. If the there are fewer than three noisy pixels in the level2.evt file, extra rows are filled as -1
| Pixel properties | Quadrant properties | ||||||
|---|---|---|---|---|---|---|---|
| Quadrant | DetID | PixID | Counts | Sigma | Mean | Median | Sigma |
| A | 14 | 188 | 3526 | 11.26 | 916 | 854 | 237.4 |
| A | 0 | 29 | 3445 | 10.91 | 916 | 854 | 237.4 |
| A | 7 | 110 | 3066 | 9.32 | 916 | 854 | 237.4 |
| B | 2 | 9 | 3004 | 11.58 | 900 | 853 | 185.7 |
| B | 12 | 226 | 2405 | 8.36 | 900 | 853 | 185.7 |
| B | 14 | 254 | 2361 | 8.12 | 900 | 853 | 185.7 |
| C | 1 | 81 | 2430 | 6.53 | 901 | 830 | 244.9 |
| C | 1 | 80 | 2412 | 6.46 | 901 | 830 | 244.9 |
| C | 9 | 188 | 2309 | 6.04 | 901 | 830 | 244.9 |
| D | 6 | 231 | 2355 | 6.75 | 862 | 780 | 233.2 |
| D | 3 | 14 | 2263 | 6.36 | 862 | 780 | 233.2 |
| D | 1 | 19 | 2195 | 6.07 | 862 | 780 | 233.2 |
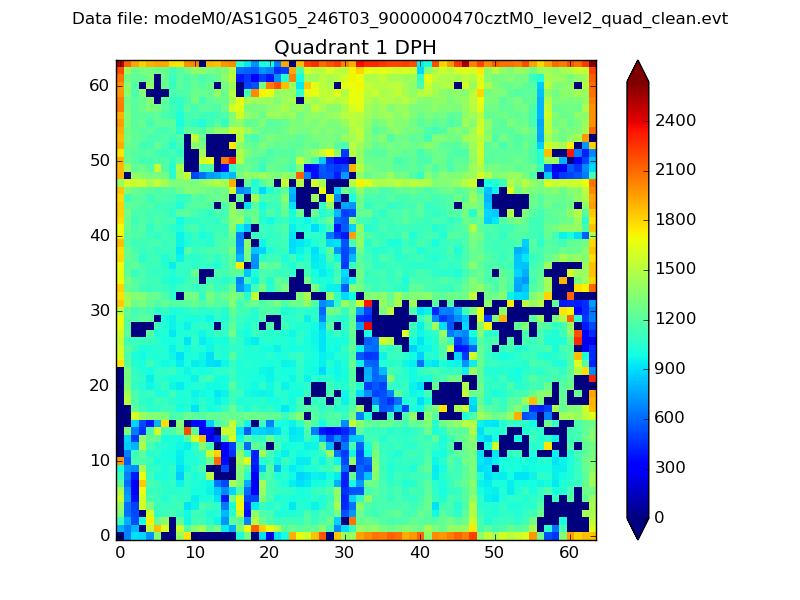
Histogram calculated using DETX and DETY for each event in the final _common_clean file
| Quadrant A |  |
 |
Quadrant B |
|---|---|---|---|
| Quadrant D |  |
 |
Quadrant C |
| Plot type | Count rate plots | Images |
|---|---|---|
| Comparison with Poisson distribution Blue bars denote a histogram of data divided into 1 sec bins. Red curve is a Poisson curve with rate = median count rate of data. |
 |
 |
| Quadrant-wise count rates Data is divided into 100 sec bins |
 |
|
| Module-wise count rates for Quadrant A Data is divided into 100 sec bins |
 |
 |
| Module-wise count rates for Quadrant B Data is divided into 100 sec bins |
 |
 |
| Module-wise count rates for Quadrant C Data is divided into 100 sec bins |
 |
 |
| Module-wise count rates for Quadrant D Data is divided into 100 sec bins |
 |
 |
| Parameter | Plot |
|---|---|
| CZT HV Monitor | 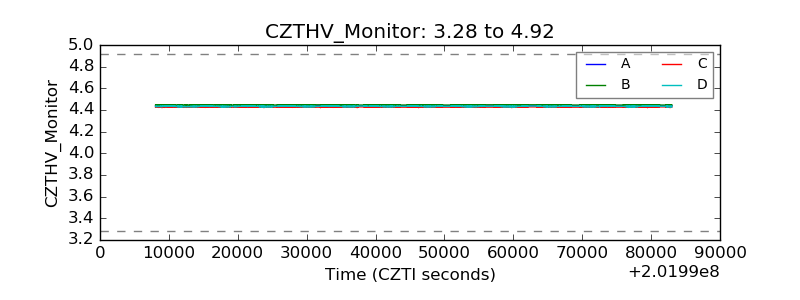 |
| D_VDD |  |
| Temperature 1 |  |
| Veto HV Monitor |  |
| Veto LLD |  |
| Alpha Counter | 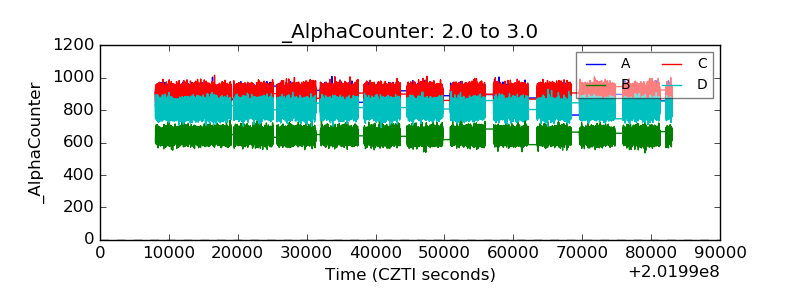 |
| _CPM_Rate |  |
| CZT Counter |  |
| +2.5 Volts monitor |  |
| +5 Volts monitor |  |
| _ROLL_ROT |  |
| _Roll_DEC | 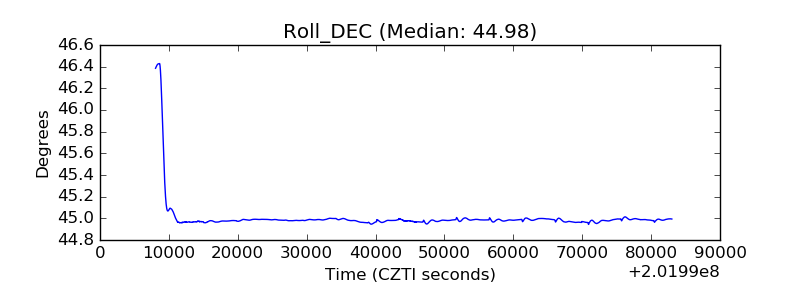 |
| _Roll_RA | 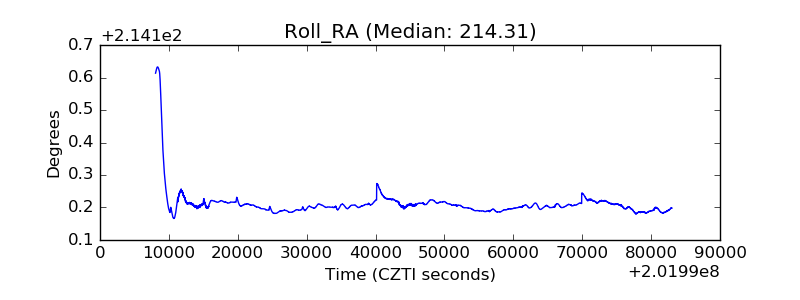 |
| Veto Counter | 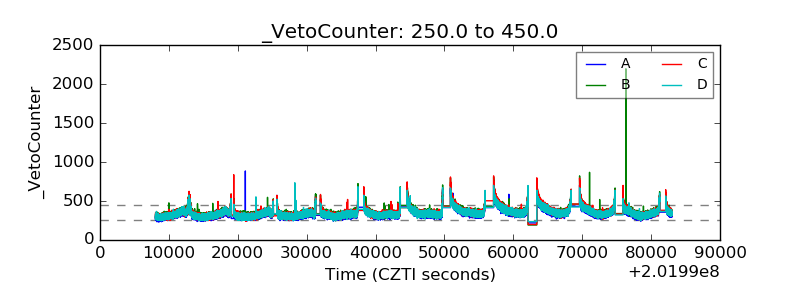 |