| Param | Original file | Final file |
|---|---|---|
| Filename | modeM0/AS1G05_246T03_9000000470_03579cztM0_level2.evt | modeM0/AS1G05_246T03_9000000470_03579cztM0_level2_quad_clean.evt |
| Size (bytes) | 16,882,560 | 2,848,320 |
| Size | 16.1 MB | 2.7 MB |
| Events in quadrant A | 109,408 | 14,118 |
| Events in quadrant B | 135,884 | 14,168 |
| Events in quadrant C | 113,682 | 14,592 |
| Events in quadrant D | 128,688 | 14,114 |
| Mode SS | |||
|---|---|---|---|
| Quadrant | BADHDUFLAG | Total packets | Discarded packets |
| A | 0 | 6 | 0 |
| B | 0 | 6 | 0 |
| C | 0 | 6 | 0 |
| D | 0 | 6 | 0 |
| Mode M0 | |||
|---|---|---|---|
| Quadrant | BADHDUFLAG | Total packets | Discarded packets |
| A | 0 | 581 | 1 |
| B | 0 | 599 | 0 |
| C | 0 | 581 | 0 |
| D | 0 | 624 | 0 |
| Quadrant | Total seconds | Saturated seconds | Saturation percentage |
|---|---|---|---|
| A | 291 | 0 | 0.000000% |
| B | 291 | 0 | 0.000000% |
| C | 291 | 0 | 0.000000% |
| D | 291 | 2 | 0.687285% |
Noise dominated data is calculated using 1-second bins in cleaned event files. If a bin has >2000 counts, and if more than 50% of those come from <1% of pixels, then it is considered to be noise-dominated and hence unusable.
| Quadrant | # 1 sec bins | Bins with >0 counts | Bins with >2000 counts | High rate bins dominated by noise | Noise dominated (total time) | Noise dominated (detector-on time) | Marked lightcurve |
|---|---|---|---|---|---|---|---|
| A | 291 | 291 | 0 | 0 | 0.00% | 0.00% | 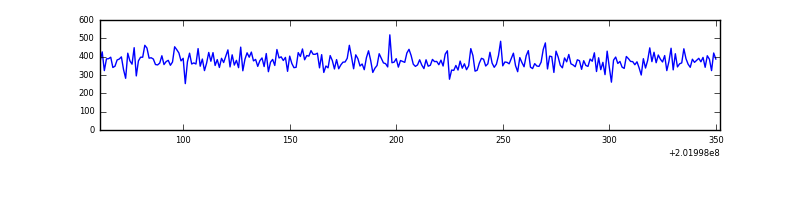 |
| B | 291 | 291 | 0 | 0 | 0.00% | 0.00% |  |
| C | 291 | 291 | 0 | 0 | 0.00% | 0.00% | 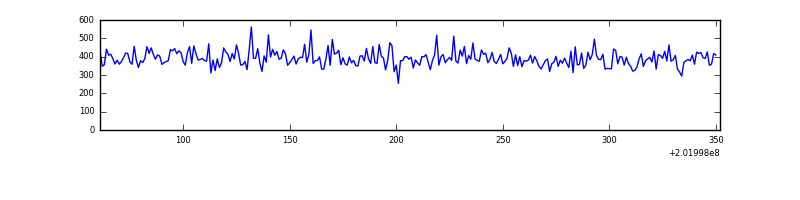 |
| D | 291 | 291 | 2 | 2 | 0.69% | 0.69% |  |
Top three noisy pixels from each quadrant. If the there are fewer than three noisy pixels in the level2.evt file, extra rows are filled as -1
| Pixel properties | Quadrant properties | ||||||
|---|---|---|---|---|---|---|---|
| Quadrant | DetID | PixID | Counts | Sigma | Mean | Median | Sigma |
| A | 0 | 226 | 290 | 33.44 | 28 | 27 | 7.9 |
| A | 12 | 194 | 275 | 31.53 | 28 | 27 | 7.9 |
| A | 3 | 1 | 226 | 25.3 | 28 | 27 | 7.9 |
| B | 15 | 204 | 15929 | 2009.4 | 29 | 28 | 7.9 |
| B | 4 | 81 | 3359 | 420.94 | 29 | 28 | 7.9 |
| B | 10 | 246 | 2448 | 305.81 | 29 | 28 | 7.9 |
| C | 8 | 128 | 863 | 98.87 | 28 | 28 | 8.4 |
| C | 8 | 112 | 354 | 38.6 | 28 | 28 | 8.4 |
| C | 8 | 144 | 311 | 33.51 | 28 | 28 | 8.4 |
| D | 13 | 223 | 15108 | 1711.22 | 27 | 26 | 8.8 |
| D | 14 | 34 | 5246 | 592.27 | 27 | 26 | 8.8 |
| D | 5 | 233 | 2676 | 300.67 | 27 | 26 | 8.8 |
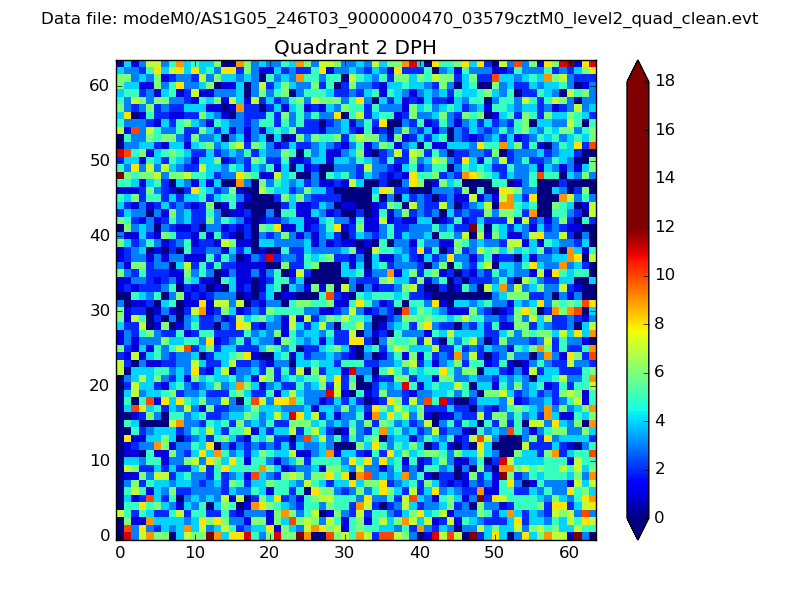
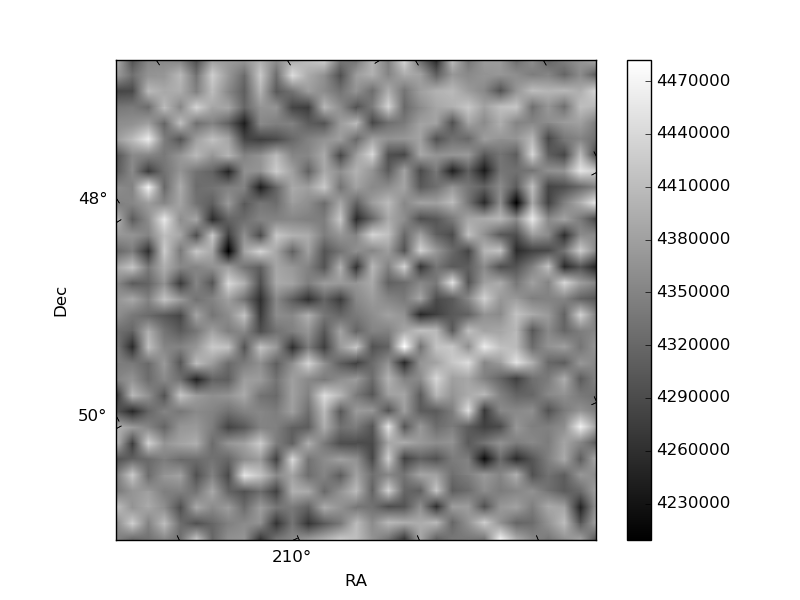
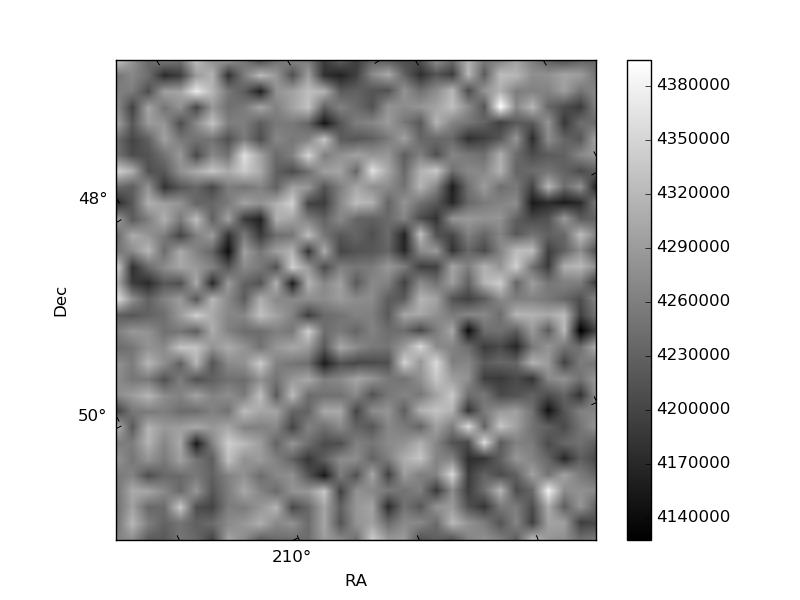
Histogram calculated using DETX and DETY for each event in the final _common_clean file
| Quadrant A | 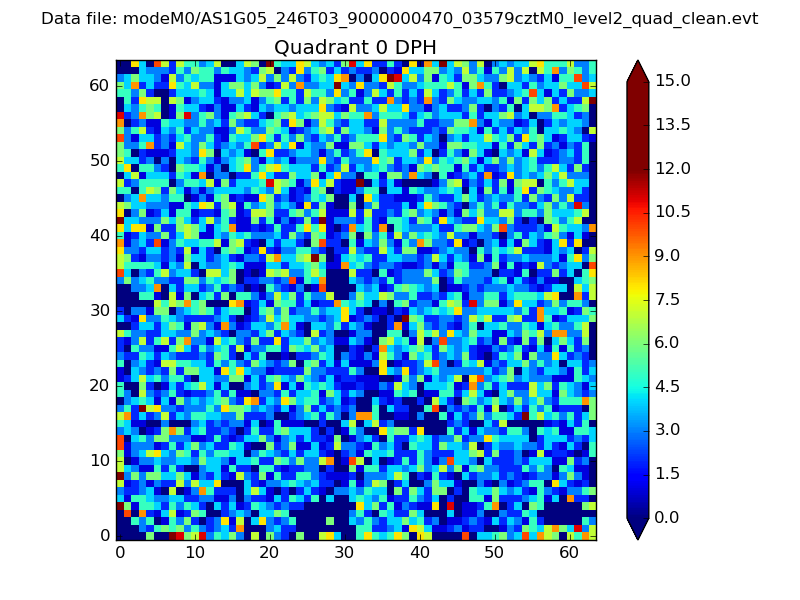 |
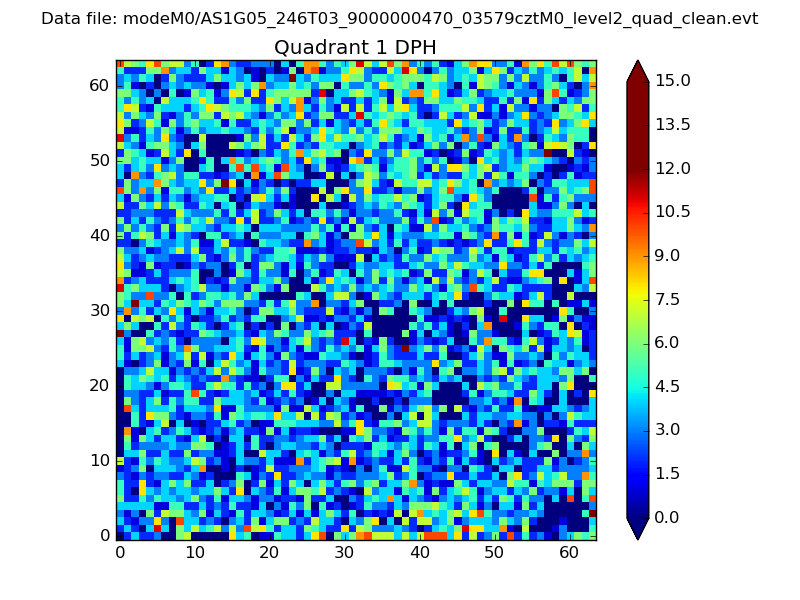 |
Quadrant B |
|---|---|---|---|
| Quadrant D |  |
 |
Quadrant C |
| Plot type | Count rate plots | Images |
|---|---|---|
| Comparison with Poisson distribution Blue bars denote a histogram of data divided into 1 sec bins. Red curve is a Poisson curve with rate = median count rate of data. |
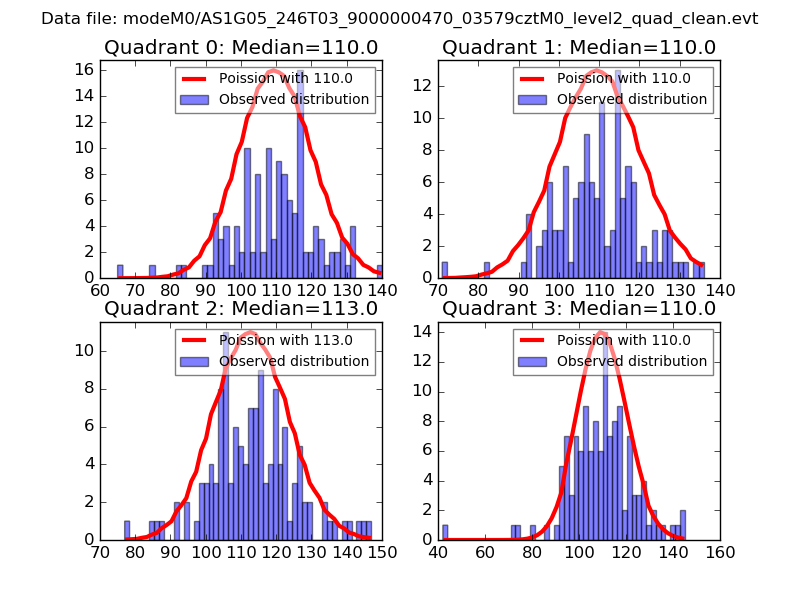 |
 |
| Quadrant-wise count rates Data is divided into 100 sec bins |
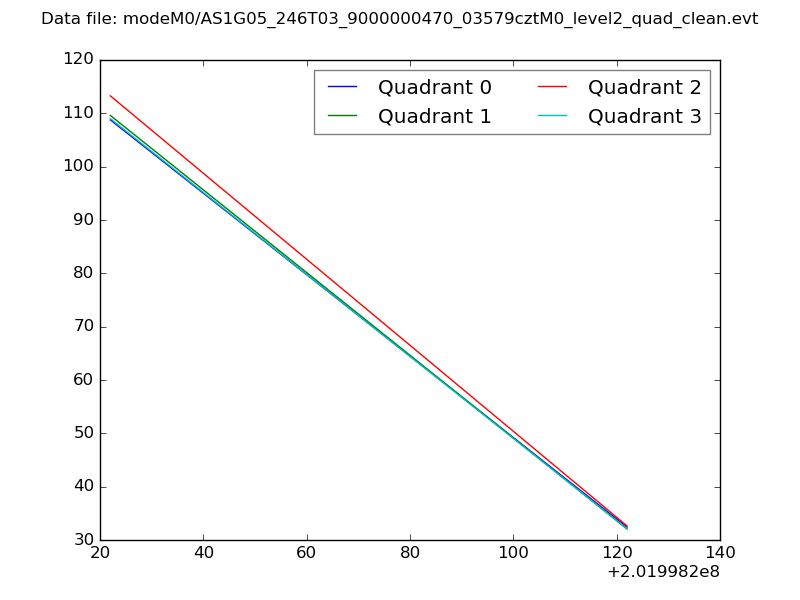 |
|
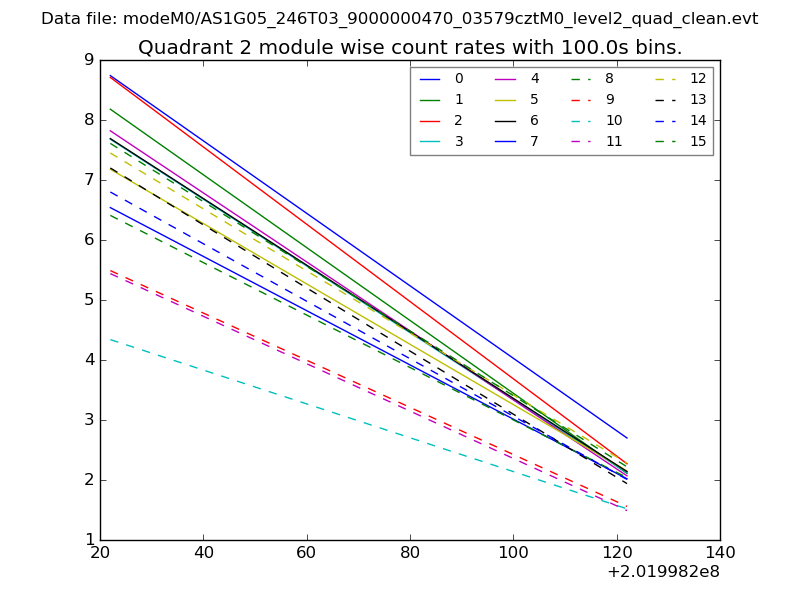
| Module-wise count rates for Quadrant A Data is divided into 100 sec bins |
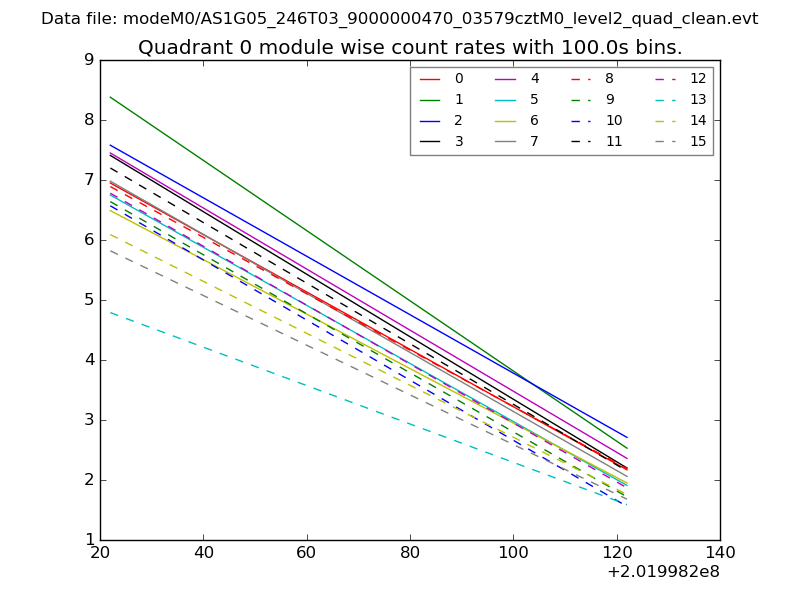 |
 |
| Module-wise count rates for Quadrant B Data is divided into 100 sec bins |
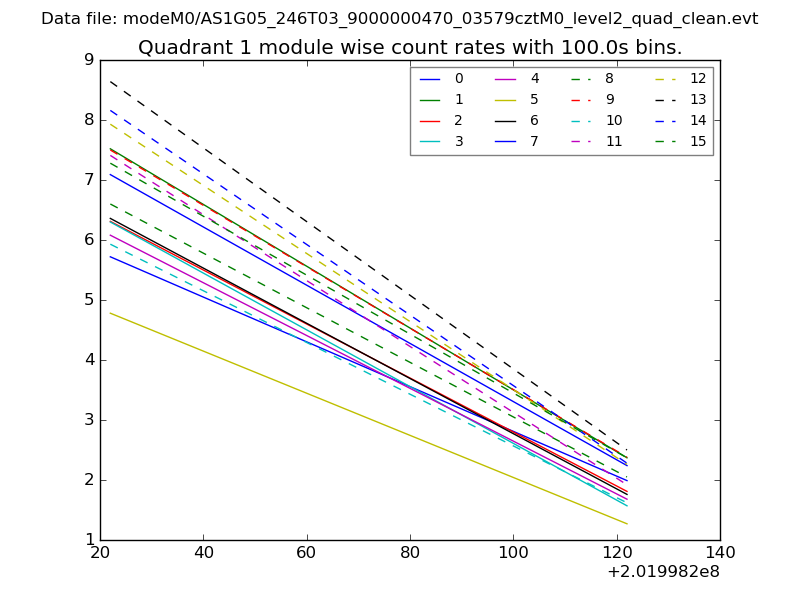 |
 |
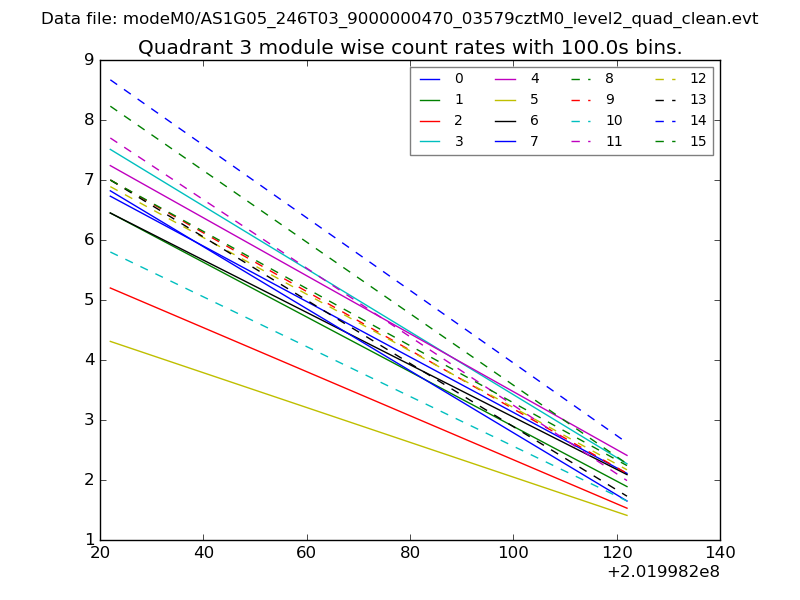
| Module-wise count rates for Quadrant C Data is divided into 100 sec bins |
 |
 |
| Module-wise count rates for Quadrant D Data is divided into 100 sec bins |
 |
 |
| Parameter | Plot |
|---|---|
| CZT HV Monitor | 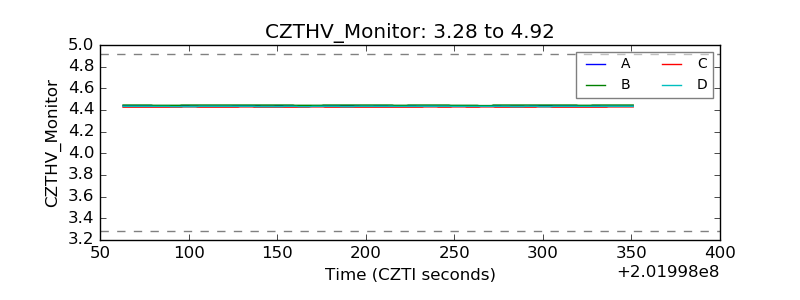 |
| D_VDD | 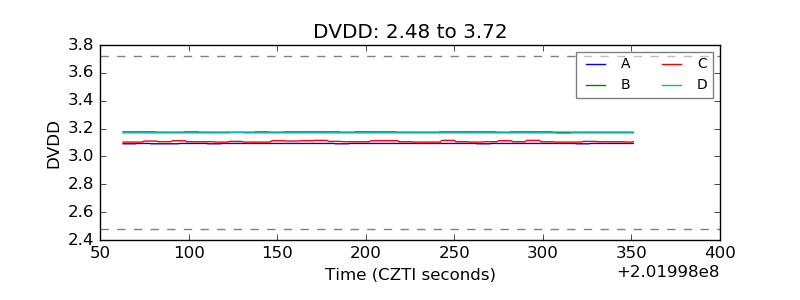 |
| Temperature 1 |  |
| Veto HV Monitor | 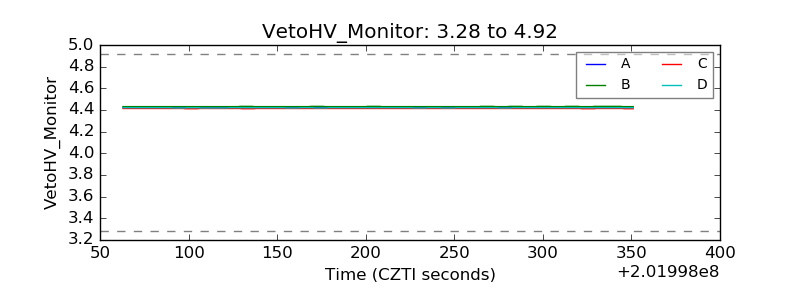 |
| Veto LLD |  |
| Alpha Counter | 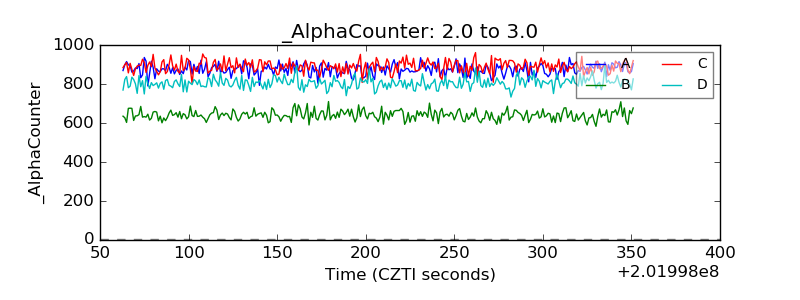 |
| _CPM_Rate | 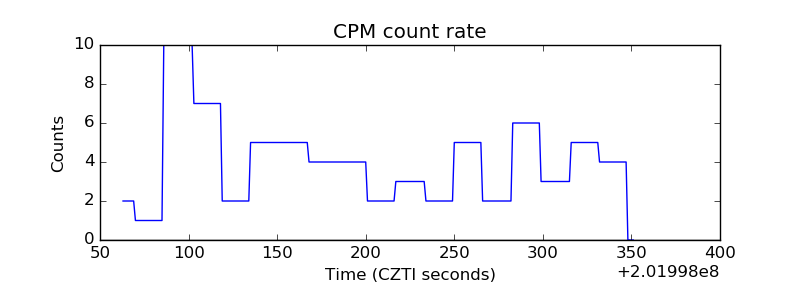 |
| CZT Counter | 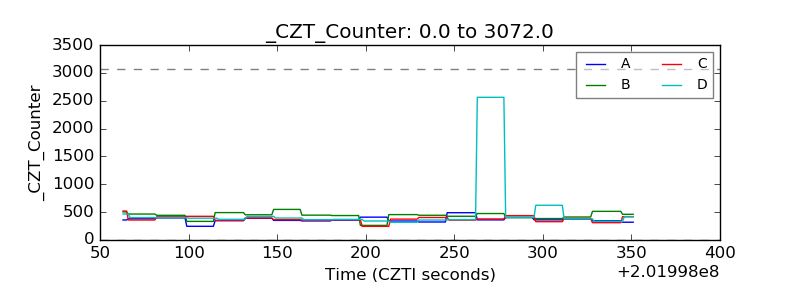 |
| +2.5 Volts monitor |  |
| +5 Volts monitor |  |
| _ROLL_ROT | 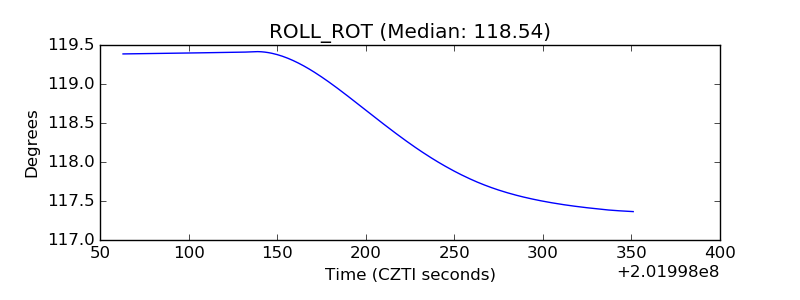 |
| _Roll_DEC | 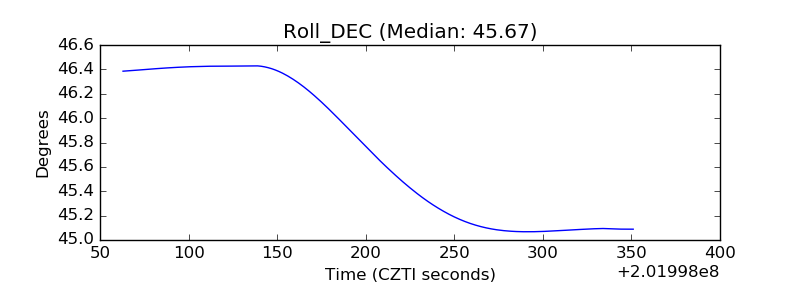 |
| _Roll_RA | 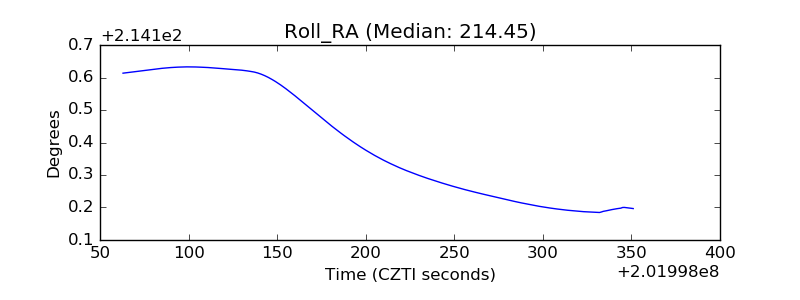 |
| Veto Counter | 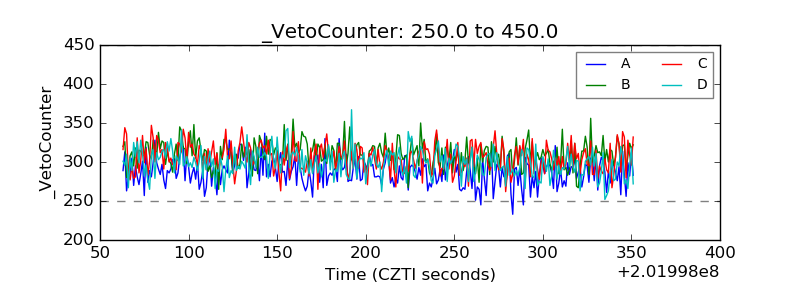 |