| Param | Original file | Final file |
|---|---|---|
| Filename | modeM0/AS1G05_246T03_9000000470_03580cztM0_level2.evt | modeM0/AS1G05_246T03_9000000470_03580cztM0_level2_quad_clean.evt |
| Size (bytes) | 405,809,280 | 79,994,880 |
| Size | 387.0 MB | 76.3 MB |
| Events in quadrant A | 2,886,018 | 493,583 |
| Events in quadrant B | 3,165,368 | 498,324 |
| Events in quadrant C | 2,867,467 | 500,749 |
| Events in quadrant D | 2,933,563 | 481,234 |
| Mode SS | |||
|---|---|---|---|
| Quadrant | BADHDUFLAG | Total packets | Discarded packets |
| A | 0 | 132 | 0 |
| B | 0 | 132 | 0 |
| C | 0 | 132 | 0 |
| D | 0 | 132 | 0 |
| Mode M0 | |||
|---|---|---|---|
| Quadrant | BADHDUFLAG | Total packets | Discarded packets |
| A | 0 | 13280 | 2 |
| B | 0 | 13901 | 1 |
| C | 0 | 13301 | 1 |
| D | 0 | 13736 | 1 |
| Mode M9 | |||
|---|---|---|---|
| Quadrant | BADHDUFLAG | Total packets | Discarded packets |
| A | 0 | 2 | 0 |
| B | 0 | 2 | 0 |
| C | 0 | 2 | 0 |
| D | 0 | 2 | 0 |
| Quadrant | Total seconds | Saturated seconds | Saturation percentage |
|---|---|---|---|
| A | 6431 | 65 | 1.010729% |
| B | 6431 | 86 | 1.337273% |
| C | 6431 | 40 | 0.621987% |
| D | 6431 | 65 | 1.010729% |
Noise dominated data is calculated using 1-second bins in cleaned event files. If a bin has >2000 counts, and if more than 50% of those come from <1% of pixels, then it is considered to be noise-dominated and hence unusable.
| Quadrant | # 1 sec bins | Bins with >0 counts | Bins with >2000 counts | High rate bins dominated by noise | Noise dominated (total time) | Noise dominated (detector-on time) | Marked lightcurve |
|---|---|---|---|---|---|---|---|
| A | 6556 | 6433 | 0 | 0 | 0.00% | 0.00% | 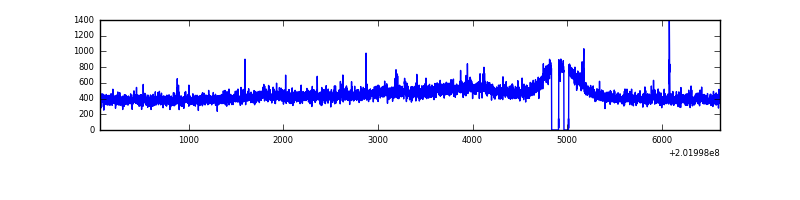 |
| B | 6556 | 6433 | 1 | 1 | 0.02% | 0.02% | 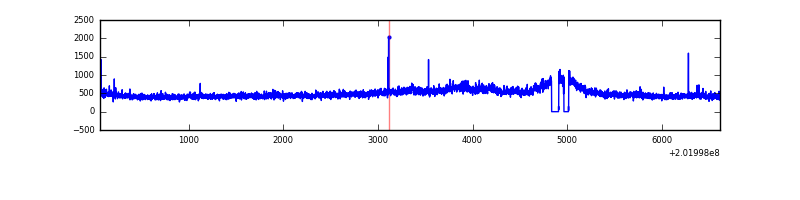 |
| C | 6556 | 6433 | 0 | 0 | 0.00% | 0.00% | 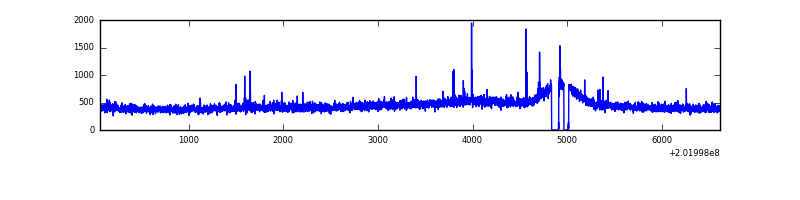 |
| D | 6556 | 6433 | 40 | 40 | 0.61% | 0.62% | 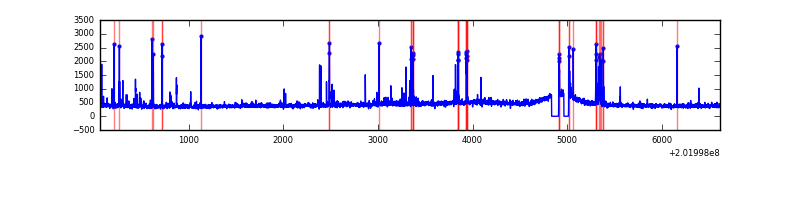 |
Top three noisy pixels from each quadrant. If the there are fewer than three noisy pixels in the level2.evt file, extra rows are filled as -1
| Pixel properties | Quadrant properties | ||||||
|---|---|---|---|---|---|---|---|
| Quadrant | DetID | PixID | Counts | Sigma | Mean | Median | Sigma |
| A | 0 | 118 | 32290 | 210.49 | 728 | 712 | 150.0 |
| A | 3 | 1 | 18784 | 120.46 | 728 | 712 | 150.0 |
| A | 0 | 226 | 10429 | 64.77 | 728 | 712 | 150.0 |
| B | 15 | 204 | 243046 | 1658.58 | 741 | 722 | 146.1 |
| B | 0 | 183 | 17334 | 113.7 | 741 | 722 | 146.1 |
| B | 0 | 228 | 14786 | 96.26 | 741 | 722 | 146.1 |
| C | 1 | 16 | 25247 | 145.35 | 716 | 719 | 168.8 |
| C | 8 | 128 | 20344 | 116.3 | 716 | 719 | 168.8 |
| C | 8 | 112 | 9039 | 49.3 | 716 | 719 | 168.8 |
| D | 13 | 223 | 96788 | 557.5 | 707 | 684 | 172.4 |
| D | 14 | 34 | 63526 | 364.54 | 707 | 684 | 172.4 |
| D | 12 | 219 | 23498 | 132.34 | 707 | 684 | 172.4 |
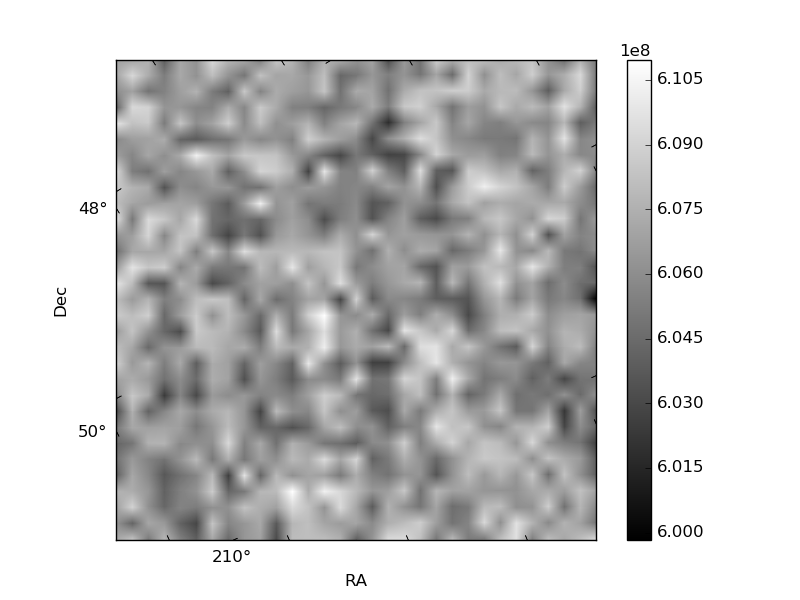
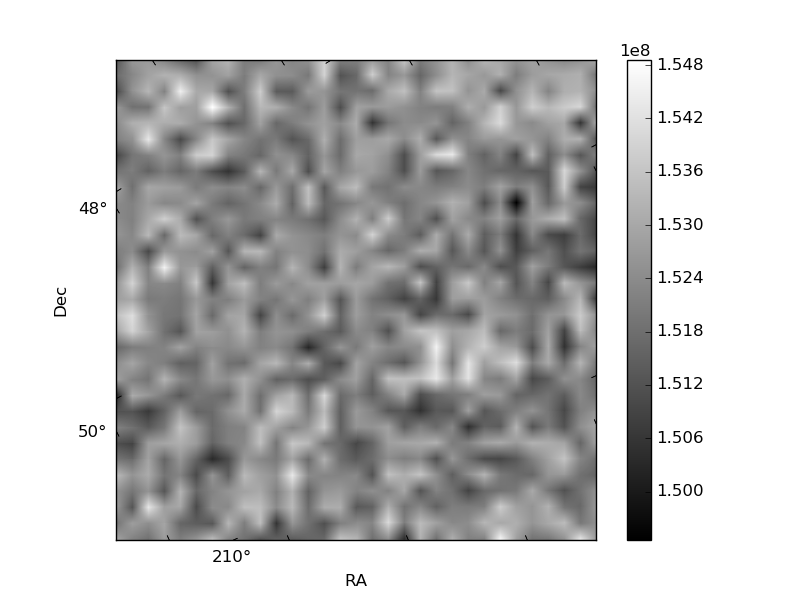
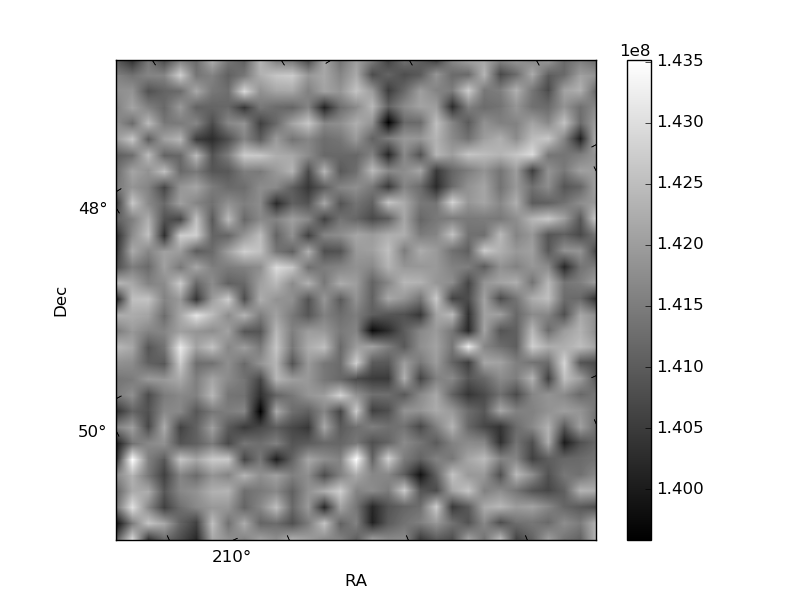
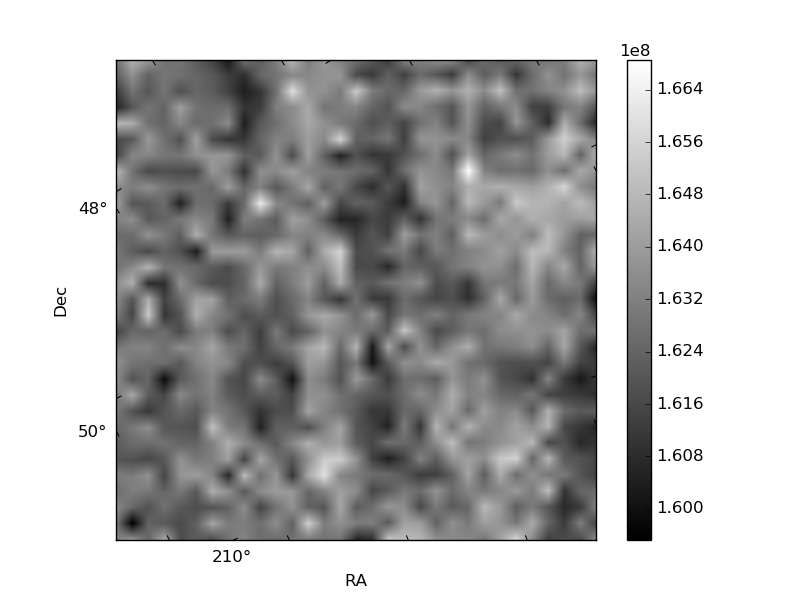
Histogram calculated using DETX and DETY for each event in the final _common_clean file
| Quadrant A | 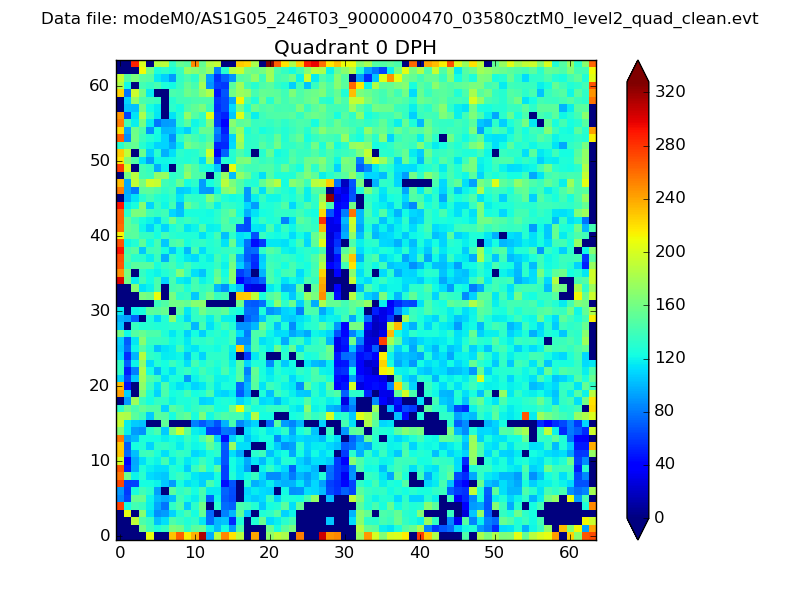 |
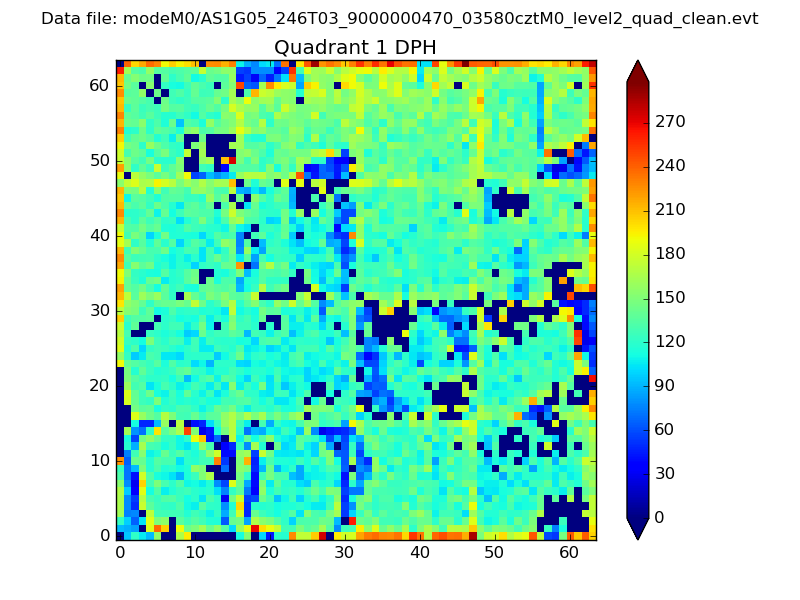 |
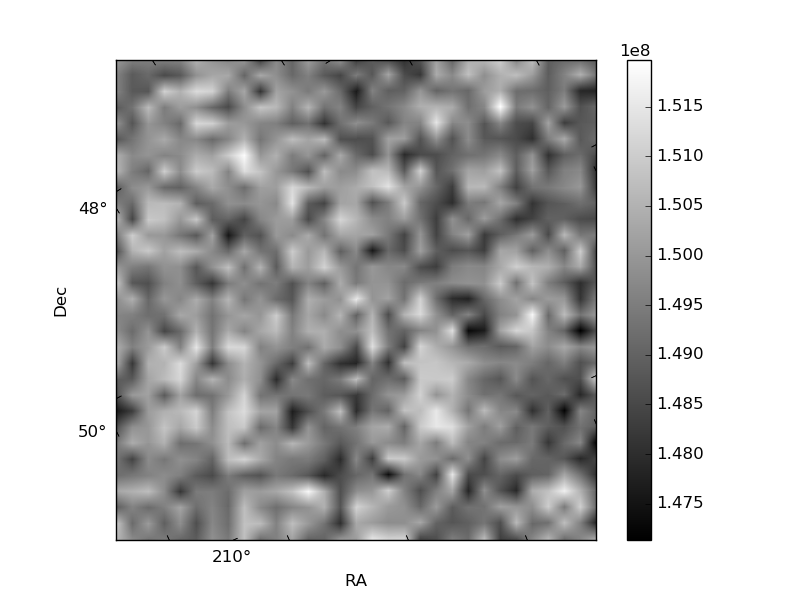
Quadrant B |
|---|---|---|---|
| Quadrant D | 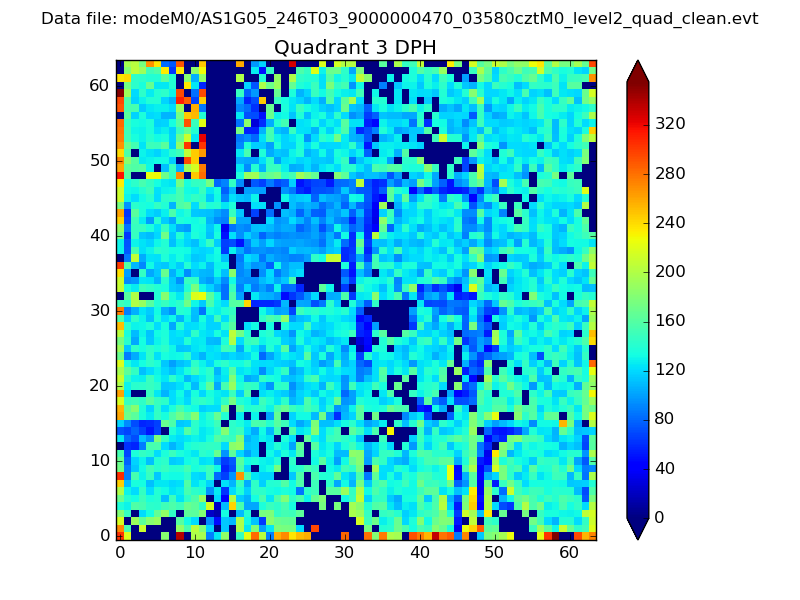 |
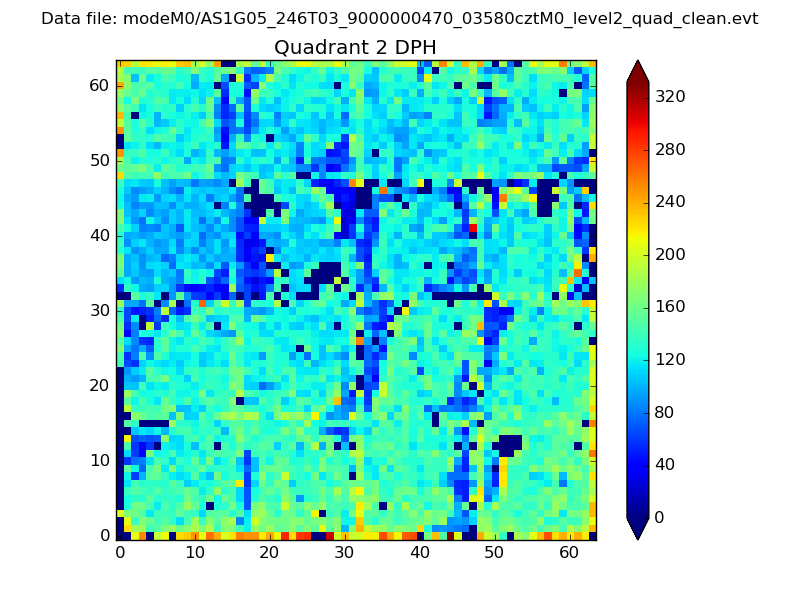 |
Quadrant C |
| Plot type | Count rate plots | Images |
|---|---|---|
| Comparison with Poisson distribution Blue bars denote a histogram of data divided into 1 sec bins. Red curve is a Poisson curve with rate = median count rate of data. |
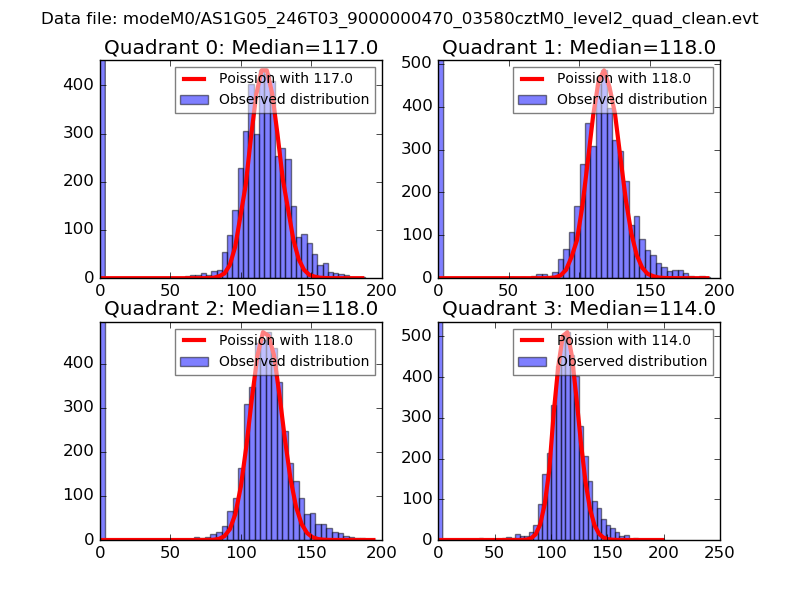 |
 |
| Quadrant-wise count rates Data is divided into 100 sec bins |
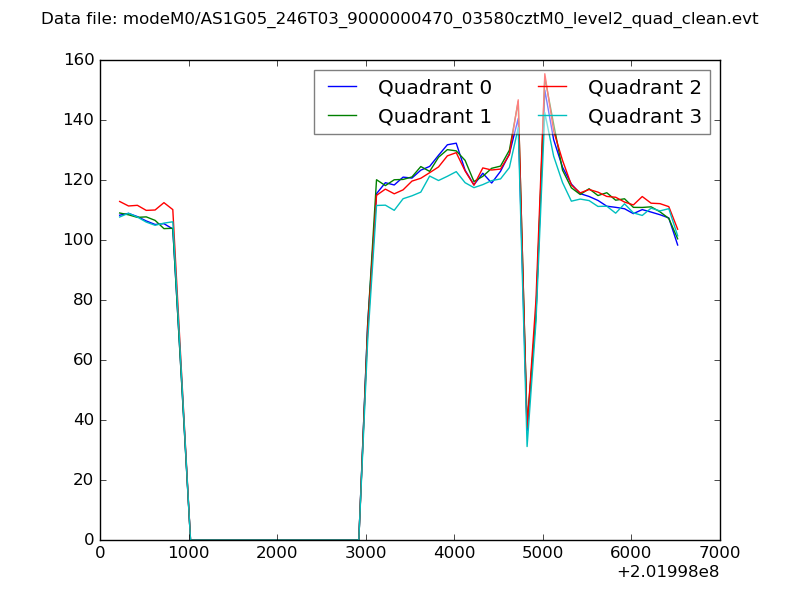 |
|
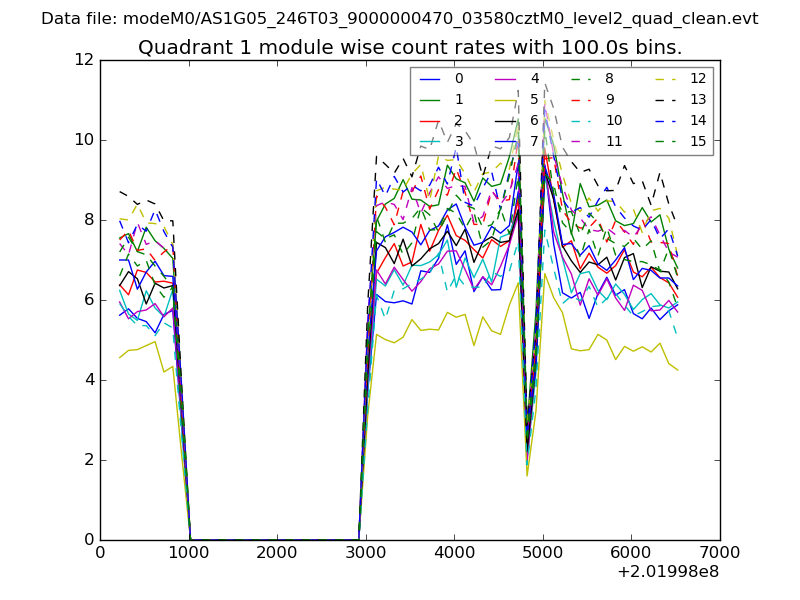
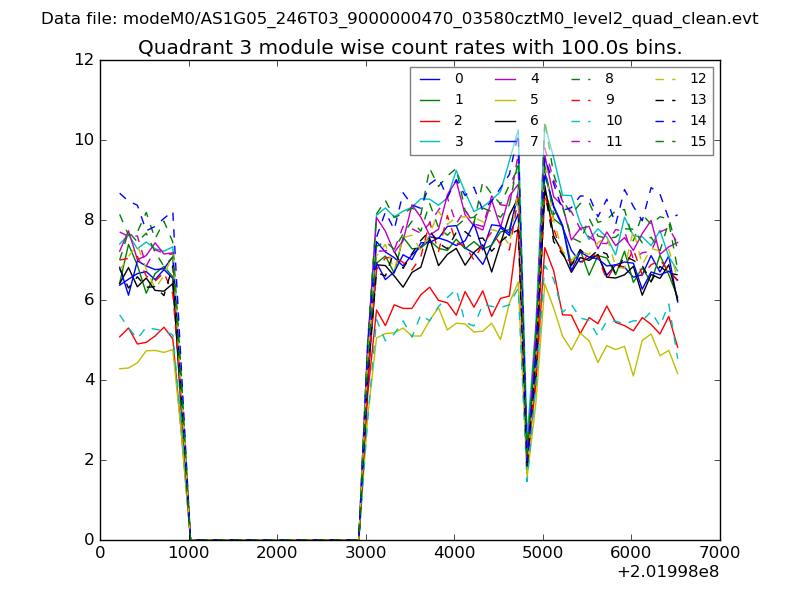
| Module-wise count rates for Quadrant A Data is divided into 100 sec bins |
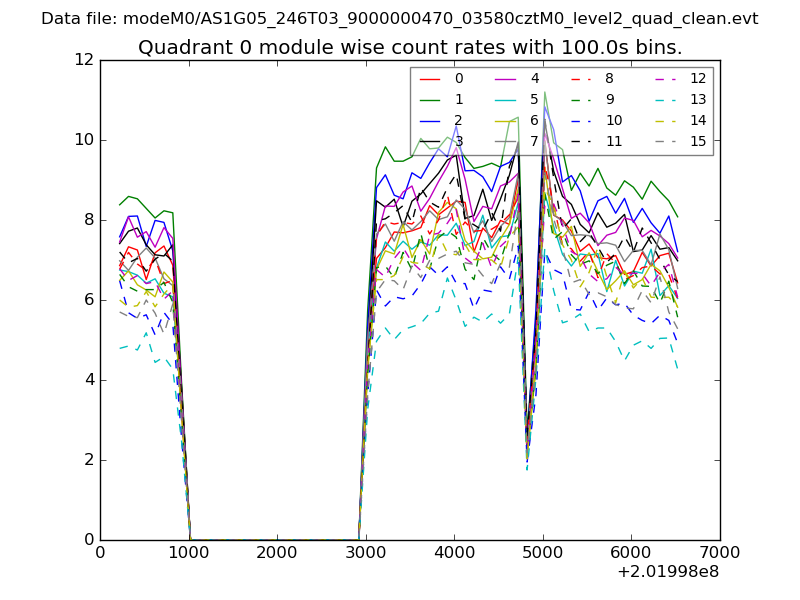 |
 |
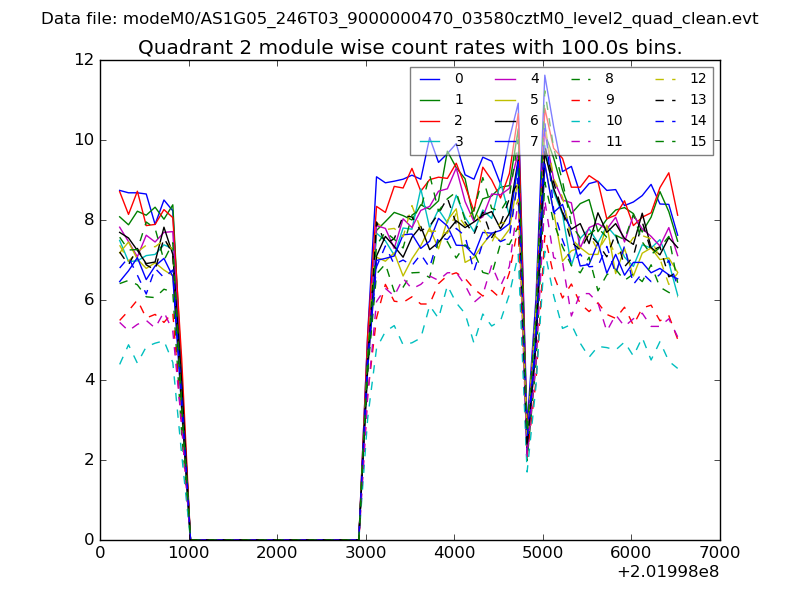
| Module-wise count rates for Quadrant B Data is divided into 100 sec bins |
 |
 |
| Module-wise count rates for Quadrant C Data is divided into 100 sec bins |
 |
 |
| Module-wise count rates for Quadrant D Data is divided into 100 sec bins |
 |
 |
| Parameter | Plot |
|---|---|
| CZT HV Monitor | 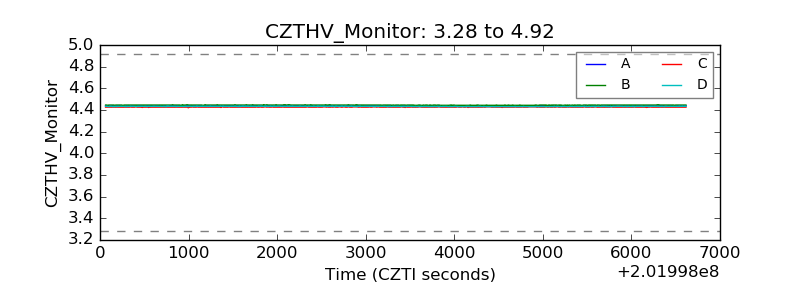 |
| D_VDD | 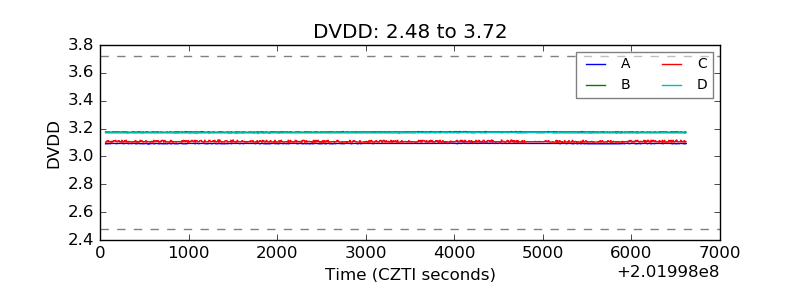 |
| Temperature 1 | 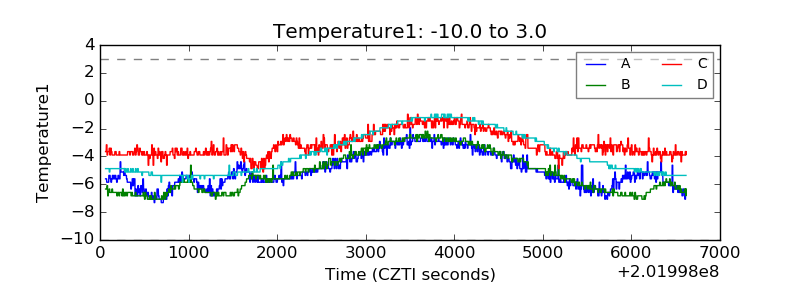 |
| Veto HV Monitor | 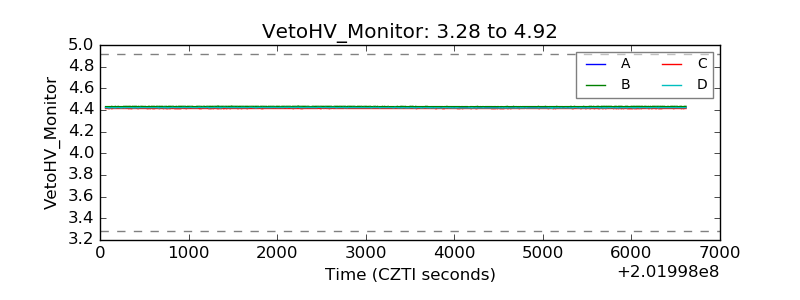 |
| Veto LLD | 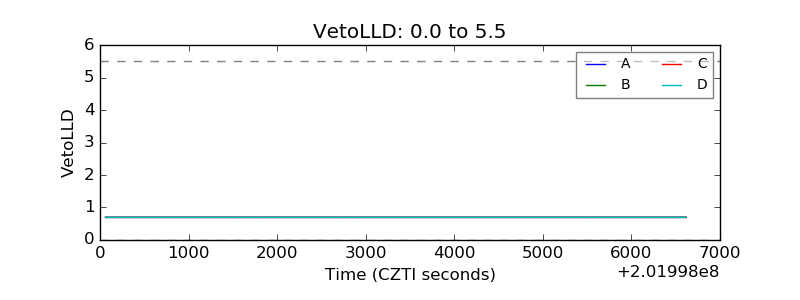 |
| Alpha Counter | 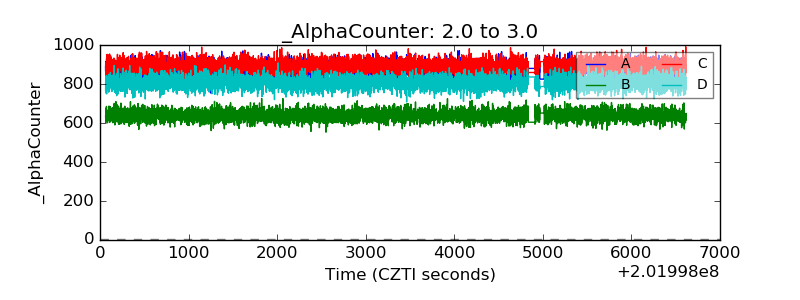 |
| _CPM_Rate | 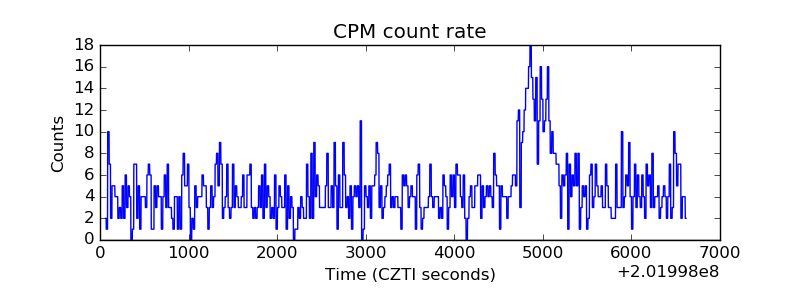 |
| CZT Counter | 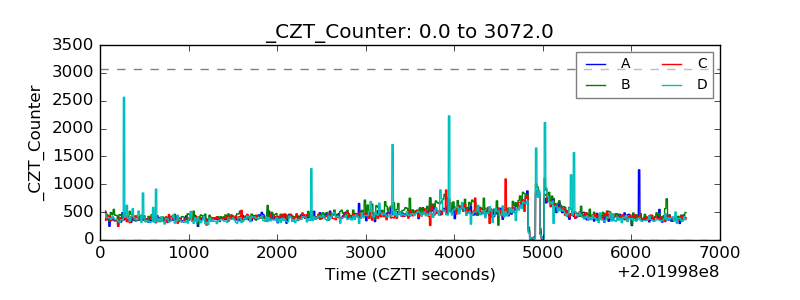 |
| +2.5 Volts monitor |  |
| +5 Volts monitor | 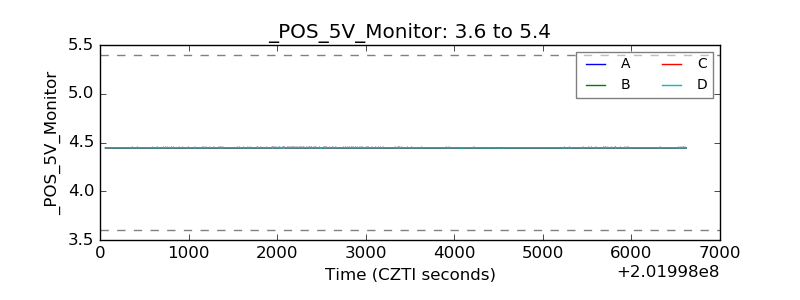 |
| _ROLL_ROT | 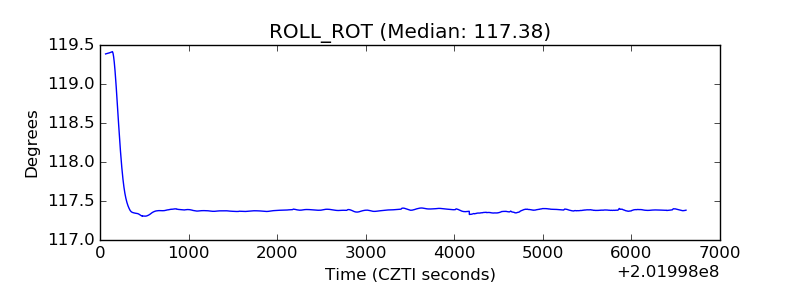 |
| _Roll_DEC | 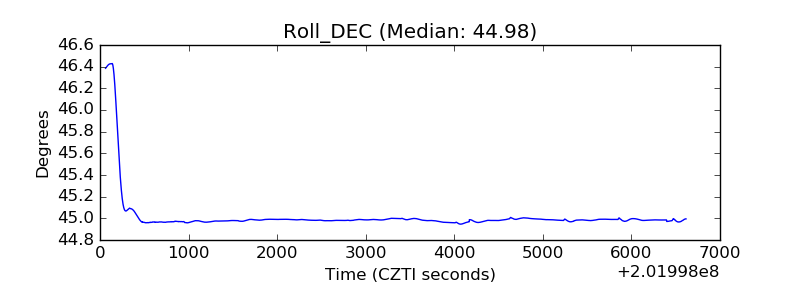 |
| _Roll_RA | 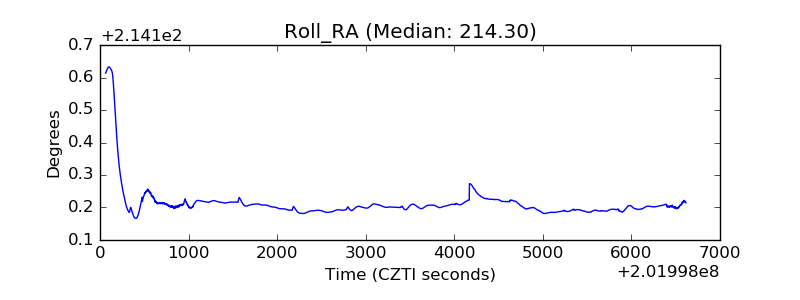 |
| Veto Counter | 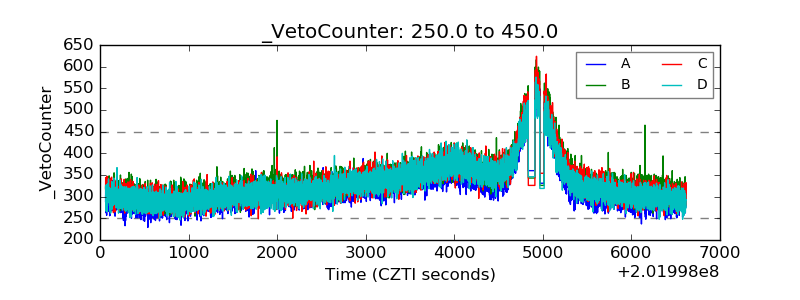 |