| Param | Original file | Final file |
|---|---|---|
| Filename | modeM0/AS1G05_246T03_9000000470_03584cztM0_level2.evt | modeM0/AS1G05_246T03_9000000470_03584cztM0_level2_quad_clean.evt |
| Size (bytes) | 515,090,880 | 80,801,280 |
| Size | 491.2 MB | 77.1 MB |
| Events in quadrant A | 3,436,816 | 481,338 |
| Events in quadrant B | 3,820,114 | 487,985 |
| Events in quadrant C | 4,175,050 | 479,364 |
| Events in quadrant D | 3,653,131 | 471,163 |
| Mode SS | |||
|---|---|---|---|
| Quadrant | BADHDUFLAG | Total packets | Discarded packets |
| A | 0 | 156 | 0 |
| B | 0 | 156 | 0 |
| C | 0 | 156 | 0 |
| D | 0 | 156 | 0 |
| Mode M0 | |||
|---|---|---|---|
| Quadrant | BADHDUFLAG | Total packets | Discarded packets |
| A | 0 | 15467 | 3 |
| B | 0 | 15999 | 2 |
| C | 0 | 17603 | 2 |
| D | 0 | 16189 | 2 |
| Mode M9 | |||
|---|---|---|---|
| Quadrant | BADHDUFLAG | Total packets | Discarded packets |
| A | 0 | 16 | 0 |
| B | 0 | 16 | 0 |
| C | 0 | 16 | 0 |
| D | 0 | 16 | 0 |
| Quadrant | Total seconds | Saturated seconds | Saturation percentage |
|---|---|---|---|
| A | 7569 | 121 | 1.598626% |
| B | 7569 | 128 | 1.691108% |
| C | 7569 | 270 | 3.567182% |
| D | 7569 | 101 | 1.334390% |
Noise dominated data is calculated using 1-second bins in cleaned event files. If a bin has >2000 counts, and if more than 50% of those come from <1% of pixels, then it is considered to be noise-dominated and hence unusable.
| Quadrant | # 1 sec bins | Bins with >0 counts | Bins with >2000 counts | High rate bins dominated by noise | Noise dominated (total time) | Noise dominated (detector-on time) | Marked lightcurve |
|---|---|---|---|---|---|---|---|
| A | 9114 | 7571 | 1 | 1 | 0.01% | 0.01% | 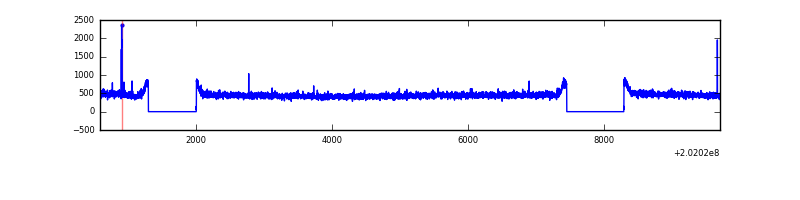 |
| B | 9114 | 7571 | 1 | 1 | 0.01% | 0.01% | 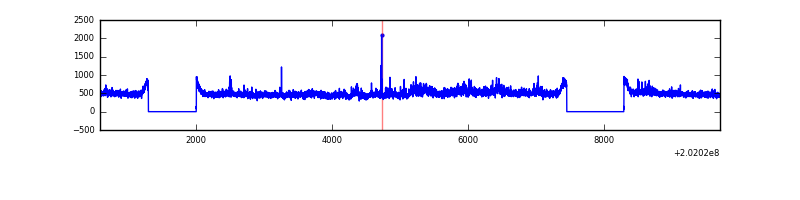 |
| C | 9114 | 7571 | 186 | 186 | 2.04% | 2.46% | 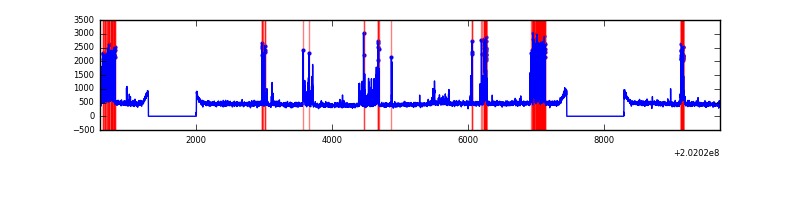 |
| D | 9114 | 7571 | 8 | 8 | 0.09% | 0.11% | 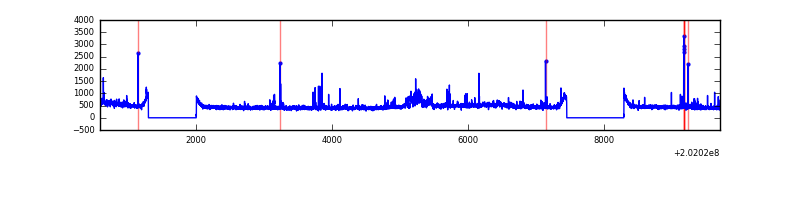 |
Top three noisy pixels from each quadrant. If the there are fewer than three noisy pixels in the level2.evt file, extra rows are filled as -1
| Pixel properties | Quadrant properties | ||||||
|---|---|---|---|---|---|---|---|
| Quadrant | DetID | PixID | Counts | Sigma | Mean | Median | Sigma |
| A | 0 | 50 | 11477 | 58.55 | 883 | 862 | 181.3 |
| A | 3 | 1 | 10865 | 55.17 | 883 | 862 | 181.3 |
| A | 0 | 226 | 9270 | 46.38 | 883 | 862 | 181.3 |
| B | 15 | 204 | 290786 | 1637.03 | 900 | 877 | 177.1 |
| B | 0 | 229 | 15812 | 84.33 | 900 | 877 | 177.1 |
| B | 12 | 111 | 14015 | 74.19 | 900 | 877 | 177.1 |
| C | 15 | 208 | 770822 | 3823.52 | 857 | 861 | 201.4 |
| C | 8 | 128 | 22000 | 104.97 | 857 | 861 | 201.4 |
| C | 8 | 112 | 9169 | 41.26 | 857 | 861 | 201.4 |
| D | 1 | 84 | 155917 | 746.9 | 857 | 831 | 207.6 |
| D | 12 | 79 | 141175 | 675.91 | 857 | 831 | 207.6 |
| D | 2 | 14 | 27447 | 128.18 | 857 | 831 | 207.6 |
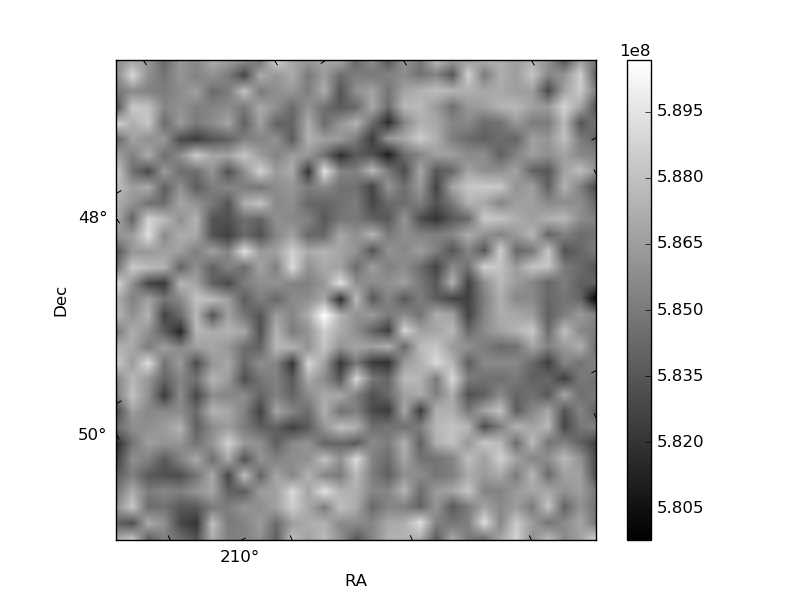
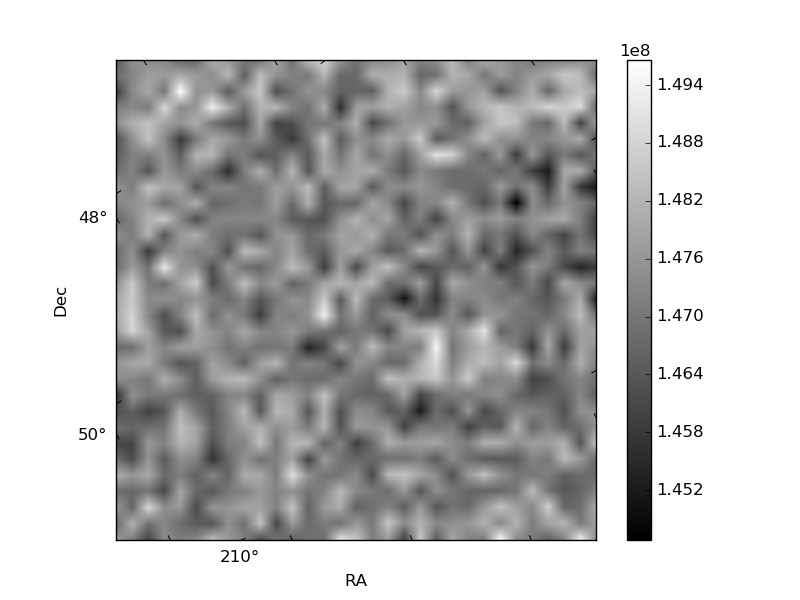
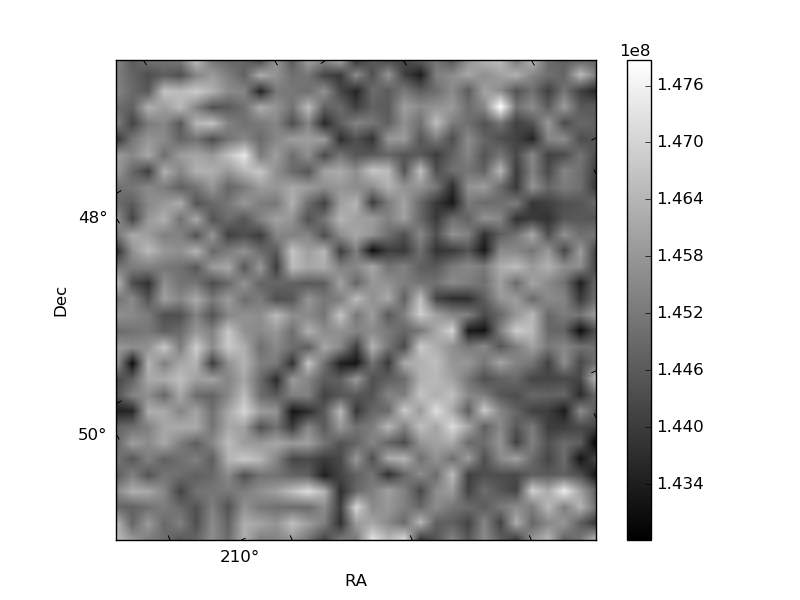
Histogram calculated using DETX and DETY for each event in the final _common_clean file
| Quadrant A | 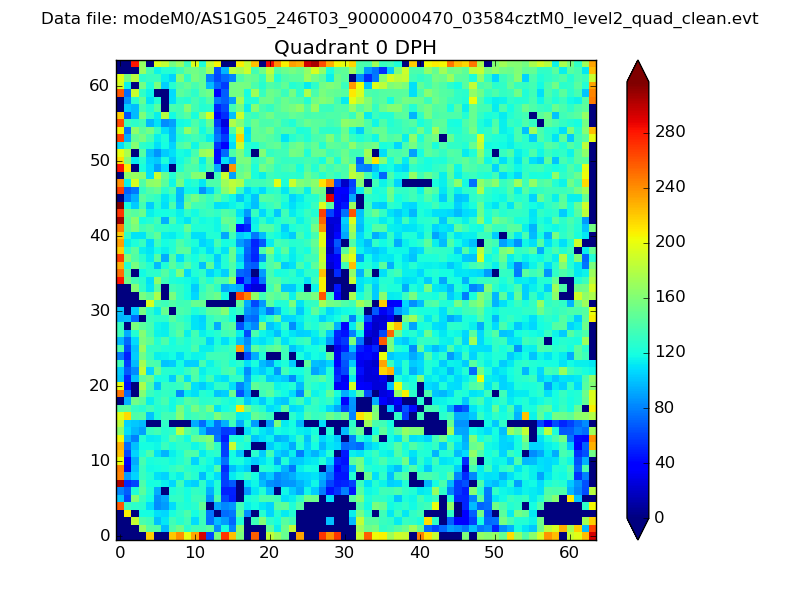 |
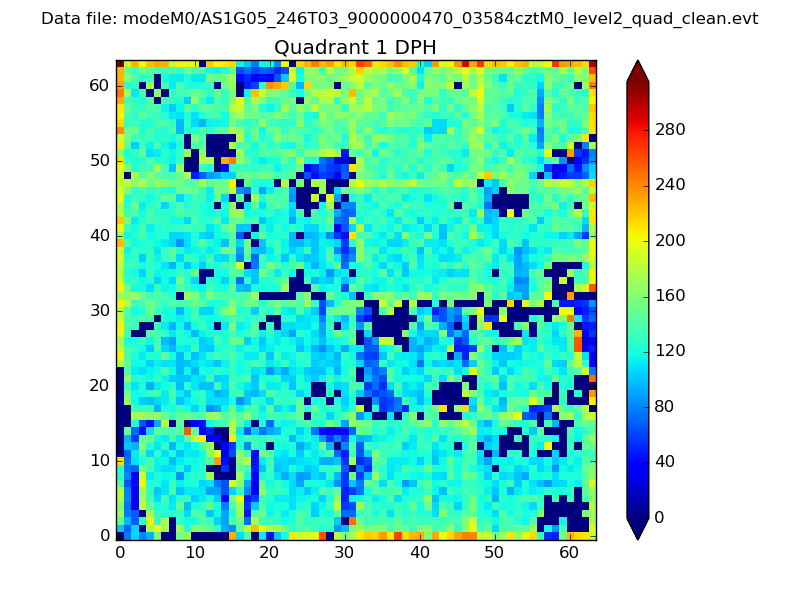 |
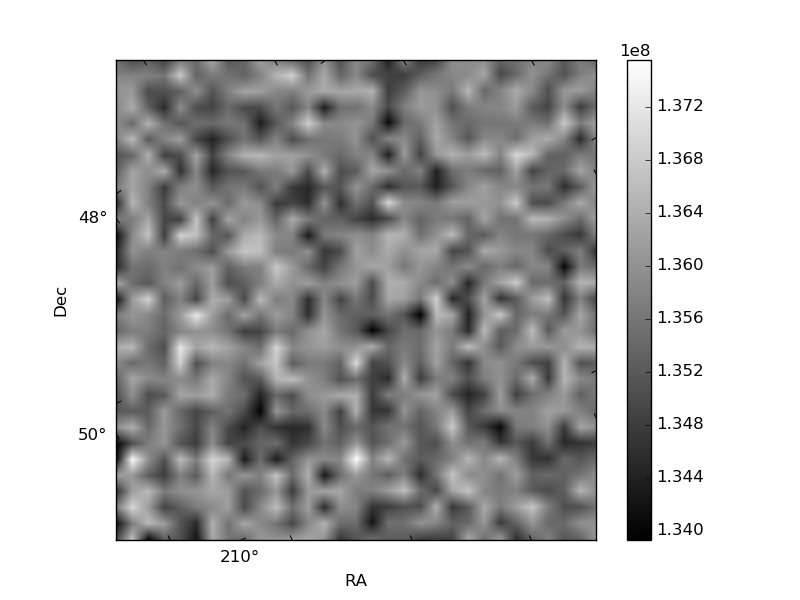
Quadrant B |
|---|---|---|---|
| Quadrant D | 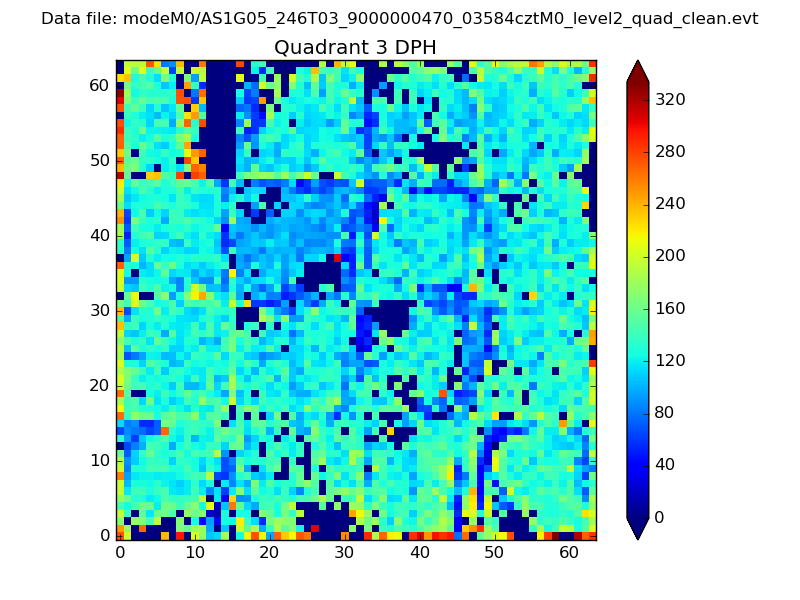 |
 |
Quadrant C |
| Plot type | Count rate plots | Images |
|---|---|---|
| Comparison with Poisson distribution Blue bars denote a histogram of data divided into 1 sec bins. Red curve is a Poisson curve with rate = median count rate of data. |
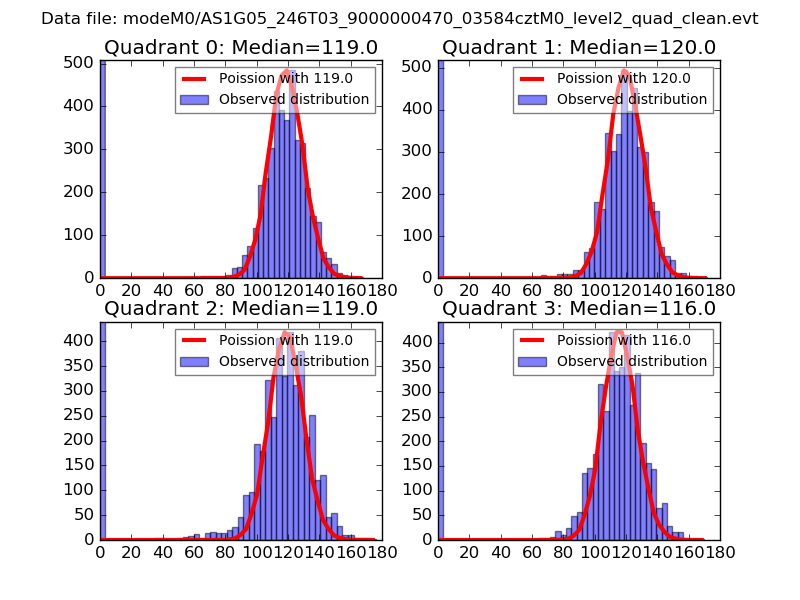 |
 |
| Quadrant-wise count rates Data is divided into 100 sec bins |
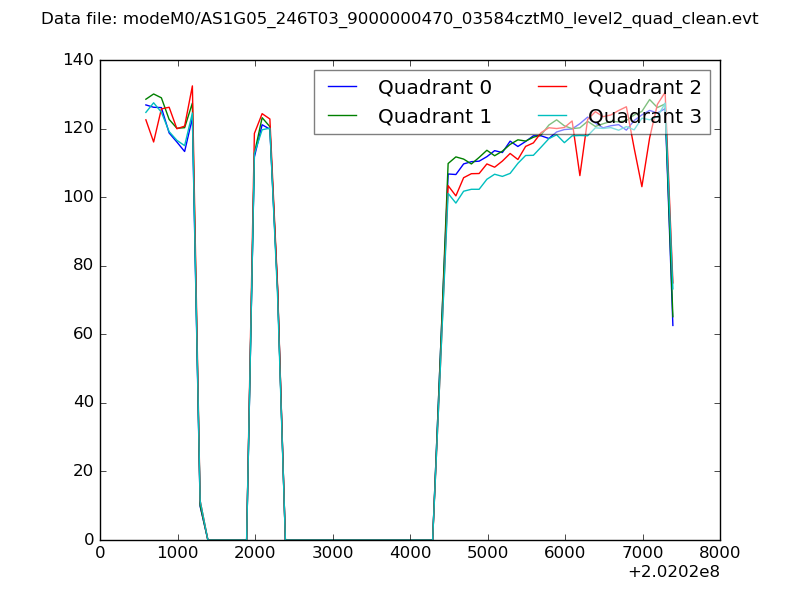 |
|
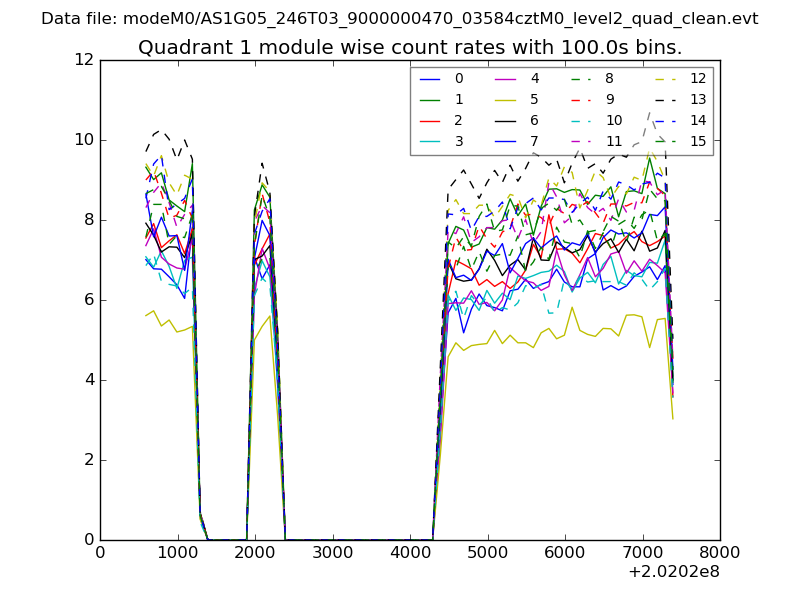
| Module-wise count rates for Quadrant A Data is divided into 100 sec bins |
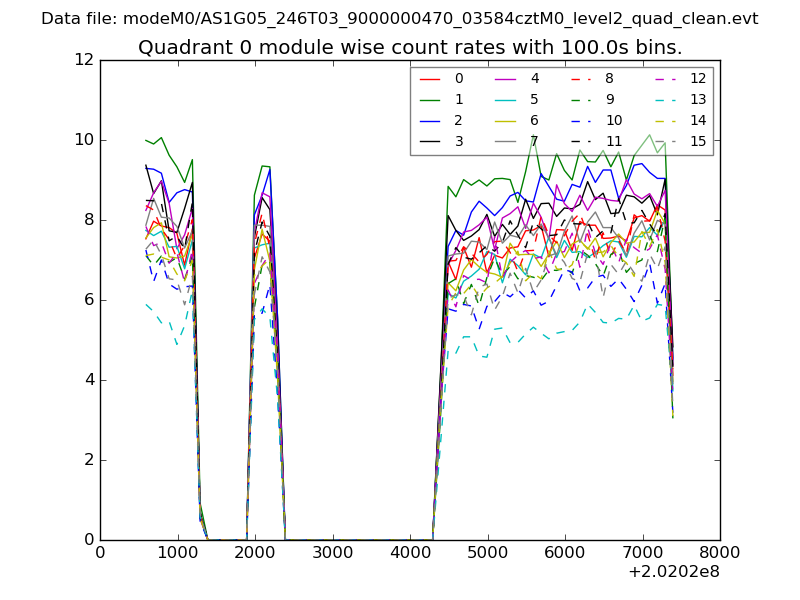 |
 |
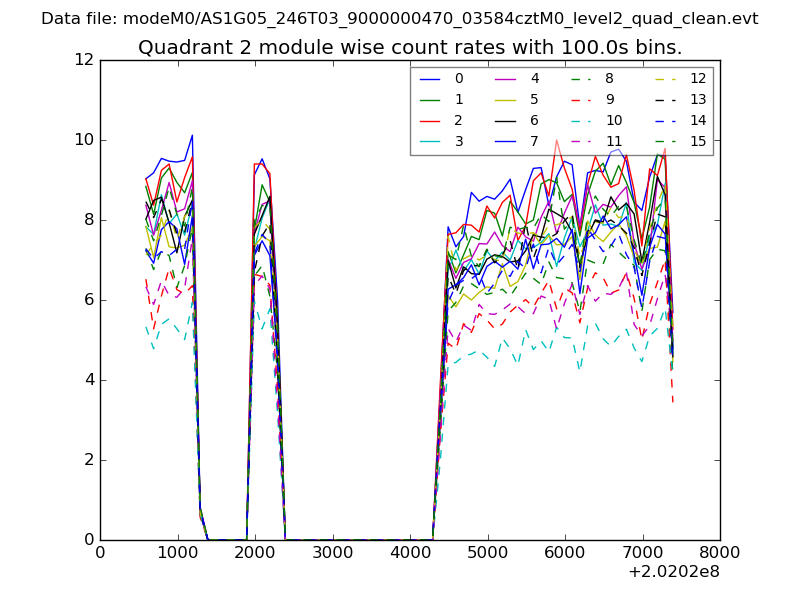
| Module-wise count rates for Quadrant B Data is divided into 100 sec bins |
 |
 |
| Module-wise count rates for Quadrant C Data is divided into 100 sec bins |
 |
 |
| Module-wise count rates for Quadrant D Data is divided into 100 sec bins |
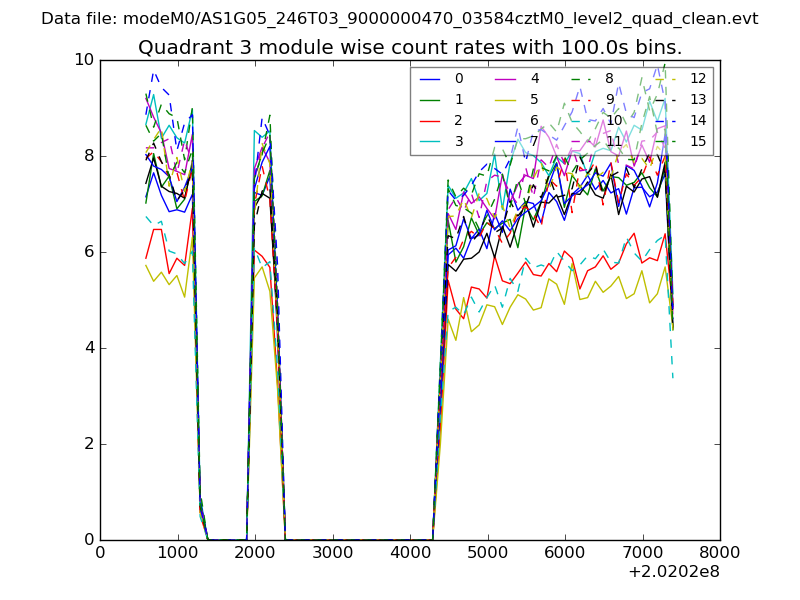 |
 |
| Parameter | Plot |
|---|---|
| CZT HV Monitor | 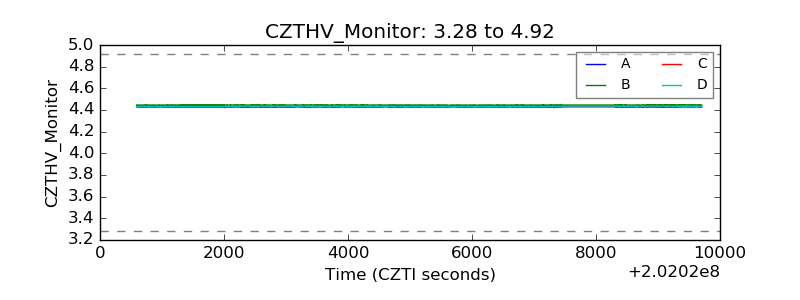 |
| D_VDD | 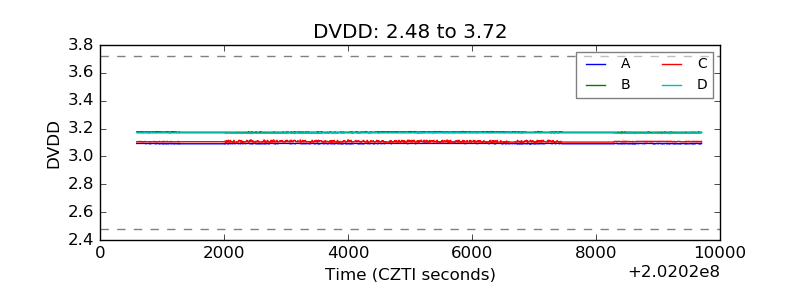 |
| Temperature 1 | 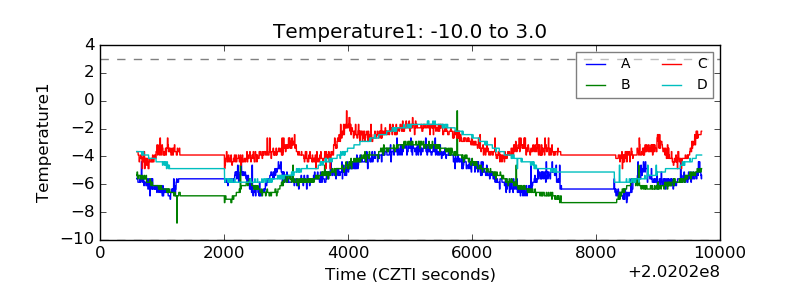 |
| Veto HV Monitor | 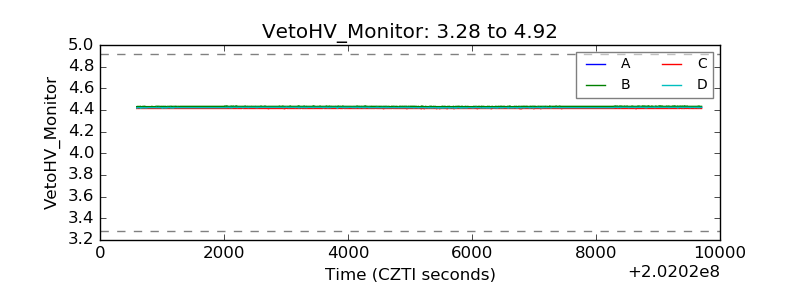 |
| Veto LLD | 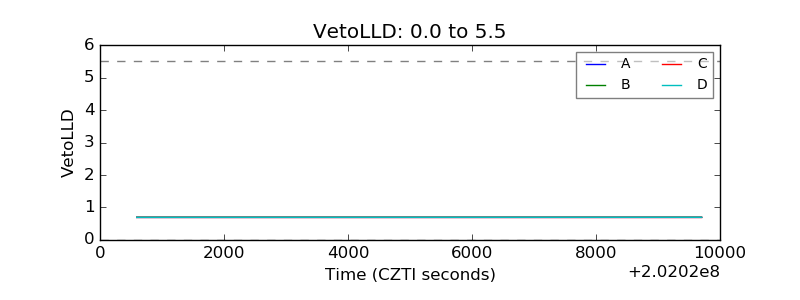 |
| Alpha Counter | 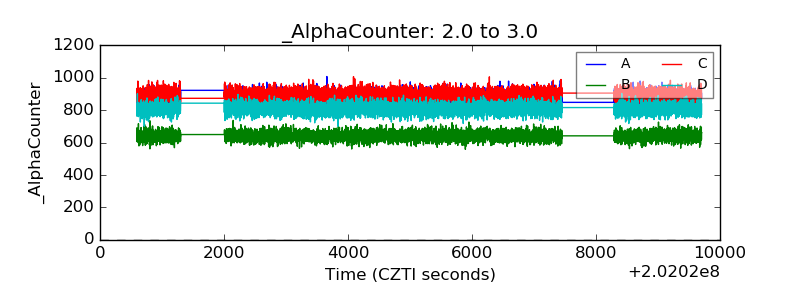 |
| _CPM_Rate | 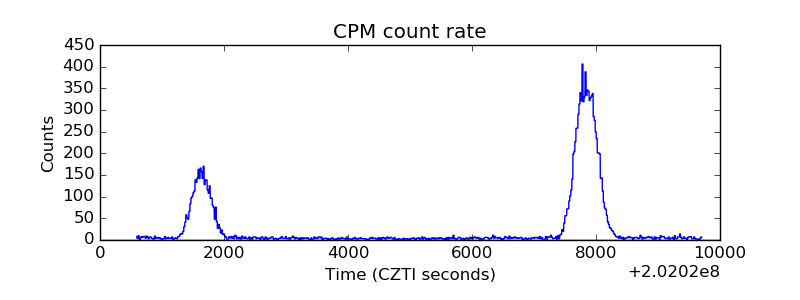 |
| CZT Counter |  |
| +2.5 Volts monitor |  |
| +5 Volts monitor |  |
| _ROLL_ROT | 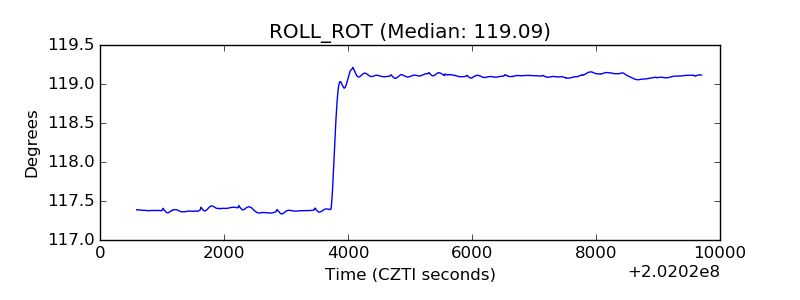 |
| _Roll_DEC | 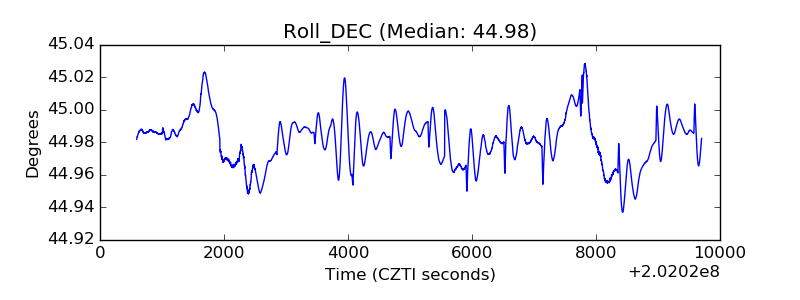 |
| _Roll_RA | 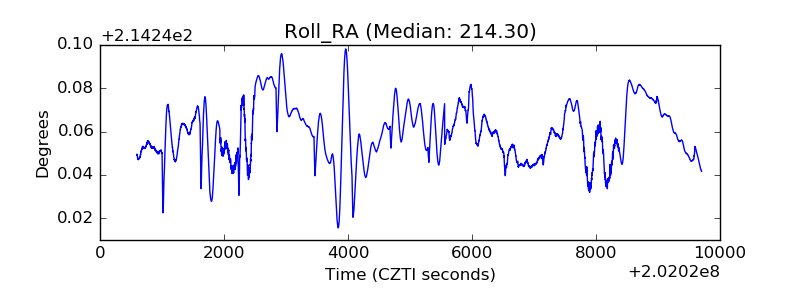 |
| Veto Counter | 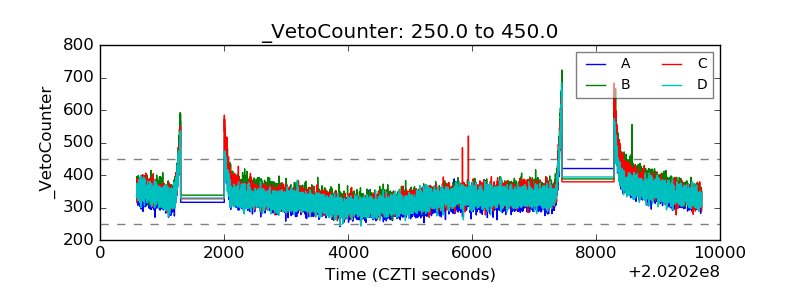 |