| Param | Original file | Final file |
|---|---|---|
| Filename | modeM0/AS1G05_246T03_9000000470_03585cztM0_level2.evt | modeM0/AS1G05_246T03_9000000470_03585cztM0_level2_quad_clean.evt |
| Size (bytes) | 440,190,720 | 59,676,480 |
| Size | 419.8 MB | 56.9 MB |
| Events in quadrant A | 3,037,251 | 339,132 |
| Events in quadrant B | 3,519,709 | 339,285 |
| Events in quadrant C | 3,282,884 | 336,273 |
| Events in quadrant D | 3,040,976 | 330,176 |
| Mode SS | |||
|---|---|---|---|
| Quadrant | BADHDUFLAG | Total packets | Discarded packets |
| A | 0 | 136 | 0 |
| B | 0 | 136 | 0 |
| C | 0 | 136 | 0 |
| D | 0 | 136 | 0 |
| Mode M0 | |||
|---|---|---|---|
| Quadrant | BADHDUFLAG | Total packets | Discarded packets |
| A | 0 | 13548 | 3 |
| B | 0 | 14569 | 2 |
| C | 0 | 14382 | 2 |
| D | 0 | 13835 | 2 |
| Mode M9 | |||
|---|---|---|---|
| Quadrant | BADHDUFLAG | Total packets | Discarded packets |
| A | 0 | 12 | 0 |
| B | 0 | 12 | 0 |
| C | 0 | 12 | 0 |
| D | 0 | 13 | 0 |
| Quadrant | Total seconds | Saturated seconds | Saturation percentage |
|---|---|---|---|
| A | 6617 | 105 | 1.586822% |
| B | 6617 | 121 | 1.828623% |
| C | 6617 | 119 | 1.798398% |
| D | 6617 | 84 | 1.269457% |
Noise dominated data is calculated using 1-second bins in cleaned event files. If a bin has >2000 counts, and if more than 50% of those come from <1% of pixels, then it is considered to be noise-dominated and hence unusable.
| Quadrant | # 1 sec bins | Bins with >0 counts | Bins with >2000 counts | High rate bins dominated by noise | Noise dominated (total time) | Noise dominated (detector-on time) | Marked lightcurve |
|---|---|---|---|---|---|---|---|
| A | 7617 | 6618 | 0 | 0 | 0.00% | 0.00% | 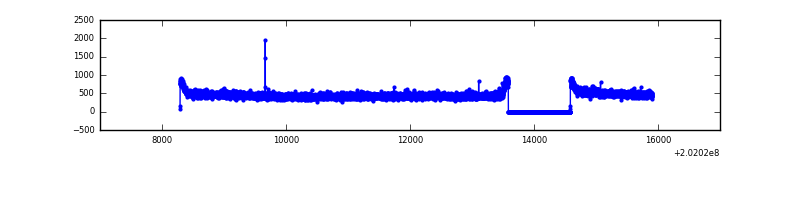 |
| B | 7617 | 6618 | 3 | 3 | 0.04% | 0.05% | 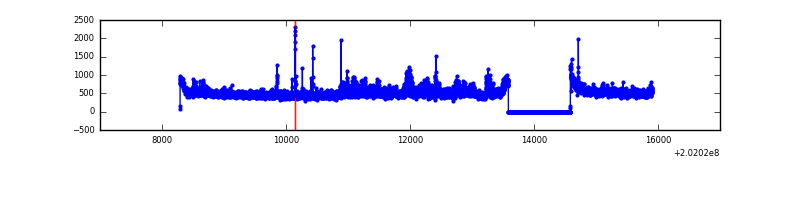 |
| C | 7617 | 6618 | 51 | 51 | 0.67% | 0.77% |  |
| D | 7617 | 6618 | 10 | 10 | 0.13% | 0.15% | 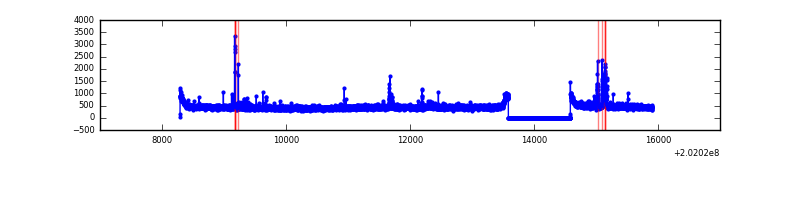 |
Top three noisy pixels from each quadrant. If the there are fewer than three noisy pixels in the level2.evt file, extra rows are filled as -1
| Pixel properties | Quadrant properties | ||||||
|---|---|---|---|---|---|---|---|
| Quadrant | DetID | PixID | Counts | Sigma | Mean | Median | Sigma |
| A | 0 | 226 | 8198 | 46.28 | 783 | 767 | 160.6 |
| A | 12 | 194 | 8141 | 45.92 | 783 | 767 | 160.6 |
| A | 3 | 1 | 5413 | 28.93 | 783 | 767 | 160.6 |
| B | 15 | 204 | 355249 | 2290.97 | 793 | 775 | 154.7 |
| B | 4 | 81 | 30307 | 190.87 | 793 | 775 | 154.7 |
| B | 4 | 200 | 20722 | 128.92 | 793 | 775 | 154.7 |
| C | 15 | 208 | 267632 | 1512.21 | 757 | 761 | 176.5 |
| C | 1 | 16 | 47111 | 262.64 | 757 | 761 | 176.5 |
| C | 2 | 53 | 9377 | 48.82 | 757 | 761 | 176.5 |
| D | 1 | 84 | 53917 | 288.67 | 756 | 732 | 184.2 |
| D | 2 | 33 | 48884 | 261.35 | 756 | 732 | 184.2 |
| D | 2 | 14 | 32239 | 171.01 | 756 | 732 | 184.2 |
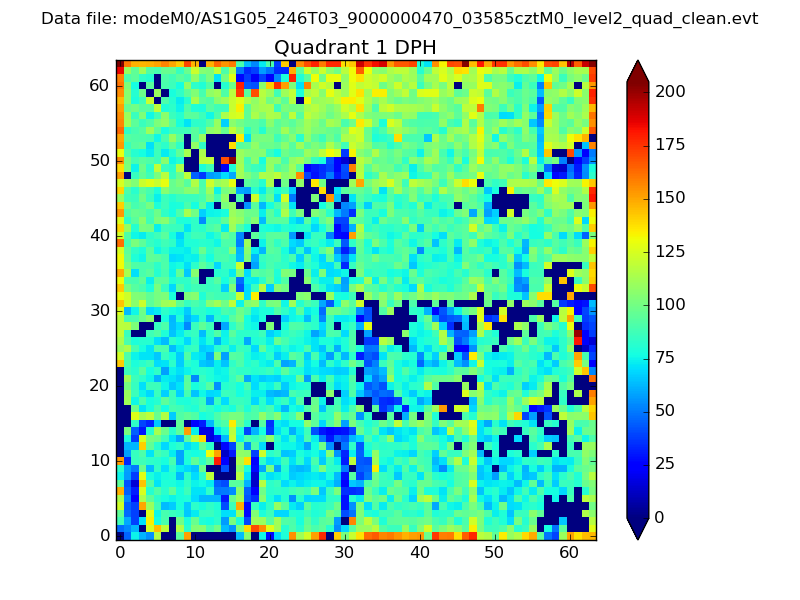
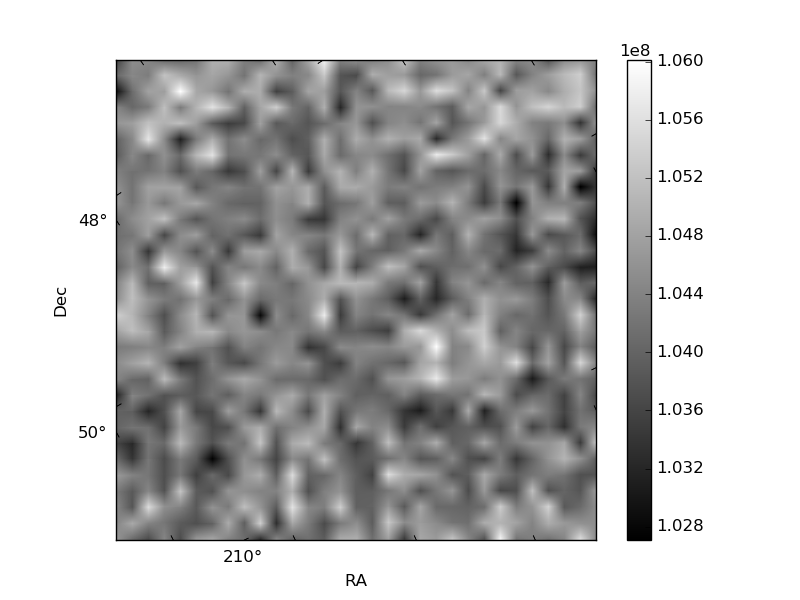
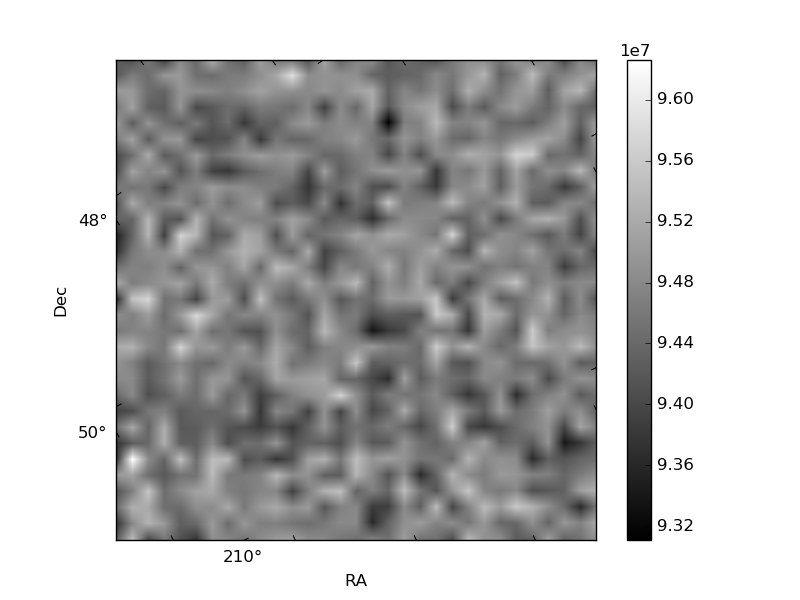
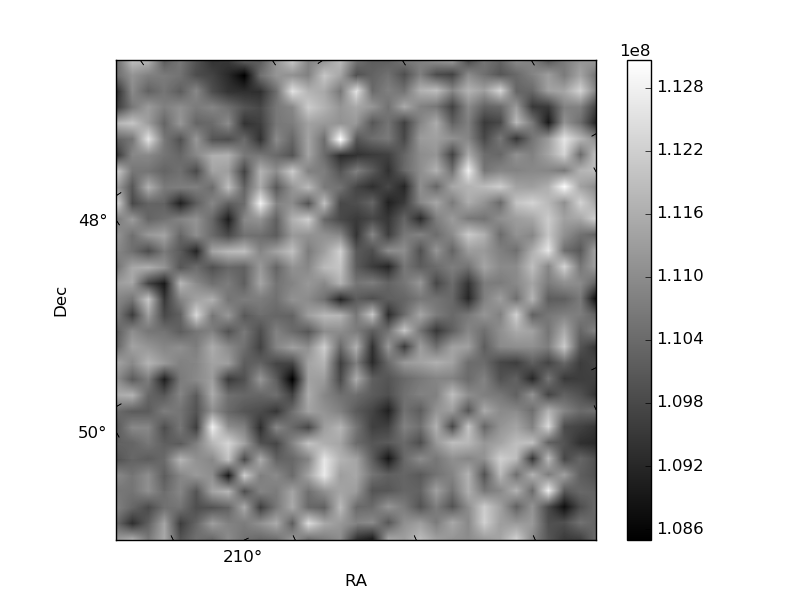
Histogram calculated using DETX and DETY for each event in the final _common_clean file
| Quadrant A |  |
 |
Quadrant B |
|---|---|---|---|
| Quadrant D | 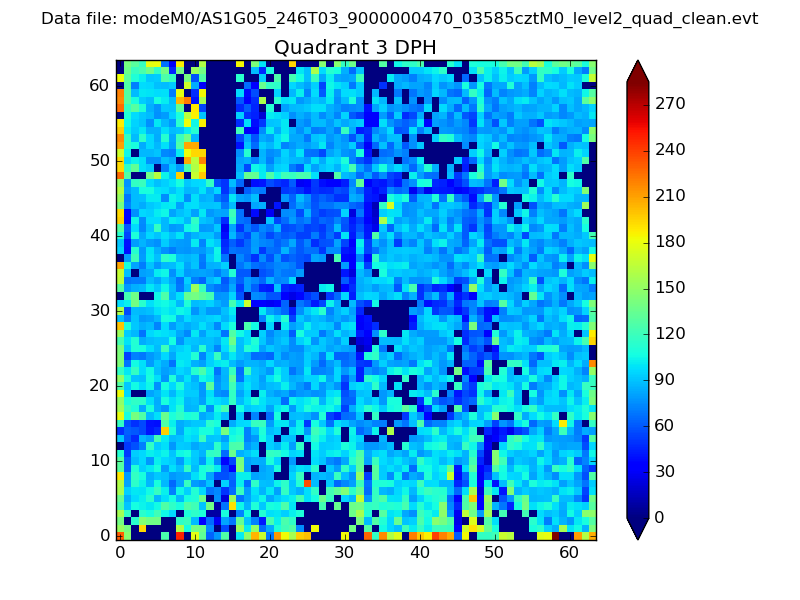 |
 |
Quadrant C |
| Plot type | Count rate plots | Images |
|---|---|---|
| Comparison with Poisson distribution Blue bars denote a histogram of data divided into 1 sec bins. Red curve is a Poisson curve with rate = median count rate of data. |
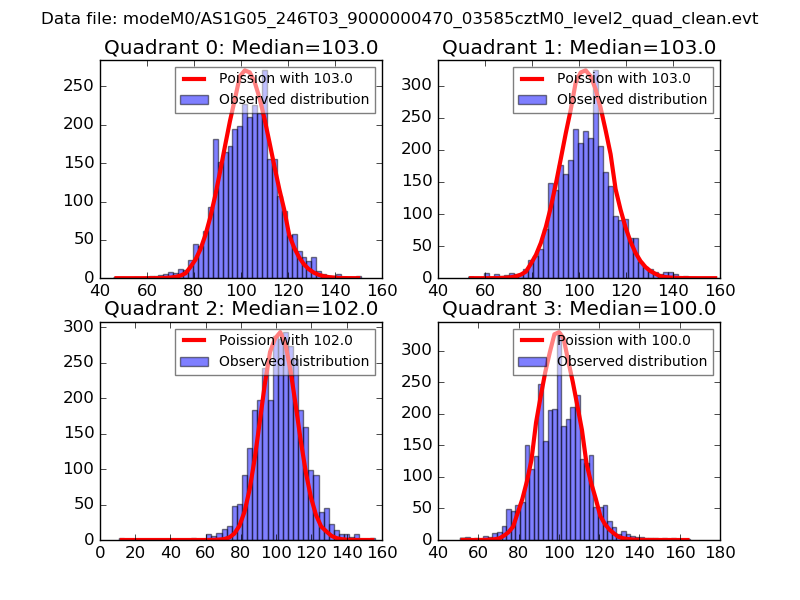 |
 |
| Quadrant-wise count rates Data is divided into 100 sec bins |
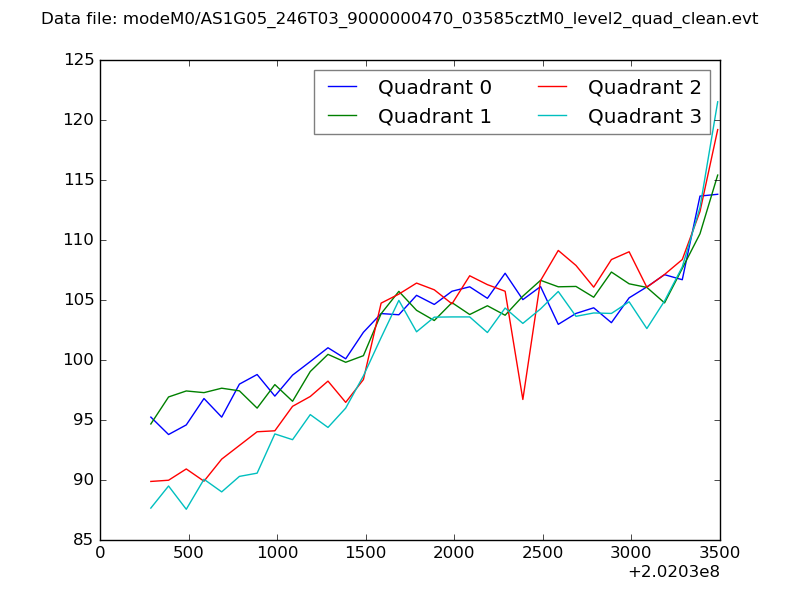 |
|
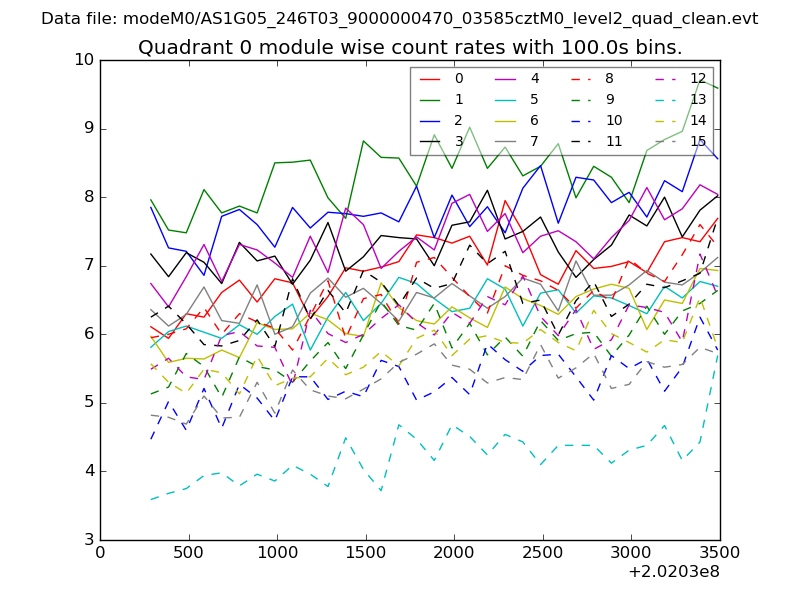
| Module-wise count rates for Quadrant A Data is divided into 100 sec bins |
 |
 |
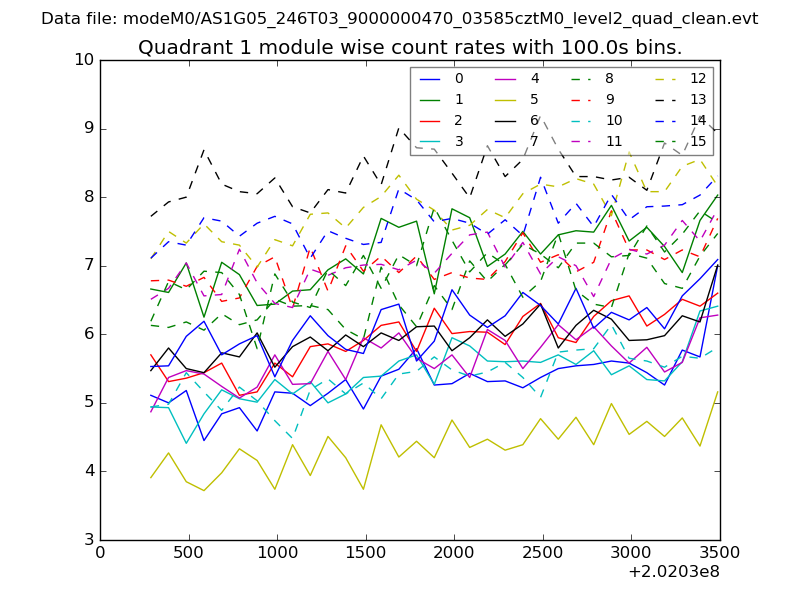
| Module-wise count rates for Quadrant B Data is divided into 100 sec bins |
 |
 |
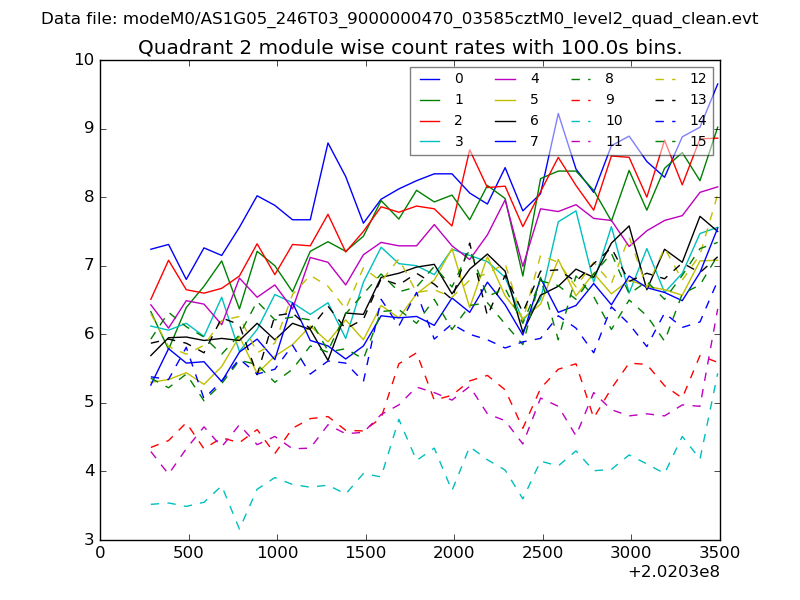
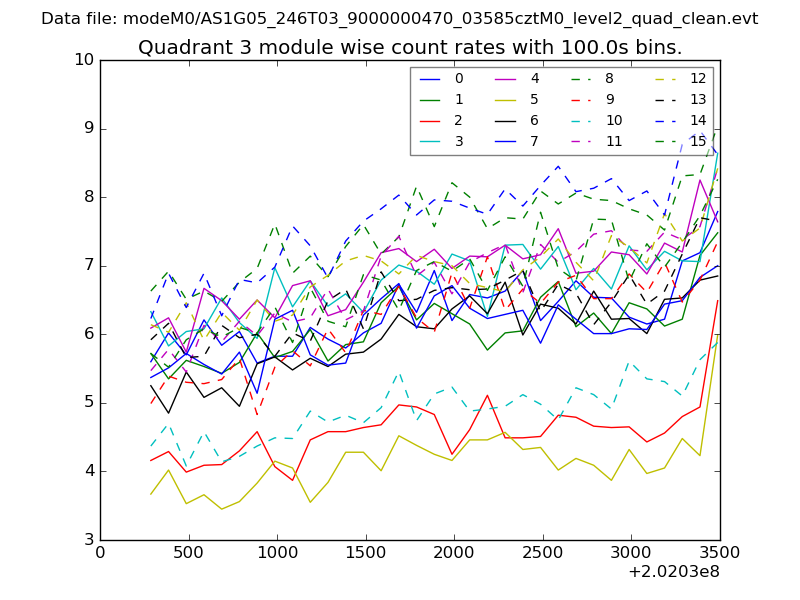
| Module-wise count rates for Quadrant C Data is divided into 100 sec bins |
 |
 |
| Module-wise count rates for Quadrant D Data is divided into 100 sec bins |
 |
 |
| Parameter | Plot |
|---|---|
| CZT HV Monitor | 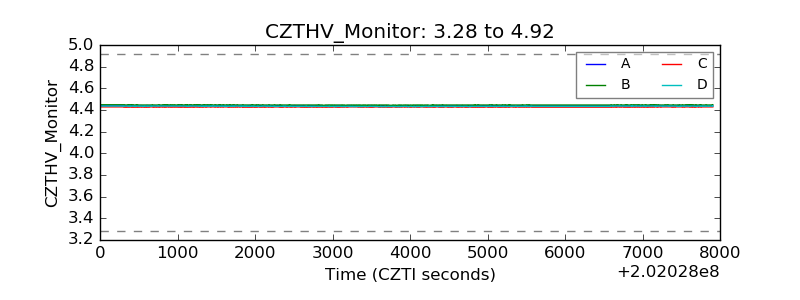 |
| D_VDD | 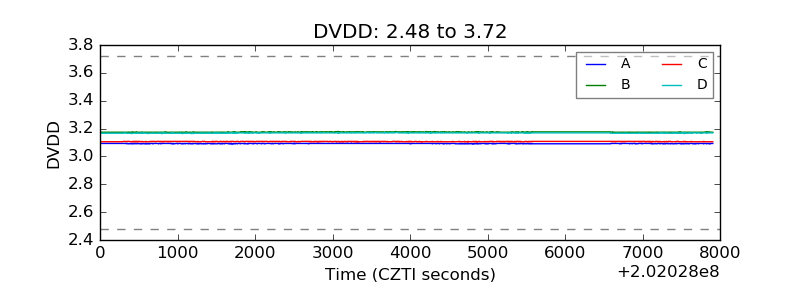 |
| Temperature 1 | 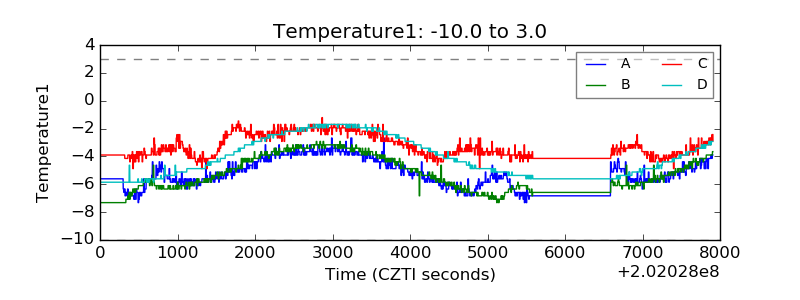 |
| Veto HV Monitor | 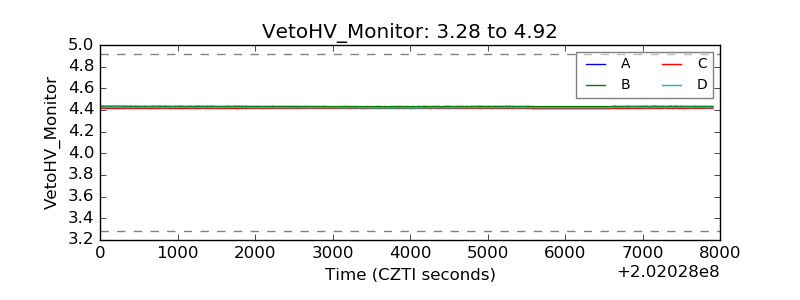 |
| Veto LLD | 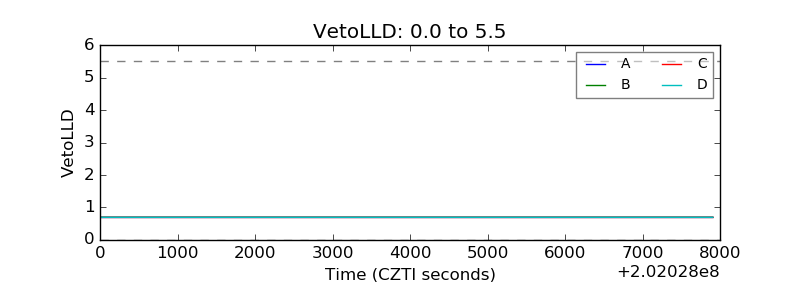 |
| Alpha Counter | 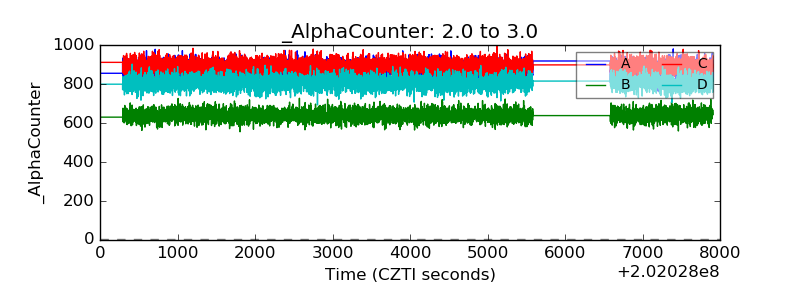 |
| _CPM_Rate | 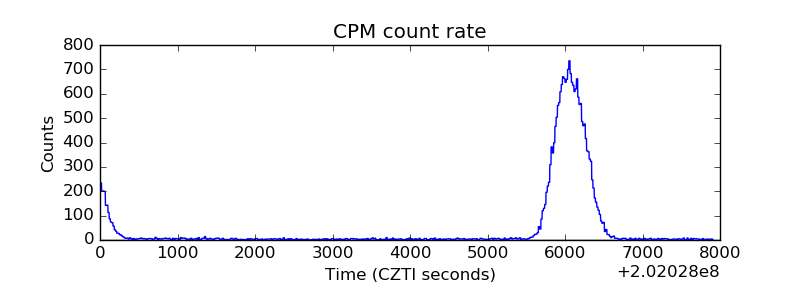 |
| CZT Counter | 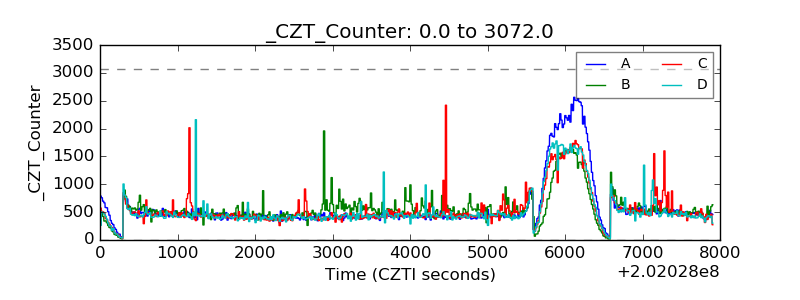 |
| +2.5 Volts monitor |  |
| +5 Volts monitor |  |
| Veto Counter | 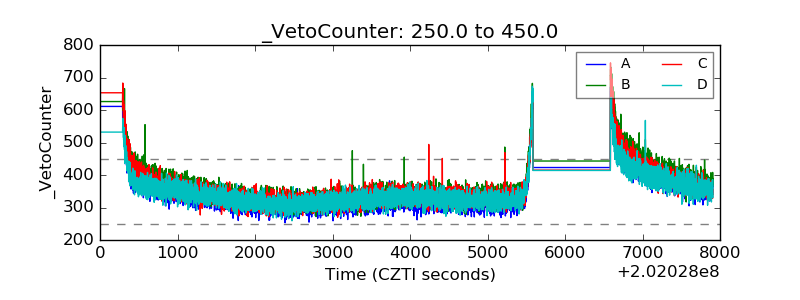 |