| Param | Original file | Final file |
|---|---|---|
| Filename | modeM0/AS1G05_246T03_9000000470_03587cztM0_level2.evt | modeM0/AS1G05_246T03_9000000470_03587cztM0_level2_quad_clean.evt |
| Size (bytes) | 513,414,720 | 76,587,840 |
| Size | 489.6 MB | 73.0 MB |
| Events in quadrant A | 3,363,374 | 463,264 |
| Events in quadrant B | 3,679,666 | 463,027 |
| Events in quadrant C | 4,509,499 | 457,349 |
| Events in quadrant D | 3,519,603 | 446,452 |
| Mode SS | |||
|---|---|---|---|
| Quadrant | BADHDUFLAG | Total packets | Discarded packets |
| A | 0 | 146 | 0 |
| B | 0 | 146 | 0 |
| C | 0 | 146 | 0 |
| D | 0 | 146 | 0 |
| Mode M0 | |||
|---|---|---|---|
| Quadrant | BADHDUFLAG | Total packets | Discarded packets |
| A | 0 | 14635 | 3 |
| B | 0 | 15237 | 2 |
| C | 0 | 18325 | 2 |
| D | 0 | 15026 | 2 |
| Mode M9 | |||
|---|---|---|---|
| Quadrant | BADHDUFLAG | Total packets | Discarded packets |
| A | 0 | 21 | 0 |
| B | 0 | 21 | 0 |
| C | 0 | 21 | 0 |
| D | 0 | 21 | 0 |
| Quadrant | Total seconds | Saturated seconds | Saturation percentage |
|---|---|---|---|
| A | 7013 | 140 | 1.996293% |
| B | 7013 | 147 | 2.096107% |
| C | 7013 | 398 | 5.675175% |
| D | 7013 | 116 | 1.654071% |
Noise dominated data is calculated using 1-second bins in cleaned event files. If a bin has >2000 counts, and if more than 50% of those come from <1% of pixels, then it is considered to be noise-dominated and hence unusable.
| Quadrant | # 1 sec bins | Bins with >0 counts | Bins with >2000 counts | High rate bins dominated by noise | Noise dominated (total time) | Noise dominated (detector-on time) | Marked lightcurve |
|---|---|---|---|---|---|---|---|
| A | 9148 | 7015 | 0 | 0 | 0.00% | 0.00% | 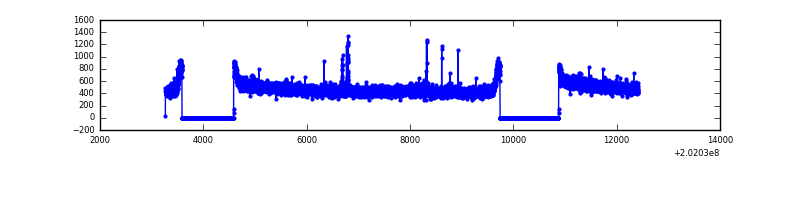 |
| B | 9148 | 7015 | 1 | 1 | 0.01% | 0.01% | 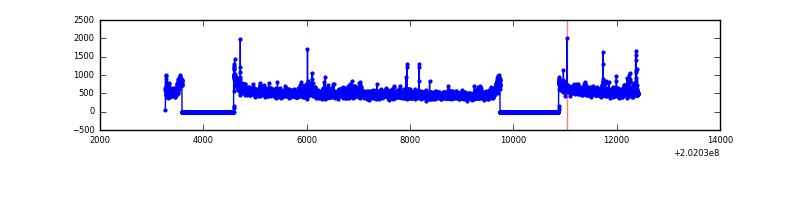 |
| C | 9148 | 7015 | 211 | 211 | 2.31% | 3.01% | 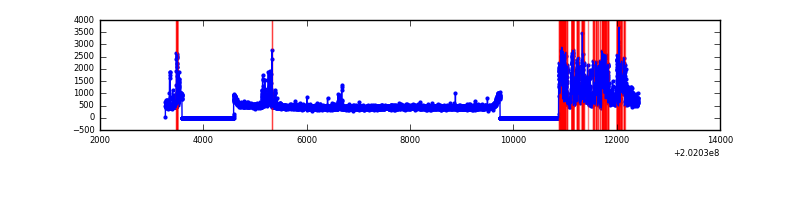 |
| D | 9148 | 7015 | 14 | 14 | 0.15% | 0.20% | 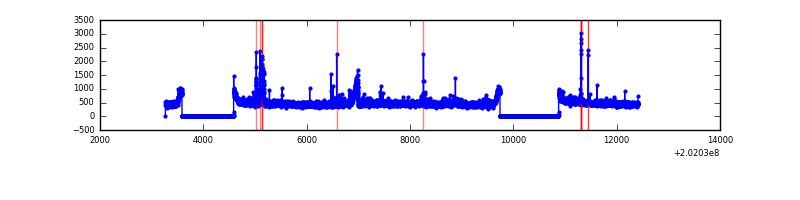 |
Top three noisy pixels from each quadrant. If the there are fewer than three noisy pixels in the level2.evt file, extra rows are filled as -1
| Pixel properties | Quadrant properties | ||||||
|---|---|---|---|---|---|---|---|
| Quadrant | DetID | PixID | Counts | Sigma | Mean | Median | Sigma |
| A | 0 | 50 | 20777 | 114.05 | 861 | 843 | 174.8 |
| A | 12 | 194 | 9143 | 47.49 | 861 | 843 | 174.8 |
| A | 0 | 226 | 8927 | 46.25 | 861 | 843 | 174.8 |
| B | 15 | 204 | 205224 | 1214.62 | 868 | 847 | 168.3 |
| B | 4 | 81 | 34404 | 199.43 | 868 | 847 | 168.3 |
| B | 3 | 0 | 24015 | 137.69 | 868 | 847 | 168.3 |
| C | 2 | 53 | 920648 | 4839.49 | 817 | 820 | 190.1 |
| C | 15 | 208 | 388858 | 2041.58 | 817 | 820 | 190.1 |
| C | 13 | 61 | 7007 | 32.55 | 817 | 820 | 190.1 |
| D | 1 | 84 | 185233 | 916.51 | 831 | 808 | 201.2 |
| D | 2 | 33 | 111848 | 551.82 | 831 | 808 | 201.2 |
| D | 14 | 34 | 31745 | 153.74 | 831 | 808 | 201.2 |
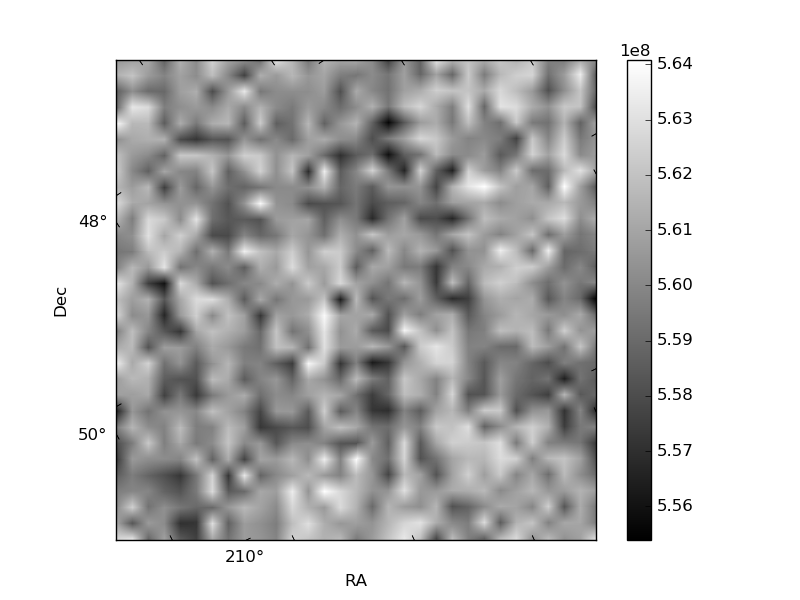
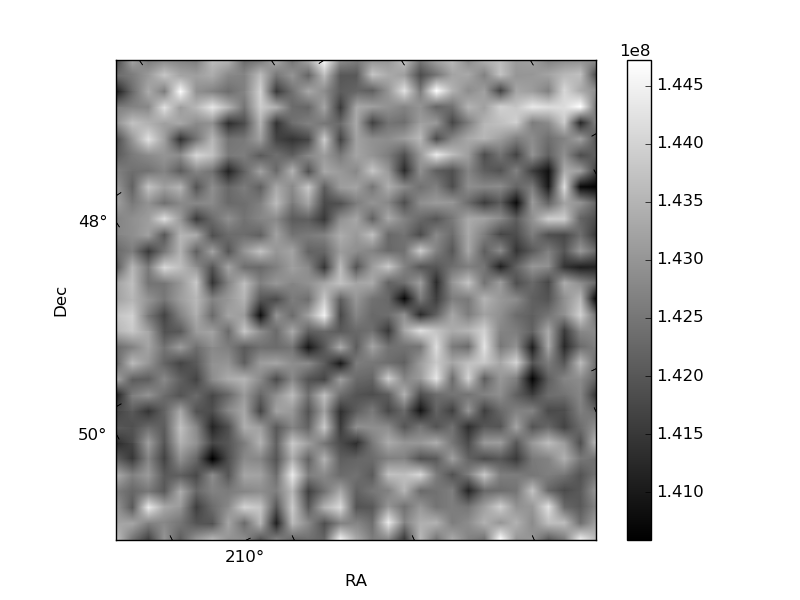
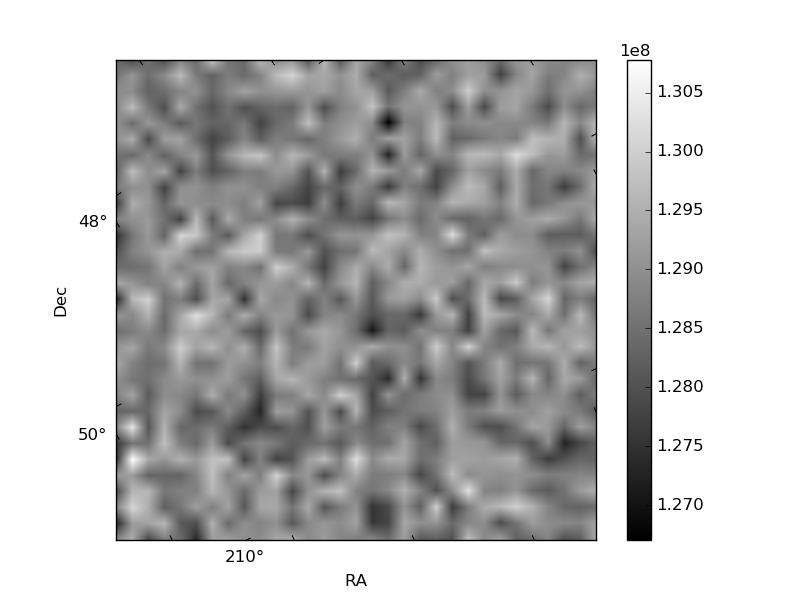
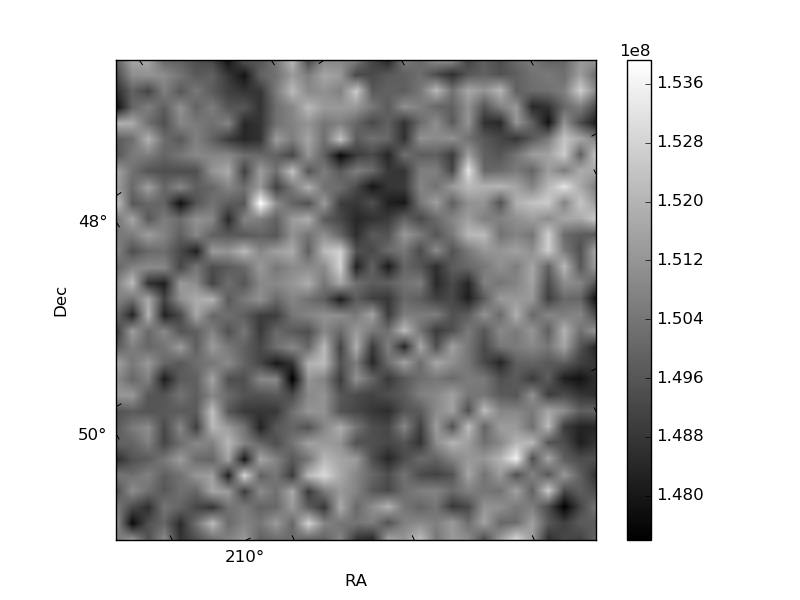
Histogram calculated using DETX and DETY for each event in the final _common_clean file
| Quadrant A | 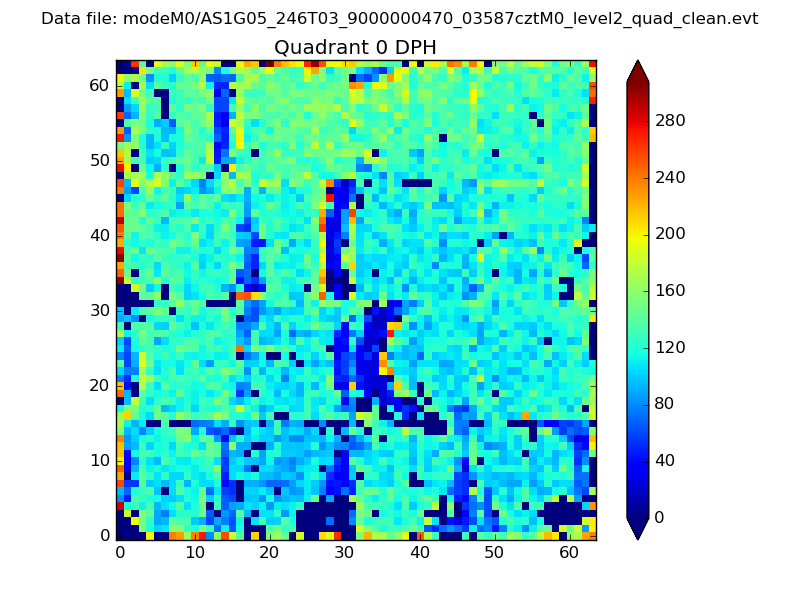 |
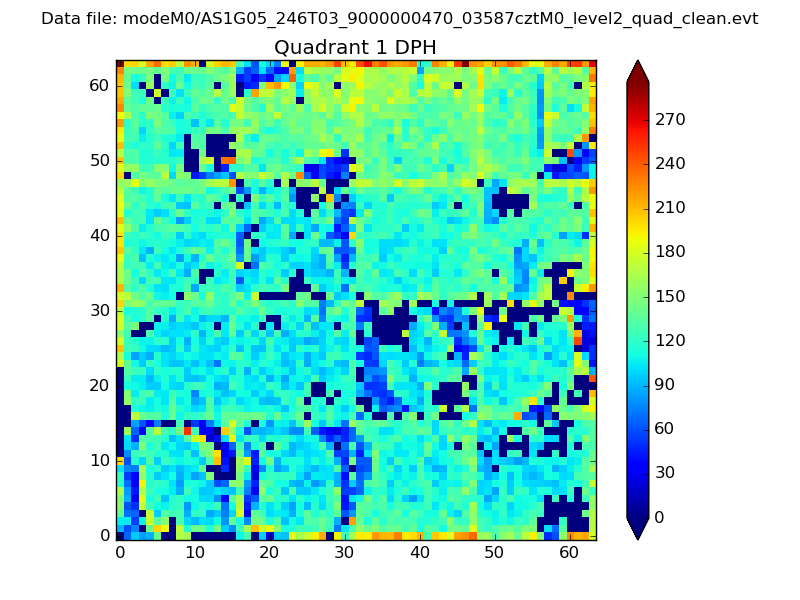 |
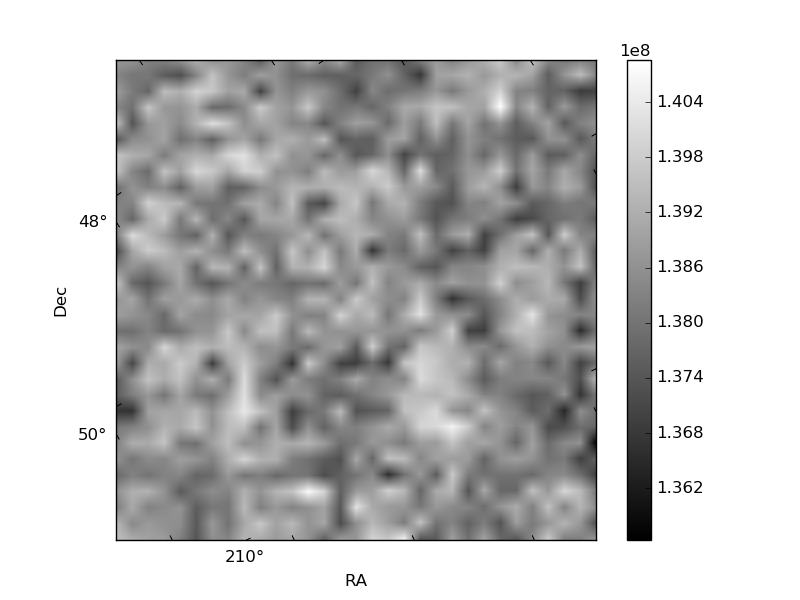
Quadrant B |
|---|---|---|---|
| Quadrant D | 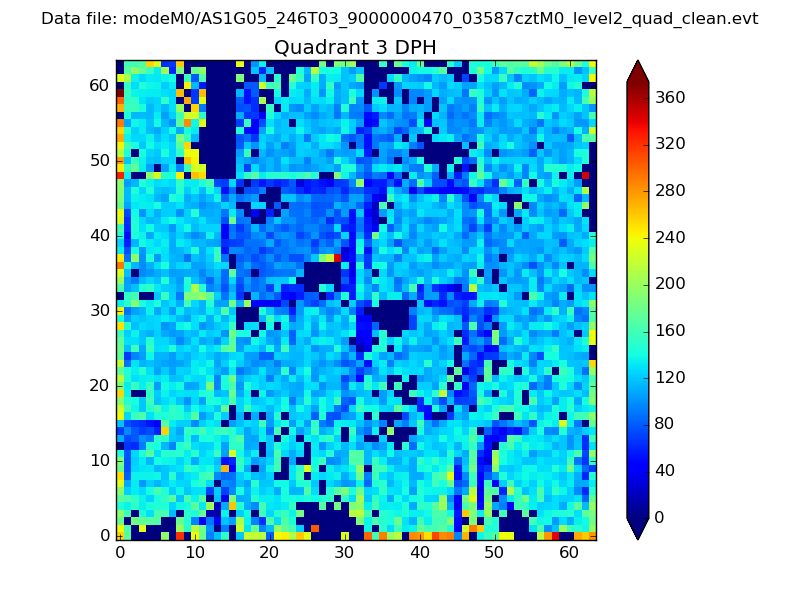 |
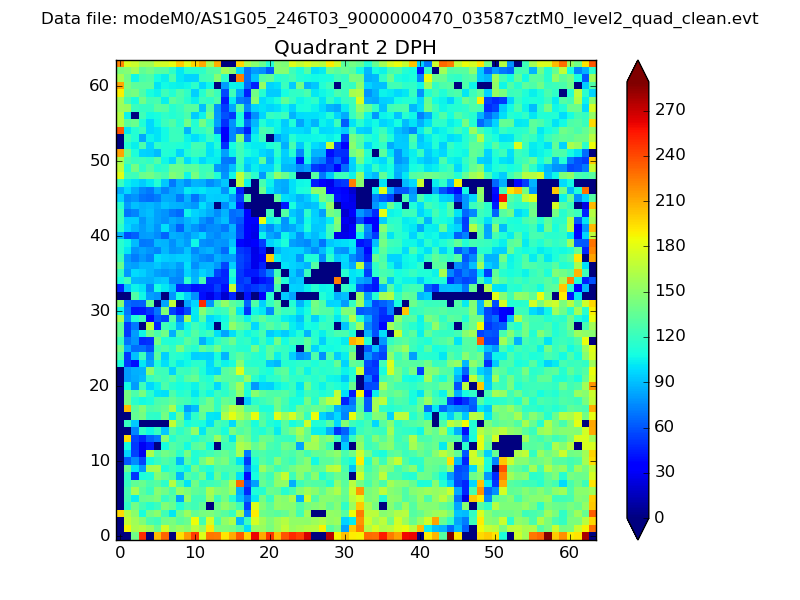 |
Quadrant C |
| Plot type | Count rate plots | Images |
|---|---|---|
| Comparison with Poisson distribution Blue bars denote a histogram of data divided into 1 sec bins. Red curve is a Poisson curve with rate = median count rate of data. |
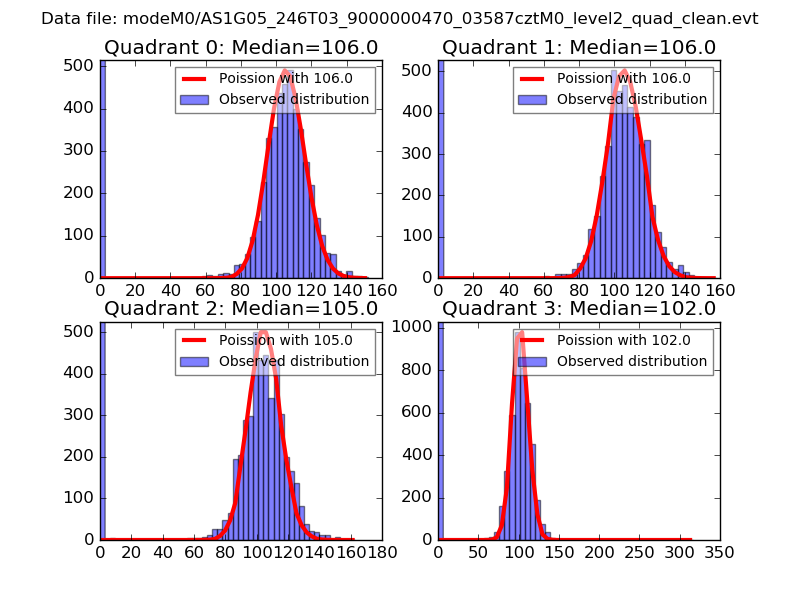 |
 |
| Quadrant-wise count rates Data is divided into 100 sec bins |
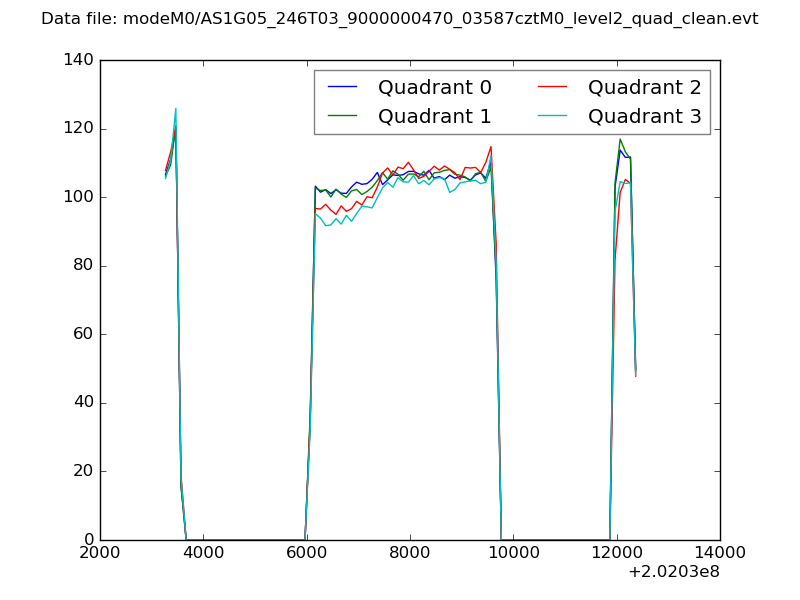 |
|
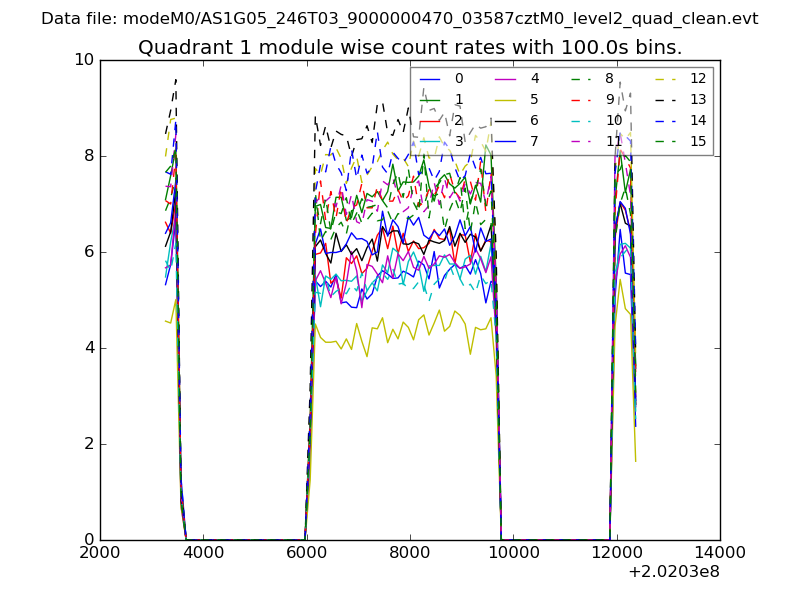
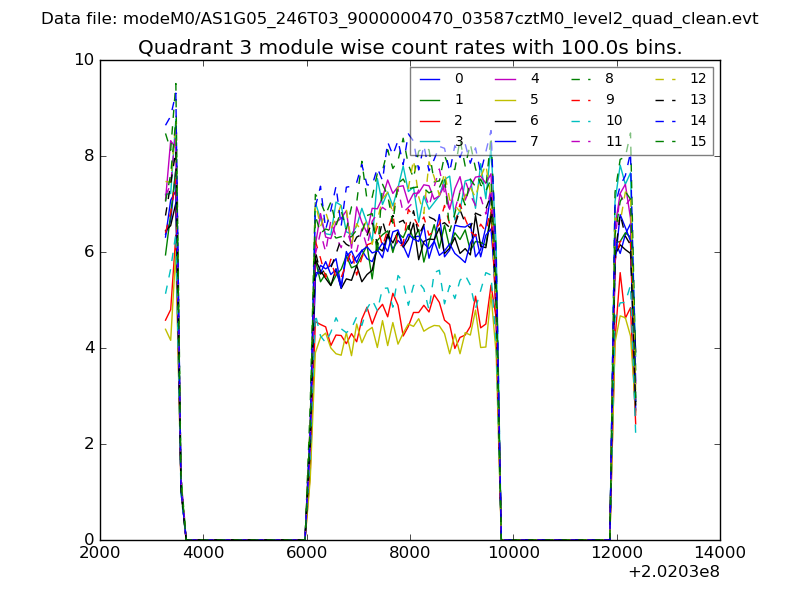
| Module-wise count rates for Quadrant A Data is divided into 100 sec bins |
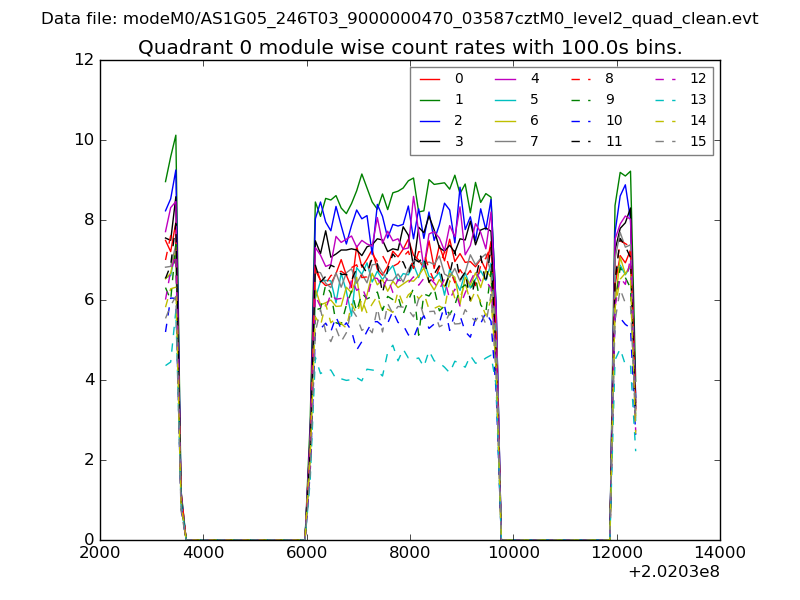 |
 |
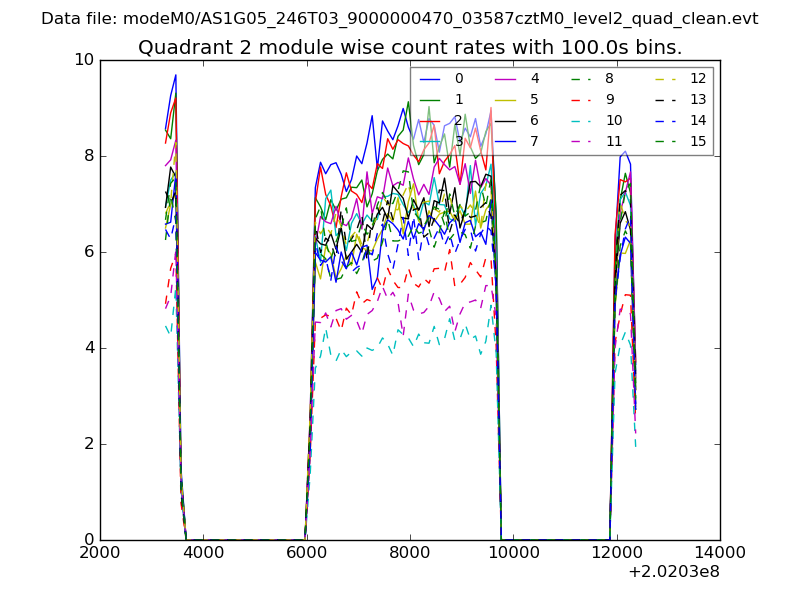
| Module-wise count rates for Quadrant B Data is divided into 100 sec bins |
 |
 |
| Module-wise count rates for Quadrant C Data is divided into 100 sec bins |
 |
 |
| Module-wise count rates for Quadrant D Data is divided into 100 sec bins |
 |
 |
| Parameter | Plot |
|---|---|
| CZT HV Monitor | 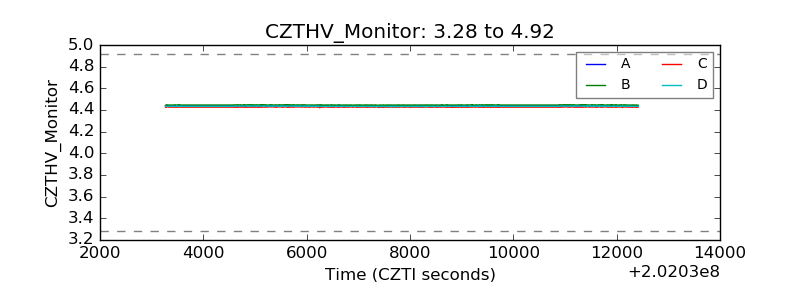 |
| D_VDD | 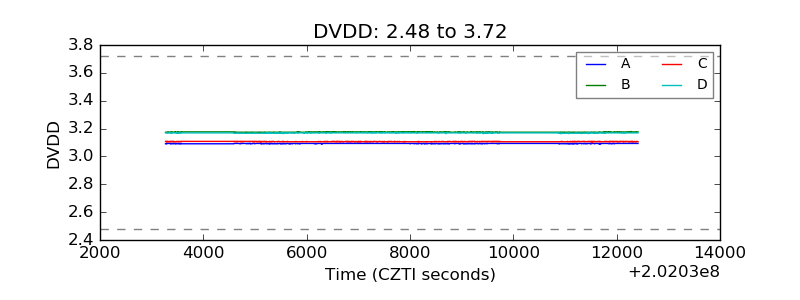 |
| Temperature 1 | 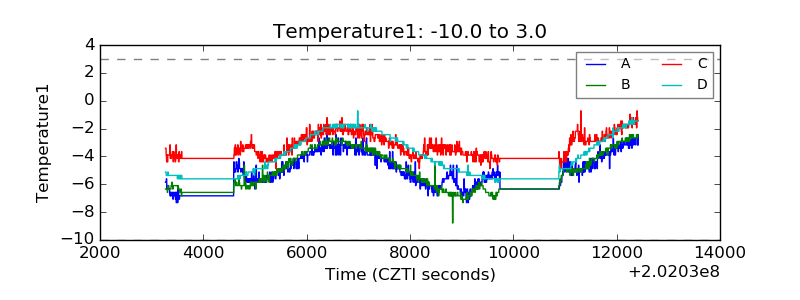 |
| Veto HV Monitor | 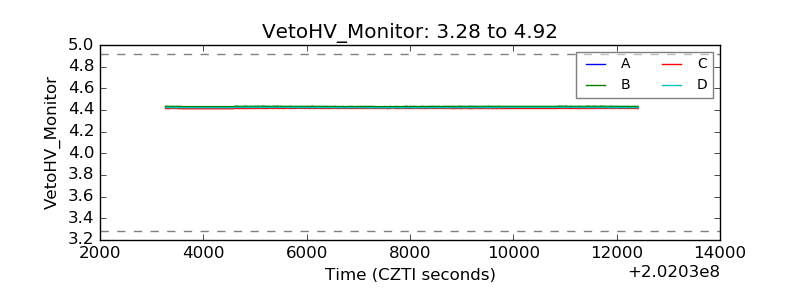 |
| Veto LLD | 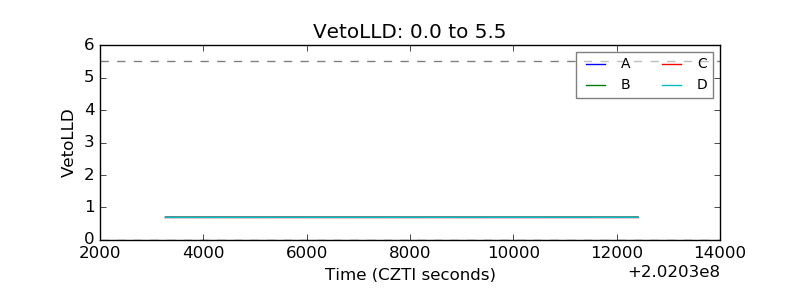 |
| Alpha Counter | 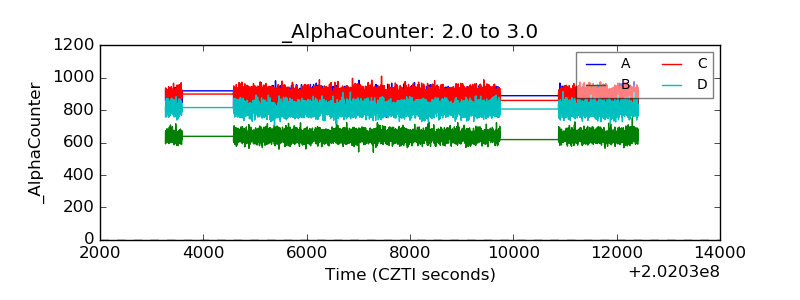 |
| _CPM_Rate | 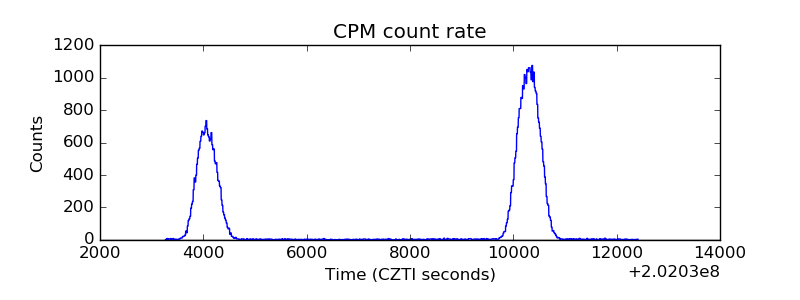 |
| CZT Counter | 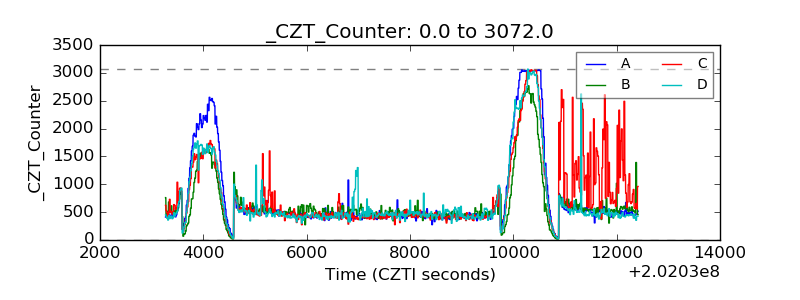 |
| +2.5 Volts monitor |  |
| +5 Volts monitor |  |
| Veto Counter | 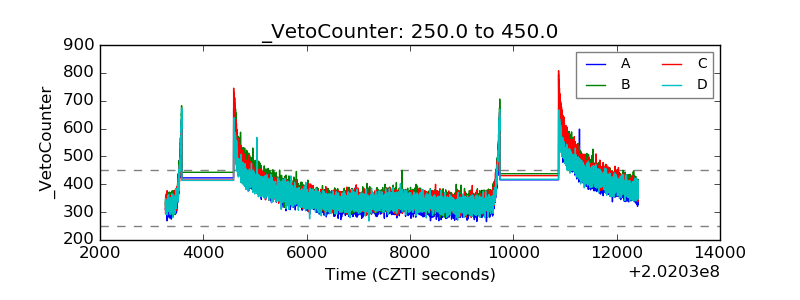 |