| Param | Original file | Final file |
|---|---|---|
| Filename | modeM0/AS1G05_246T03_9000000470_03588cztM0_level2.evt | modeM0/AS1G05_246T03_9000000470_03588cztM0_level2_quad_clean.evt |
| Size (bytes) | 599,912,640 | 78,917,760 |
| Size | 572.1 MB | 75.3 MB |
| Events in quadrant A | 3,262,056 | 511,114 |
| Events in quadrant B | 3,593,133 | 513,355 |
| Events in quadrant C | 7,740,017 | 415,472 |
| Events in quadrant D | 3,129,387 | 492,415 |
| Mode SS | |||
|---|---|---|---|
| Quadrant | BADHDUFLAG | Total packets | Discarded packets |
| A | 0 | 132 | 0 |
| B | 0 | 132 | 0 |
| C | 0 | 132 | 0 |
| D | 0 | 132 | 0 |
| Mode M0 | |||
|---|---|---|---|
| Quadrant | BADHDUFLAG | Total packets | Discarded packets |
| A | 0 | 13925 | 3 |
| B | 0 | 14715 | 2 |
| C | 0 | 27392 | 2 |
| D | 0 | 13727 | 2 |
| Mode M9 | |||
|---|---|---|---|
| Quadrant | BADHDUFLAG | Total packets | Discarded packets |
| A | 0 | 13 | 0 |
| B | 0 | 13 | 0 |
| C | 0 | 13 | 0 |
| D | 0 | 14 | 0 |
| Quadrant | Total seconds | Saturated seconds | Saturation percentage |
|---|---|---|---|
| A | 6552 | 80 | 1.221001% |
| B | 6552 | 72 | 1.098901% |
| C | 6552 | 1672 | 25.518926% |
| D | 6552 | 59 | 0.900488% |
Noise dominated data is calculated using 1-second bins in cleaned event files. If a bin has >2000 counts, and if more than 50% of those come from <1% of pixels, then it is considered to be noise-dominated and hence unusable.
| Quadrant | # 1 sec bins | Bins with >0 counts | Bins with >2000 counts | High rate bins dominated by noise | Noise dominated (total time) | Noise dominated (detector-on time) | Marked lightcurve |
|---|---|---|---|---|---|---|---|
| A | 7787 | 6553 | 3 | 3 | 0.04% | 0.05% |  |
| B | 7787 | 6553 | 4 | 4 | 0.05% | 0.06% |  |
| C | 7787 | 6553 | 1446 | 1446 | 18.57% | 22.07% | 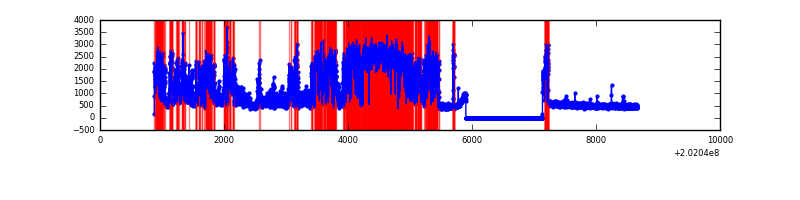 |
| D | 7787 | 6553 | 20 | 20 | 0.26% | 0.31% |  |
Top three noisy pixels from each quadrant. If the there are fewer than three noisy pixels in the level2.evt file, extra rows are filled as -1
| Pixel properties | Quadrant properties | ||||||
|---|---|---|---|---|---|---|---|
| Quadrant | DetID | PixID | Counts | Sigma | Mean | Median | Sigma |
| A | 0 | 50 | 42072 | 247.17 | 822 | 806 | 167.0 |
| A | 0 | 118 | 18226 | 104.34 | 822 | 806 | 167.0 |
| A | 13 | 248 | 13414 | 75.52 | 822 | 806 | 167.0 |
| B | 15 | 204 | 214710 | 1362.85 | 823 | 803 | 157.0 |
| B | 4 | 81 | 103293 | 652.98 | 823 | 803 | 157.0 |
| B | 4 | 200 | 22964 | 141.19 | 823 | 803 | 157.0 |
| C | 2 | 53 | 4669823 | 28794.75 | 702 | 706 | 162.2 |
| C | 15 | 208 | 311336 | 1915.68 | 702 | 706 | 162.2 |
| C | 1 | 16 | 10085 | 57.84 | 702 | 706 | 162.2 |
| D | 12 | 157 | 38391 | 197.27 | 792 | 771 | 190.7 |
| D | 1 | 84 | 34915 | 179.04 | 792 | 771 | 190.7 |
| D | 13 | 223 | 26278 | 133.75 | 792 | 771 | 190.7 |
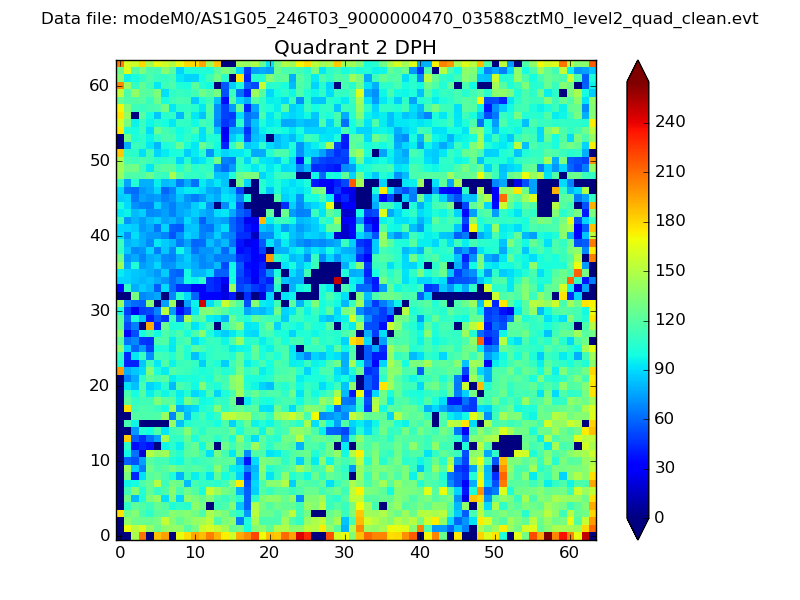
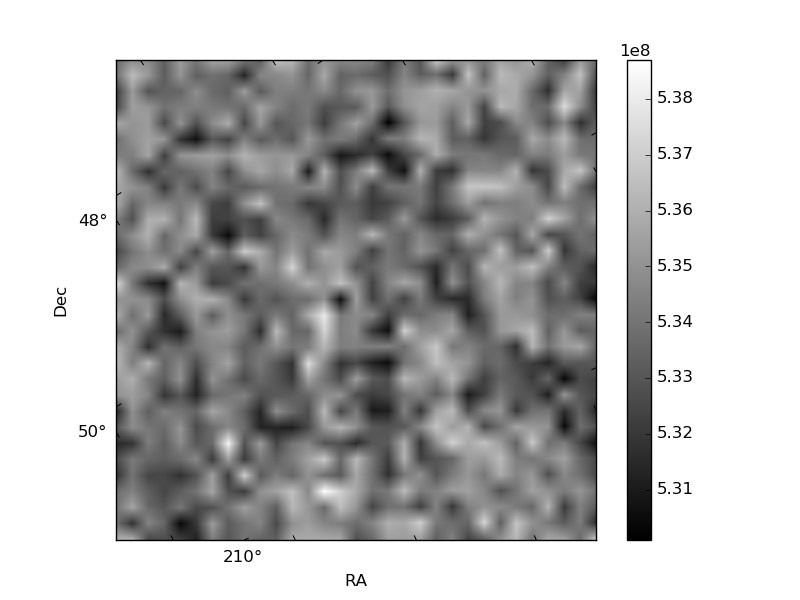
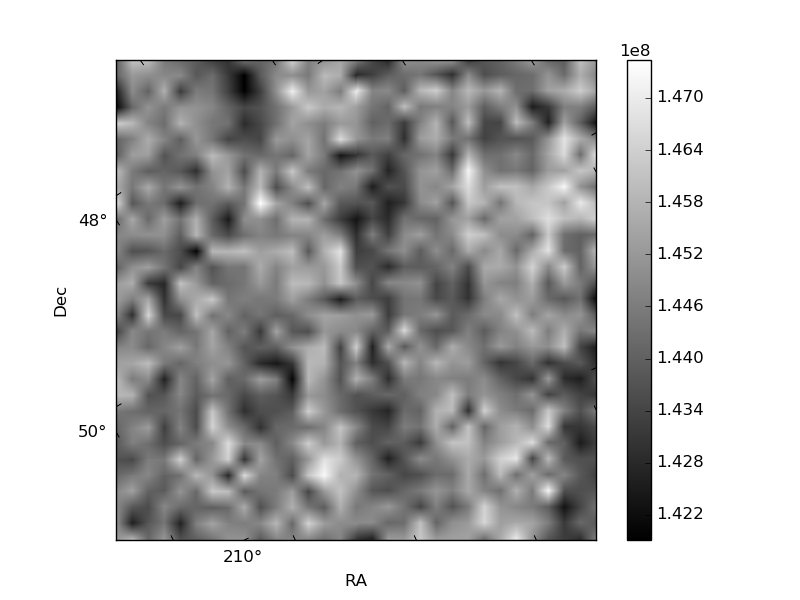
Histogram calculated using DETX and DETY for each event in the final _common_clean file
| Quadrant A |  |
 |
Quadrant B |
|---|---|---|---|
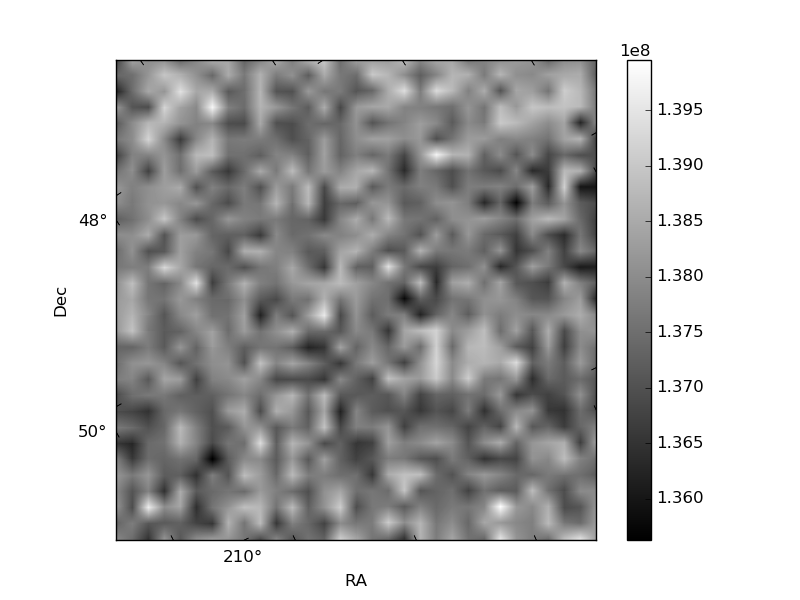
| Quadrant D | 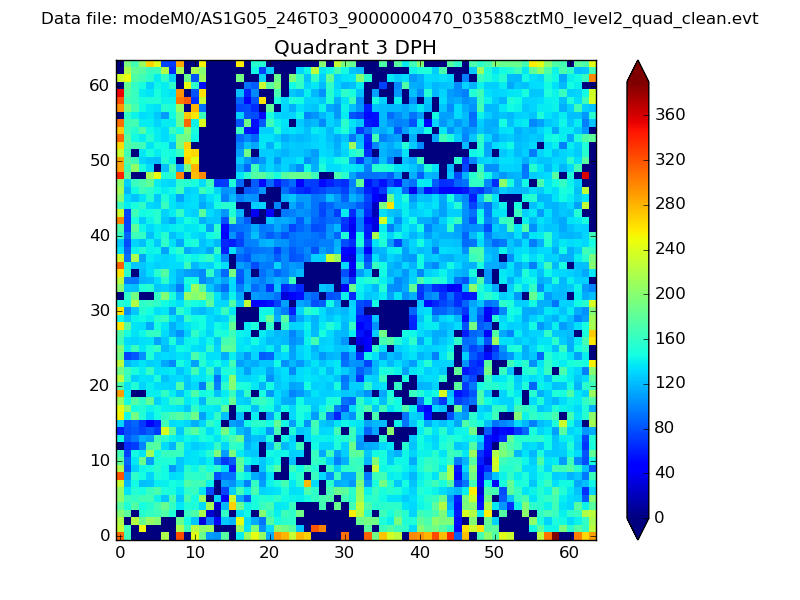 |
 |
Quadrant C |
| Plot type | Count rate plots | Images |
|---|---|---|
| Comparison with Poisson distribution Blue bars denote a histogram of data divided into 1 sec bins. Red curve is a Poisson curve with rate = median count rate of data. |
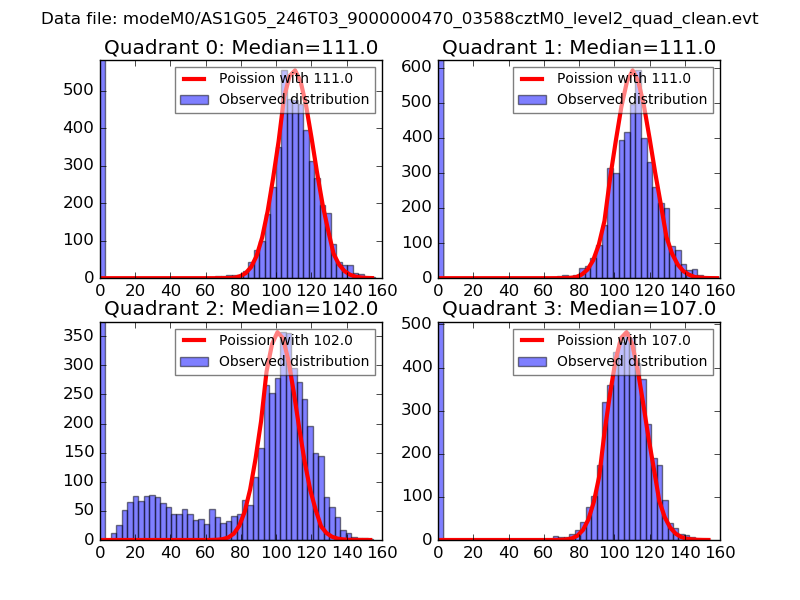 |
 |
| Quadrant-wise count rates Data is divided into 100 sec bins |
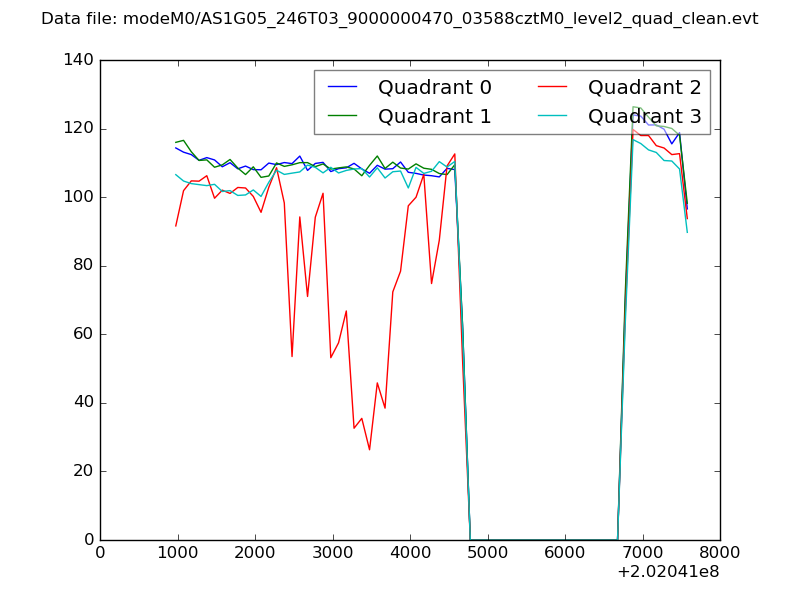 |
|
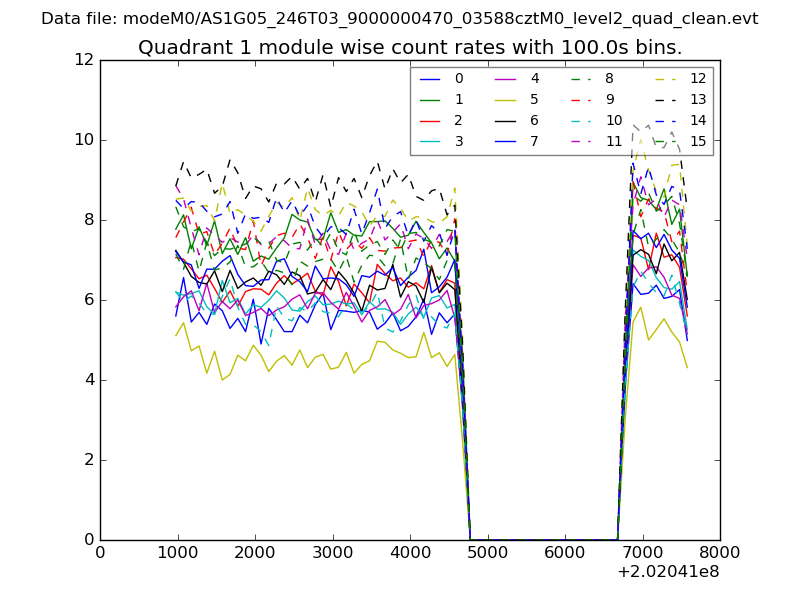
| Module-wise count rates for Quadrant A Data is divided into 100 sec bins |
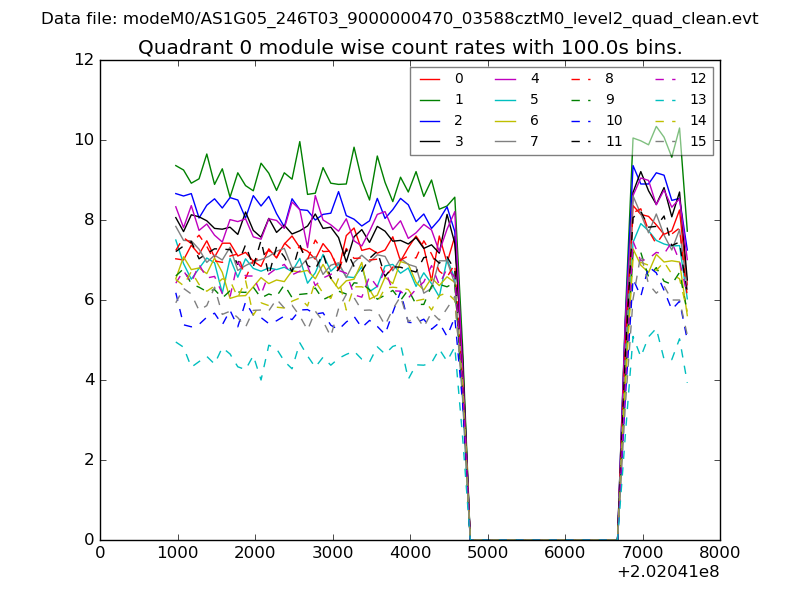 |
 |
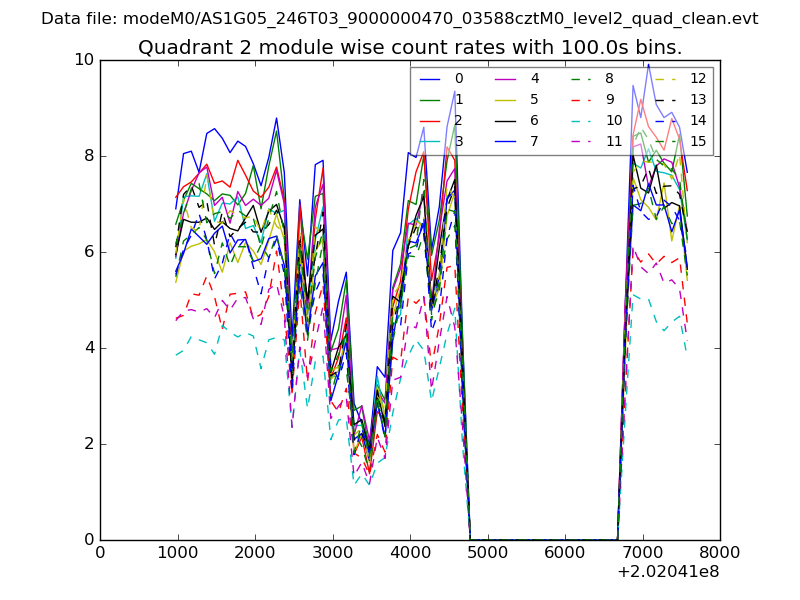
| Module-wise count rates for Quadrant B Data is divided into 100 sec bins |
 |
 |
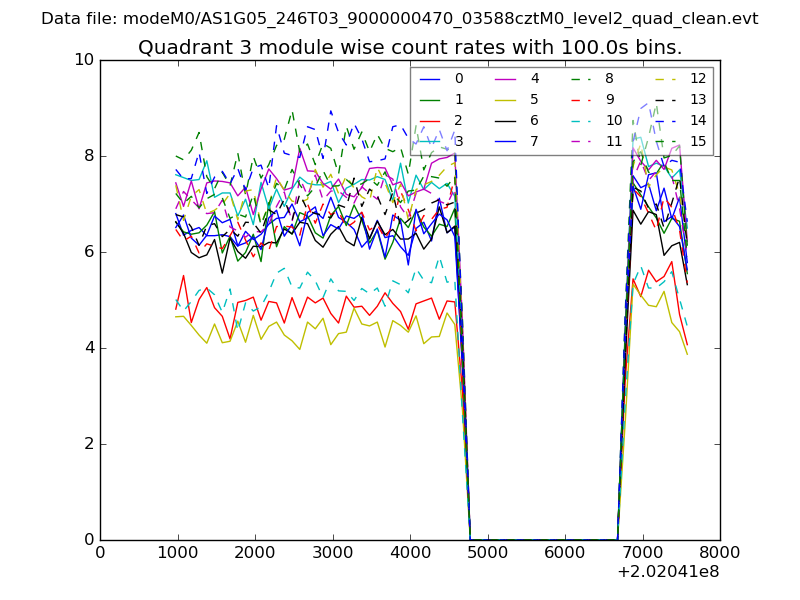
| Module-wise count rates for Quadrant C Data is divided into 100 sec bins |
 |
 |
| Module-wise count rates for Quadrant D Data is divided into 100 sec bins |
 |
 |
| Parameter | Plot |
|---|---|
| CZT HV Monitor | 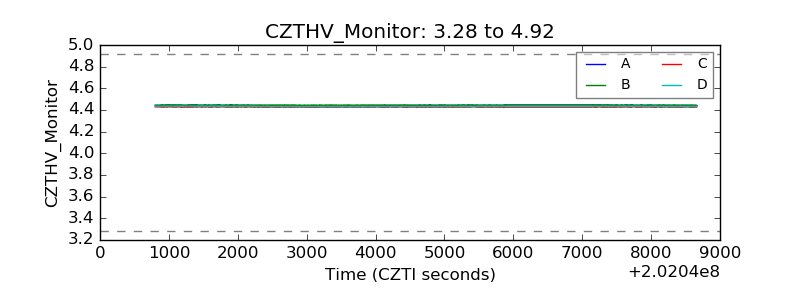 |
| D_VDD | 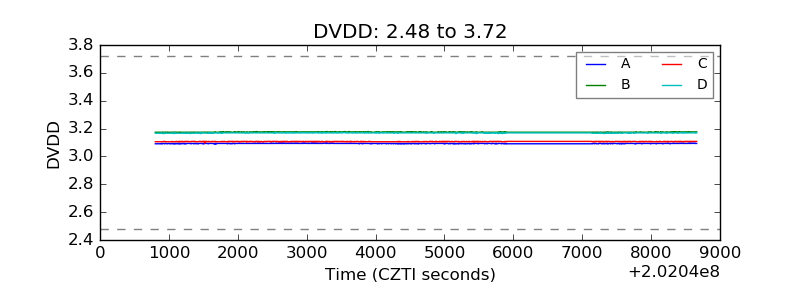 |
| Temperature 1 | 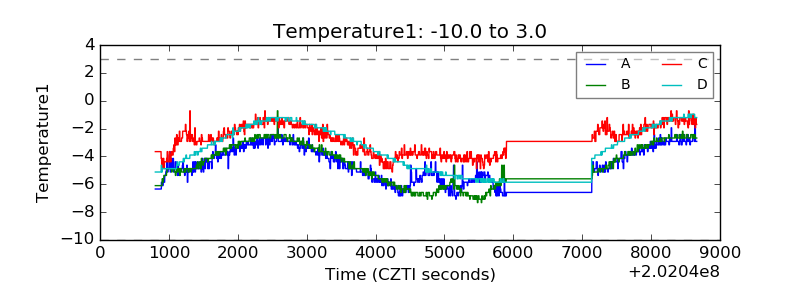 |
| Veto HV Monitor | 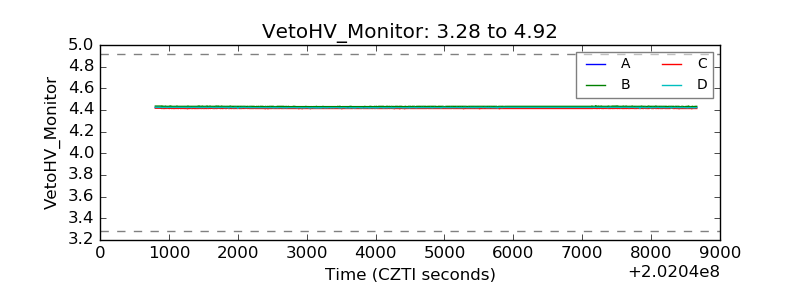 |
| Veto LLD |  |
| Alpha Counter | 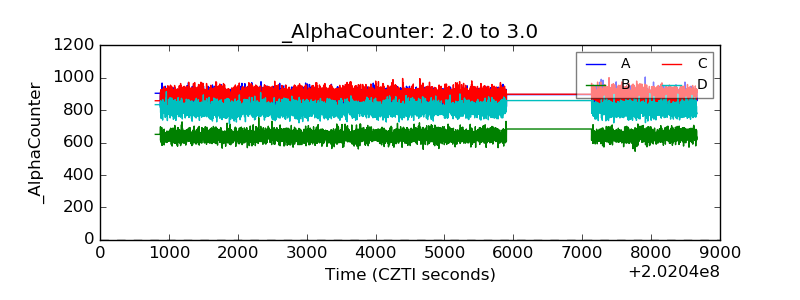 |
| _CPM_Rate | 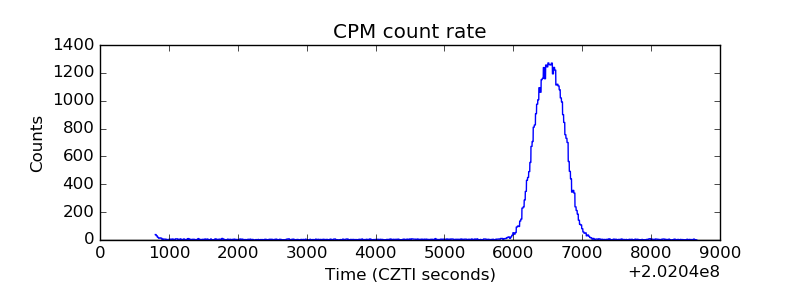 |
| CZT Counter | 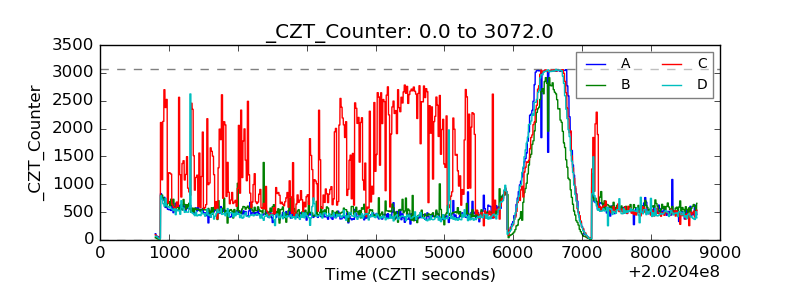 |
| +2.5 Volts monitor |  |
| +5 Volts monitor |  |
| Veto Counter | 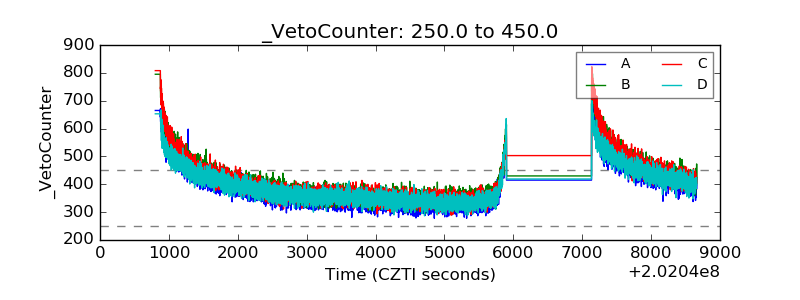 |