| Param | Original file | Final file |
|---|---|---|
| Filename | modeM0/AS1G05_246T03_9000000470_03589cztM0_level2.evt | modeM0/AS1G05_246T03_9000000470_03589cztM0_level2_quad_clean.evt |
| Size (bytes) | 424,998,720 | 87,514,560 |
| Size | 405.3 MB | 83.5 MB |
| Events in quadrant A | 3,105,597 | 564,894 |
| Events in quadrant B | 3,334,546 | 568,174 |
| Events in quadrant C | 2,837,947 | 562,725 |
| Events in quadrant D | 3,191,252 | 541,570 |
| Mode SS | |||
|---|---|---|---|
| Quadrant | BADHDUFLAG | Total packets | Discarded packets |
| A | 0 | 122 | 0 |
| B | 0 | 122 | 0 |
| C | 0 | 122 | 0 |
| D | 0 | 122 | 0 |
| Mode M0 | |||
|---|---|---|---|
| Quadrant | BADHDUFLAG | Total packets | Discarded packets |
| A | 0 | 13083 | 2 |
| B | 0 | 13744 | 1 |
| C | 0 | 12259 | 1 |
| D | 0 | 13464 | 1 |
| Mode M9 | |||
|---|---|---|---|
| Quadrant | BADHDUFLAG | Total packets | Discarded packets |
| A | 0 | 12 | 0 |
| B | 0 | 12 | 0 |
| C | 0 | 12 | 0 |
| D | 0 | 12 | 0 |
| Quadrant | Total seconds | Saturated seconds | Saturation percentage |
|---|---|---|---|
| A | 5904 | 114 | 1.930894% |
| B | 5904 | 101 | 1.710705% |
| C | 5904 | 83 | 1.405827% |
| D | 5904 | 210 | 3.556911% |
Noise dominated data is calculated using 1-second bins in cleaned event files. If a bin has >2000 counts, and if more than 50% of those come from <1% of pixels, then it is considered to be noise-dominated and hence unusable.
| Quadrant | # 1 sec bins | Bins with >0 counts | Bins with >2000 counts | High rate bins dominated by noise | Noise dominated (total time) | Noise dominated (detector-on time) | Marked lightcurve |
|---|---|---|---|---|---|---|---|
| A | 7174 | 5904 | 12 | 12 | 0.17% | 0.20% | 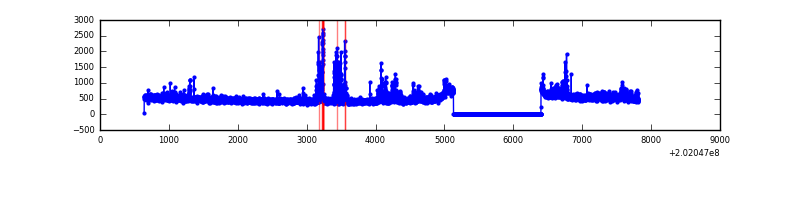 |
| B | 7174 | 5904 | 2 | 2 | 0.03% | 0.03% | 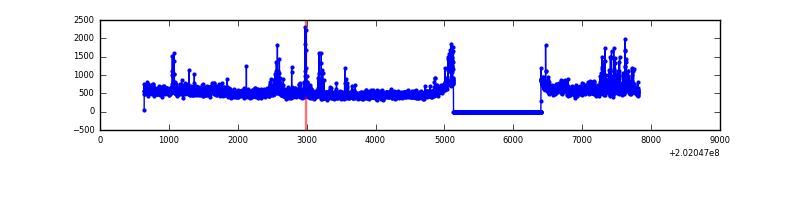 |
| C | 7174 | 5904 | 2 | 2 | 0.03% | 0.03% | 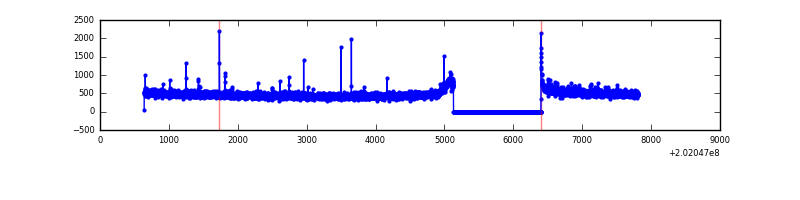 |
| D | 7174 | 5904 | 114 | 114 | 1.59% | 1.93% | 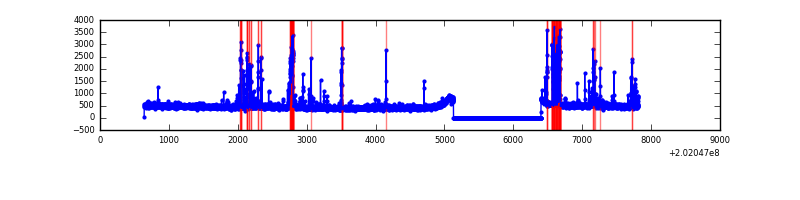 |
Top three noisy pixels from each quadrant. If the there are fewer than three noisy pixels in the level2.evt file, extra rows are filled as -1
| Pixel properties | Quadrant properties | ||||||
|---|---|---|---|---|---|---|---|
| Quadrant | DetID | PixID | Counts | Sigma | Mean | Median | Sigma |
| A | 13 | 164 | 125817 | 838.36 | 730 | 713 | 149.2 |
| A | 8 | 15 | 88034 | 585.16 | 730 | 713 | 149.2 |
| A | 0 | 50 | 60549 | 400.98 | 730 | 713 | 149.2 |
| B | 15 | 204 | 283488 | 2007.9 | 729 | 712 | 140.8 |
| B | 4 | 81 | 97734 | 688.92 | 729 | 712 | 140.8 |
| B | 0 | 243 | 53158 | 372.4 | 729 | 712 | 140.8 |
| C | 2 | 53 | 20804 | 122.08 | 712 | 716 | 164.5 |
| C | 1 | 16 | 20743 | 121.71 | 712 | 716 | 164.5 |
| C | 14 | 48 | 6658 | 36.11 | 712 | 716 | 164.5 |
| D | 13 | 223 | 251843 | 1510.01 | 704 | 684 | 166.3 |
| D | 14 | 34 | 225571 | 1352.06 | 704 | 684 | 166.3 |
| D | 1 | 84 | 15583 | 89.58 | 704 | 684 | 166.3 |
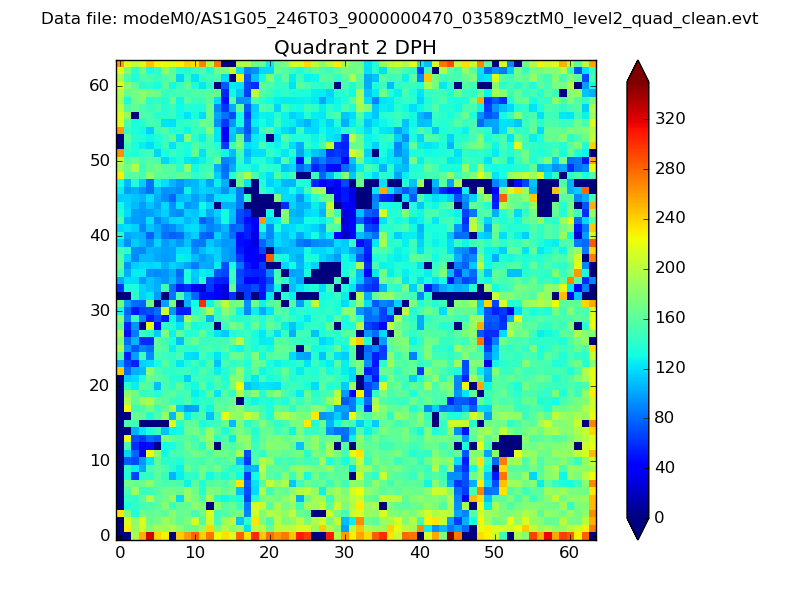
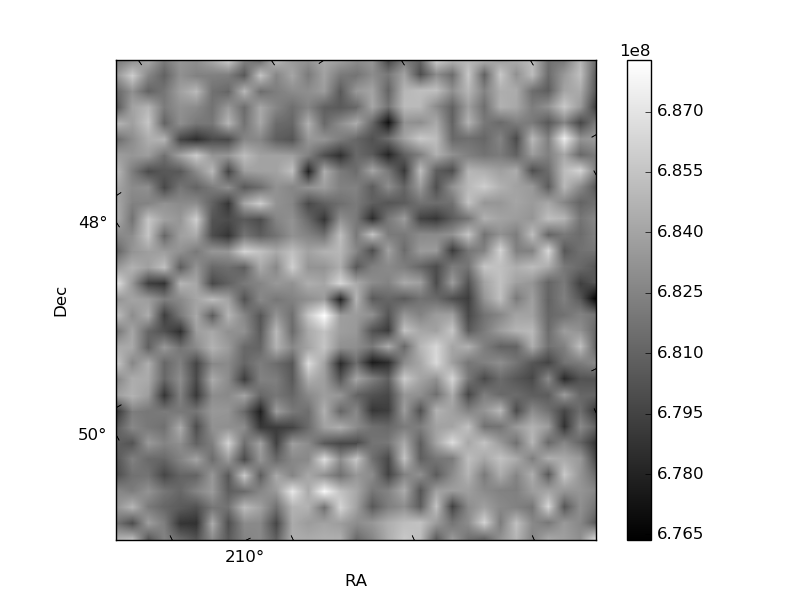
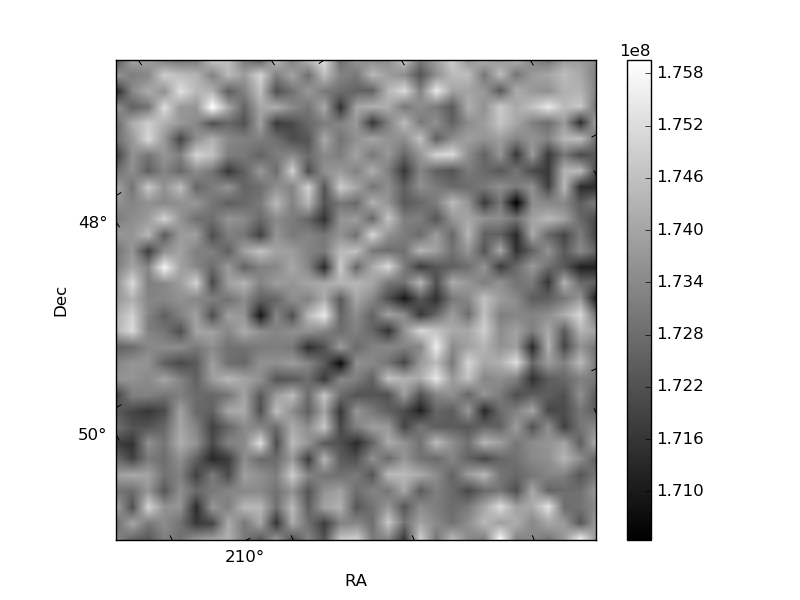
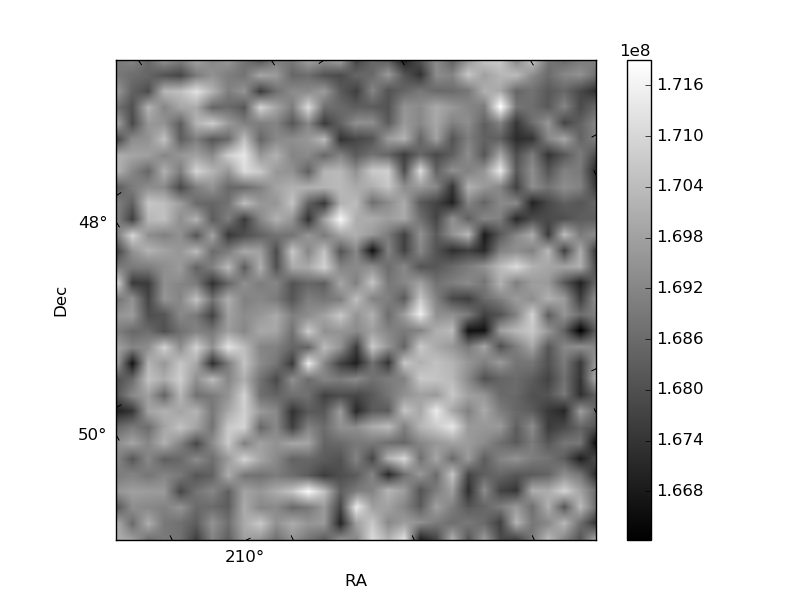
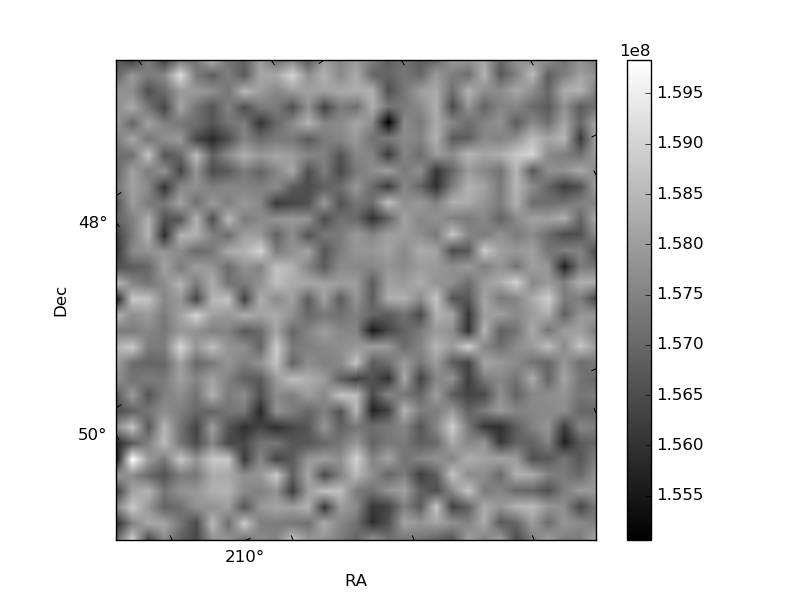
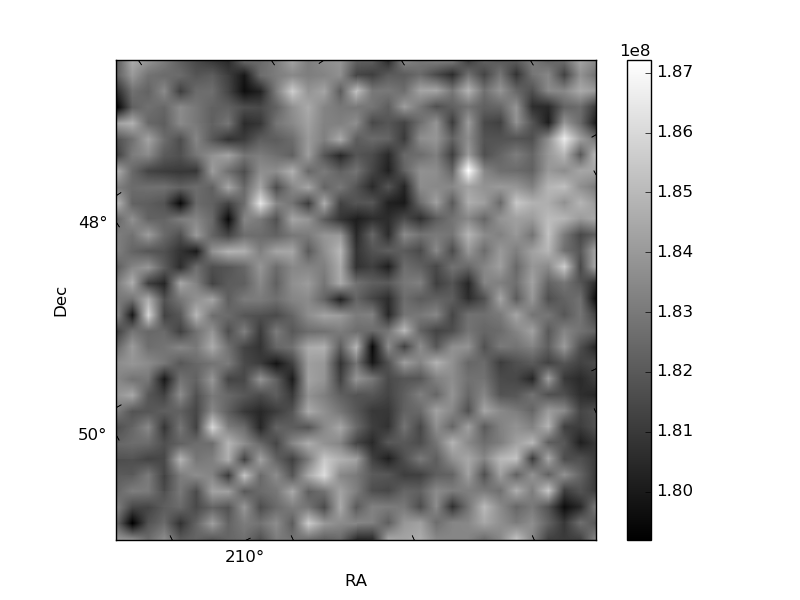
Histogram calculated using DETX and DETY for each event in the final _common_clean file
| Quadrant A | 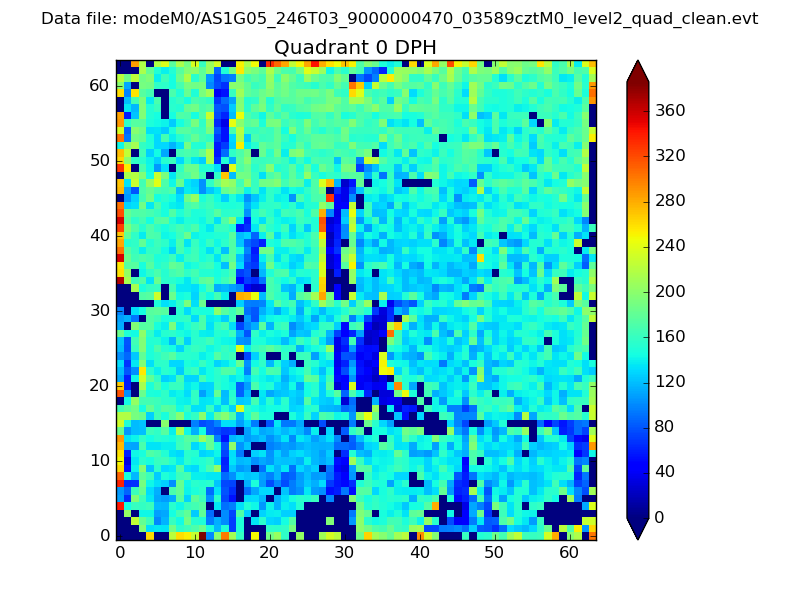 |
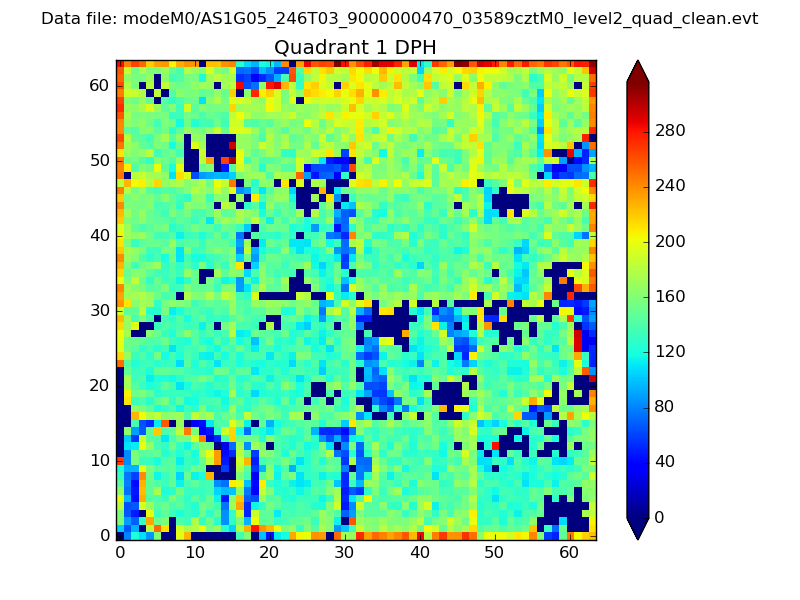 |
Quadrant B |
|---|---|---|---|
| Quadrant D | 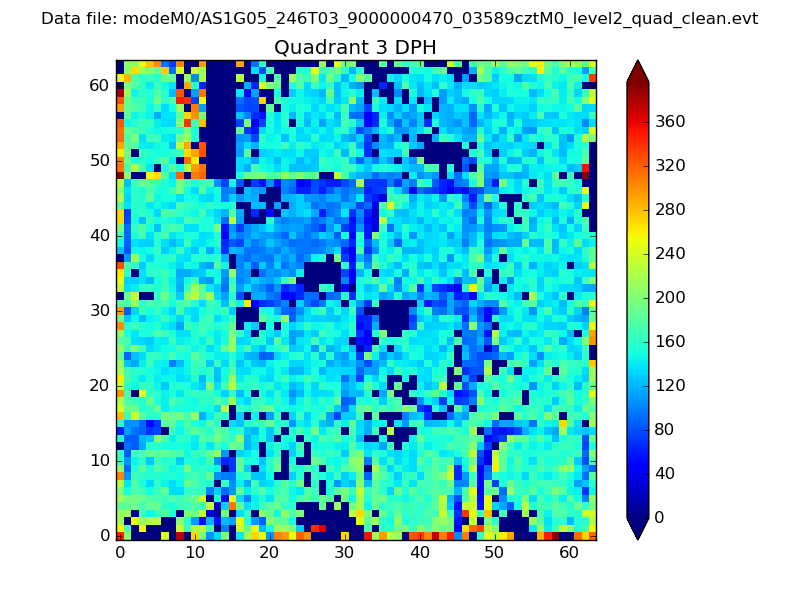 |
 |
Quadrant C |
| Plot type | Count rate plots | Images |
|---|---|---|
| Comparison with Poisson distribution Blue bars denote a histogram of data divided into 1 sec bins. Red curve is a Poisson curve with rate = median count rate of data. |
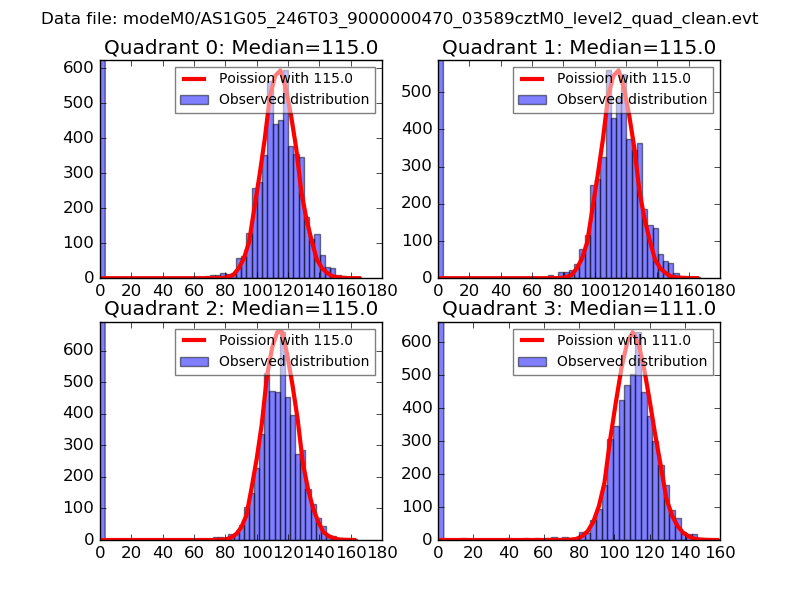 |
 |
| Quadrant-wise count rates Data is divided into 100 sec bins |
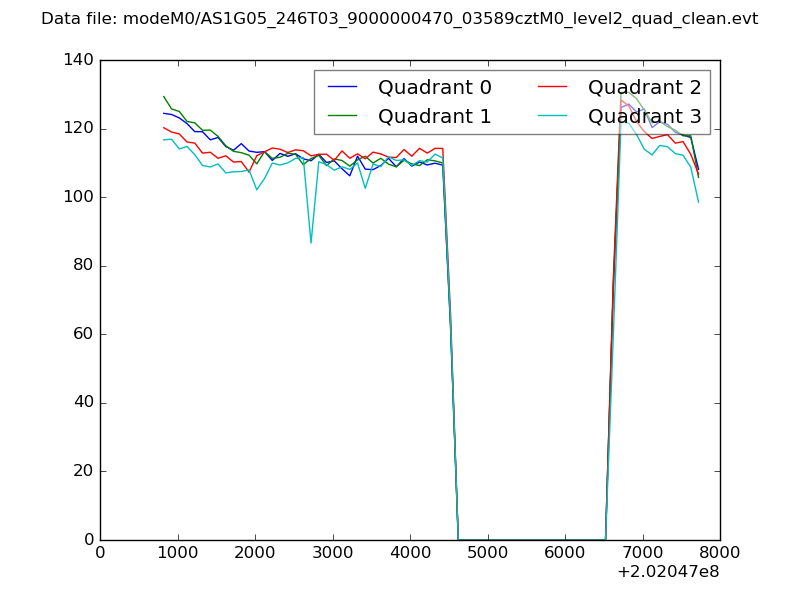 |
|
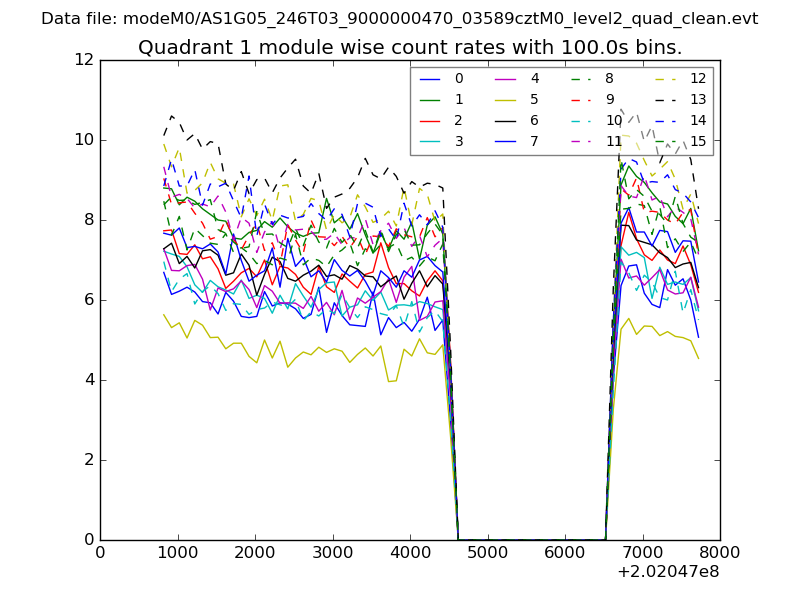
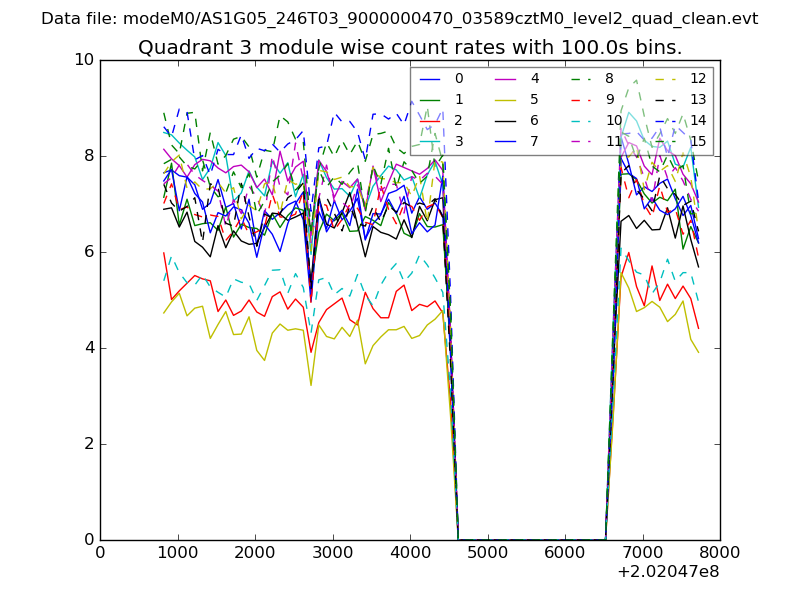
| Module-wise count rates for Quadrant A Data is divided into 100 sec bins |
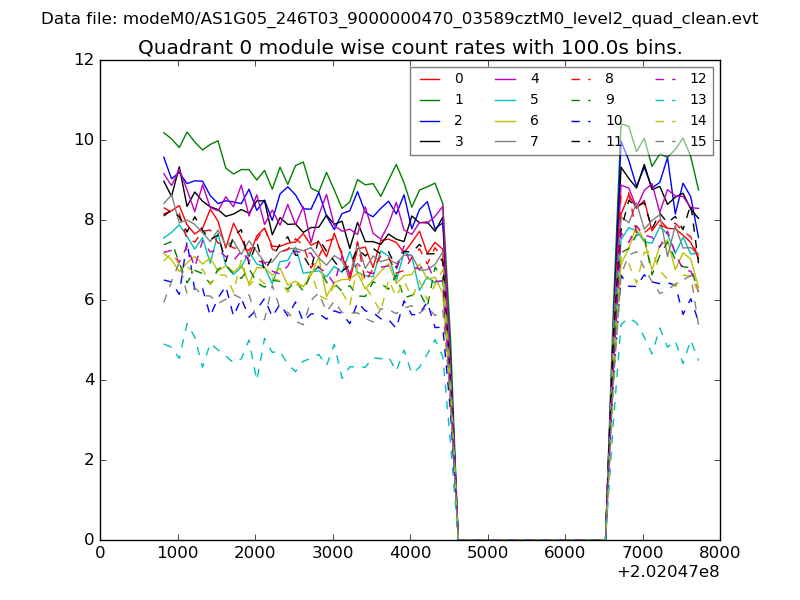 |
 |
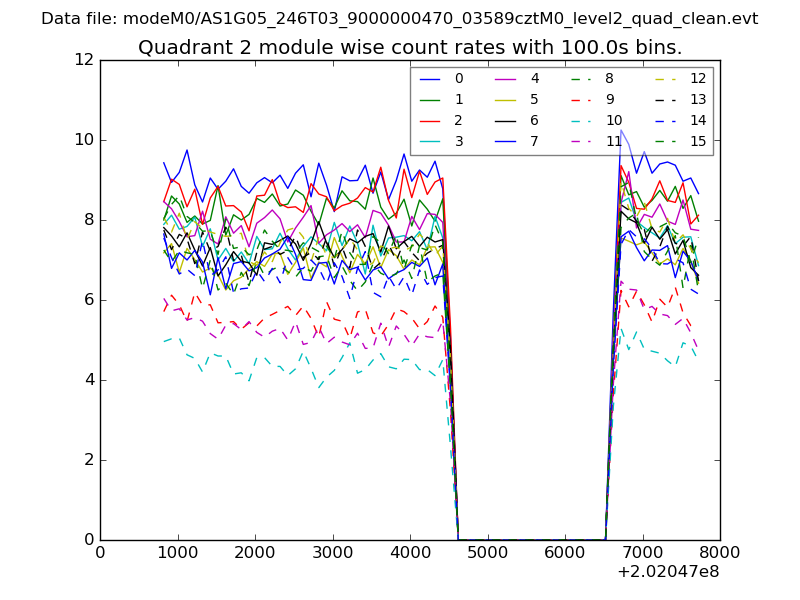
| Module-wise count rates for Quadrant B Data is divided into 100 sec bins |
 |
 |
| Module-wise count rates for Quadrant C Data is divided into 100 sec bins |
 |
 |
| Module-wise count rates for Quadrant D Data is divided into 100 sec bins |
 |
 |
| Parameter | Plot |
|---|---|
| CZT HV Monitor | 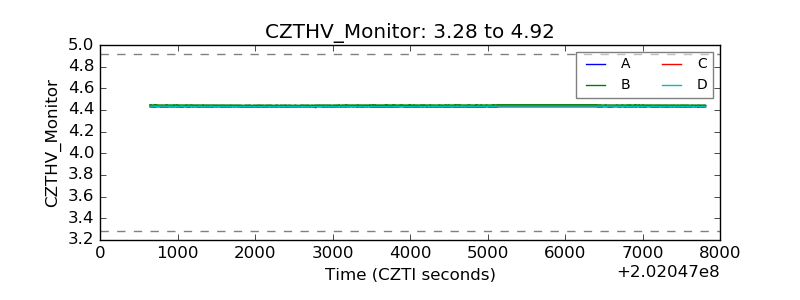 |
| D_VDD | 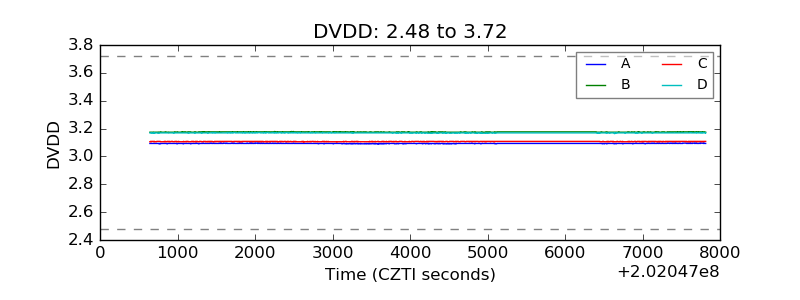 |
| Temperature 1 | 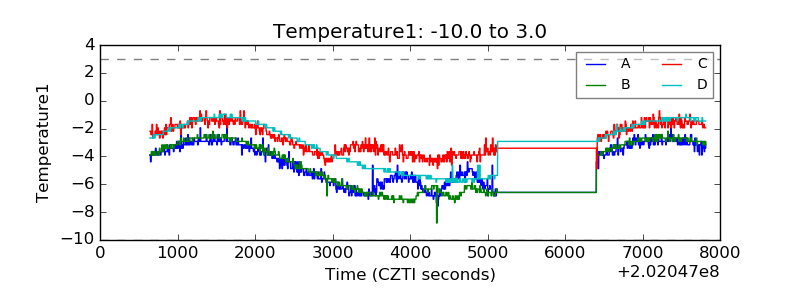 |
| Veto HV Monitor | 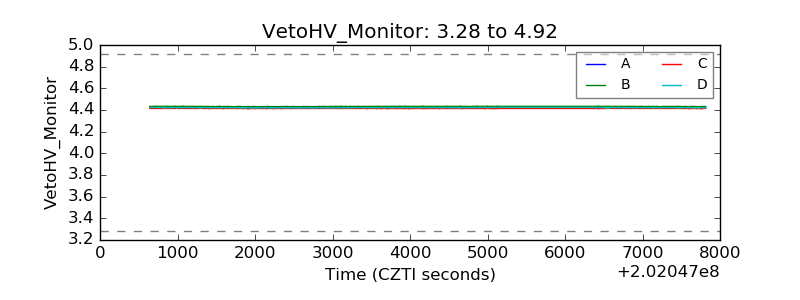 |
| Veto LLD | 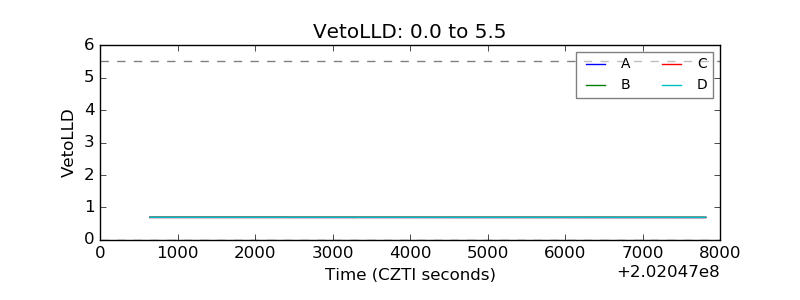 |
| Alpha Counter | 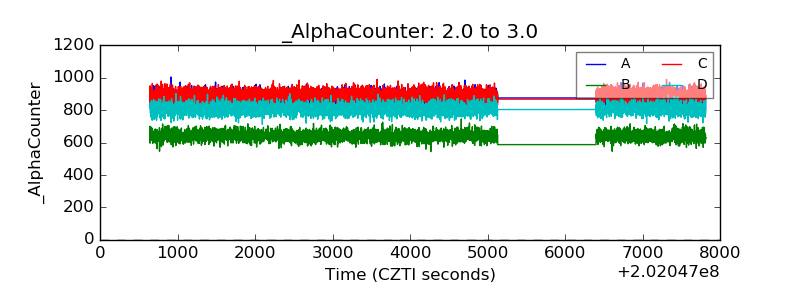 |
| _CPM_Rate | 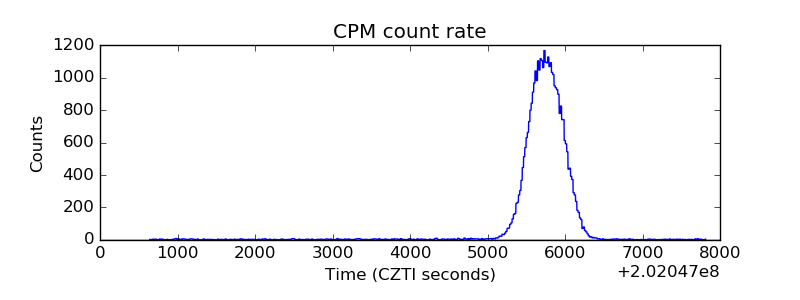 |
| CZT Counter | 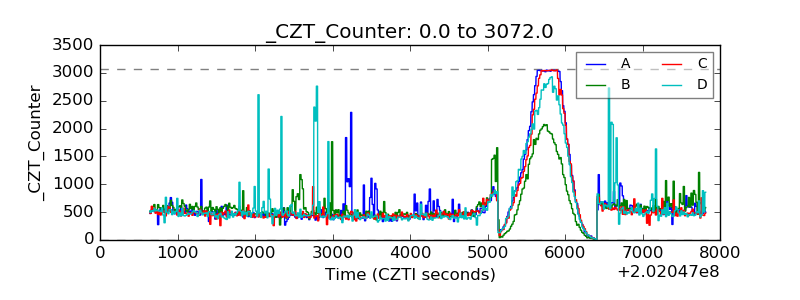 |
| +2.5 Volts monitor |  |
| +5 Volts monitor |  |
| _ROLL_ROT | 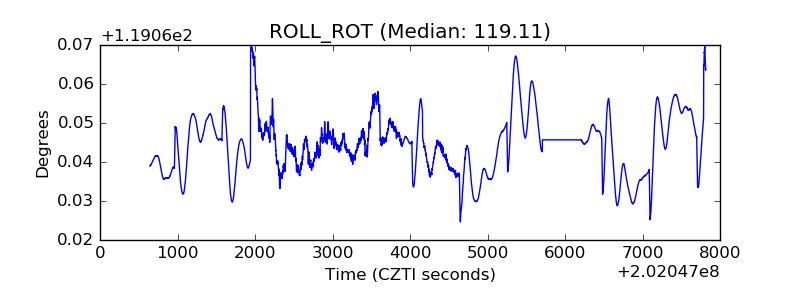 |
| _Roll_DEC | 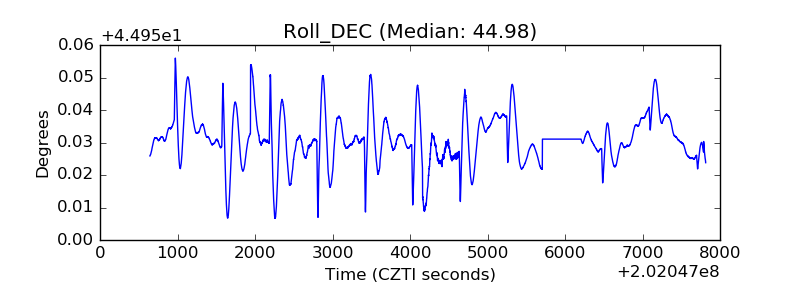 |
| _Roll_RA | 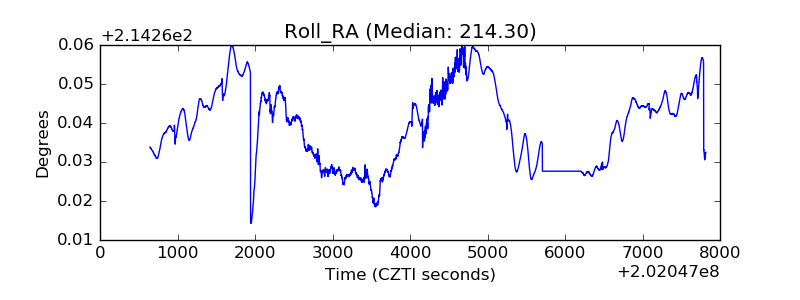 |
| Veto Counter | 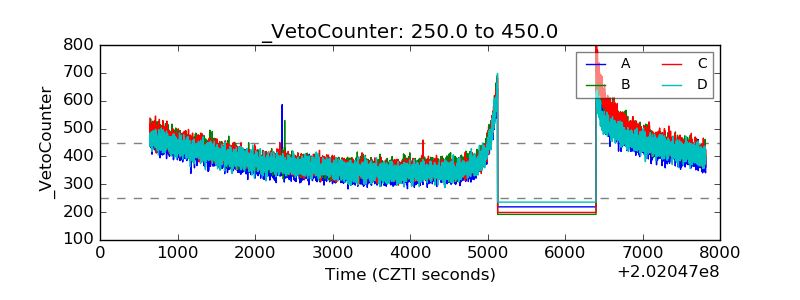 |