| Param | Original file | Final file |
|---|---|---|
| Filename | modeM0/AS1G05_246T03_9000000470_03590cztM0_level2.evt | modeM0/AS1G05_246T03_9000000470_03590cztM0_level2_quad_clean.evt |
| Size (bytes) | 456,511,680 | 93,159,360 |
| Size | 435.4 MB | 88.8 MB |
| Events in quadrant A | 3,293,997 | 597,381 |
| Events in quadrant B | 3,702,825 | 599,844 |
| Events in quadrant C | 3,127,816 | 598,634 |
| Events in quadrant D | 3,264,792 | 577,848 |
| Mode SS | |||
|---|---|---|---|
| Quadrant | BADHDUFLAG | Total packets | Discarded packets |
| A | 0 | 130 | 0 |
| B | 0 | 130 | 0 |
| C | 0 | 130 | 0 |
| D | 0 | 130 | 0 |
| Mode M0 | |||
|---|---|---|---|
| Quadrant | BADHDUFLAG | Total packets | Discarded packets |
| A | 0 | 14144 | 3 |
| B | 0 | 15357 | 2 |
| C | 0 | 13486 | 2 |
| D | 0 | 14183 | 2 |
| Mode M9 | |||
|---|---|---|---|
| Quadrant | BADHDUFLAG | Total packets | Discarded packets |
| A | 0 | 13 | 0 |
| B | 0 | 13 | 0 |
| C | 0 | 13 | 0 |
| D | 0 | 14 | 0 |
| Quadrant | Total seconds | Saturated seconds | Saturation percentage |
|---|---|---|---|
| A | 6416 | 143 | 2.228803% |
| B | 6416 | 155 | 2.415835% |
| C | 6416 | 117 | 1.823566% |
| D | 6416 | 170 | 2.649626% |
Noise dominated data is calculated using 1-second bins in cleaned event files. If a bin has >2000 counts, and if more than 50% of those come from <1% of pixels, then it is considered to be noise-dominated and hence unusable.
| Quadrant | # 1 sec bins | Bins with >0 counts | Bins with >2000 counts | High rate bins dominated by noise | Noise dominated (total time) | Noise dominated (detector-on time) | Marked lightcurve |
|---|---|---|---|---|---|---|---|
| A | 7630 | 6416 | 4 | 4 | 0.05% | 0.06% | 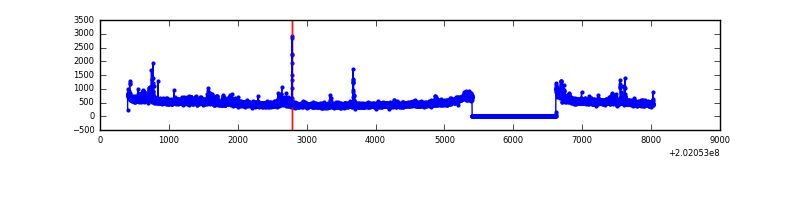 |
| B | 7630 | 6416 | 18 | 18 | 0.24% | 0.28% | 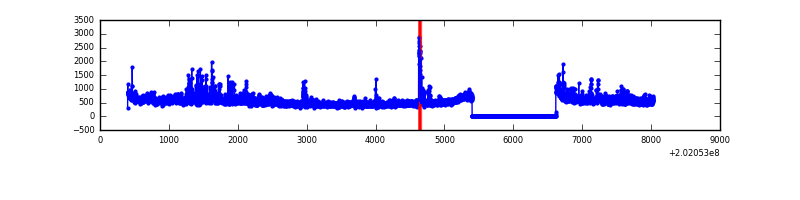 |
| C | 7630 | 6416 | 4 | 4 | 0.05% | 0.06% | 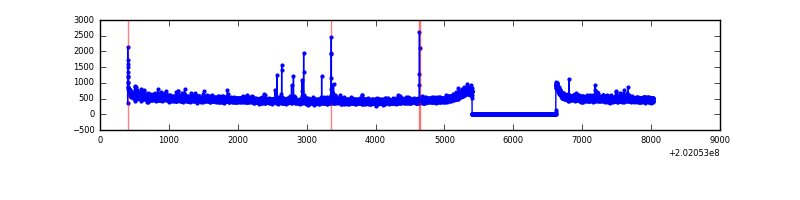 |
| D | 7630 | 6416 | 62 | 62 | 0.81% | 0.97% | 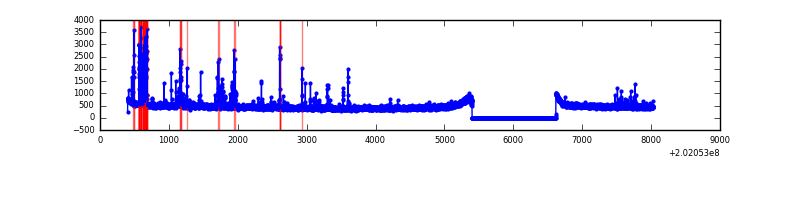 |
Top three noisy pixels from each quadrant. If the there are fewer than three noisy pixels in the level2.evt file, extra rows are filled as -1
| Pixel properties | Quadrant properties | ||||||
|---|---|---|---|---|---|---|---|
| Quadrant | DetID | PixID | Counts | Sigma | Mean | Median | Sigma |
| A | 8 | 15 | 174924 | 1085.8 | 792 | 774 | 160.4 |
| A | 15 | 234 | 19747 | 118.29 | 792 | 774 | 160.4 |
| A | 0 | 50 | 18808 | 112.44 | 792 | 774 | 160.4 |
| B | 15 | 204 | 346582 | 2242.9 | 796 | 777 | 154.2 |
| B | 4 | 81 | 149119 | 962.15 | 796 | 777 | 154.2 |
| B | 0 | 228 | 72292 | 463.85 | 796 | 777 | 154.2 |
| C | 1 | 16 | 30874 | 166.66 | 779 | 783 | 180.6 |
| C | 2 | 53 | 27321 | 146.98 | 779 | 783 | 180.6 |
| C | 14 | 48 | 10993 | 56.55 | 779 | 783 | 180.6 |
| D | 14 | 34 | 225463 | 1217.82 | 774 | 750 | 184.5 |
| D | 13 | 223 | 68720 | 368.36 | 774 | 750 | 184.5 |
| D | 2 | 14 | 14314 | 73.51 | 774 | 750 | 184.5 |
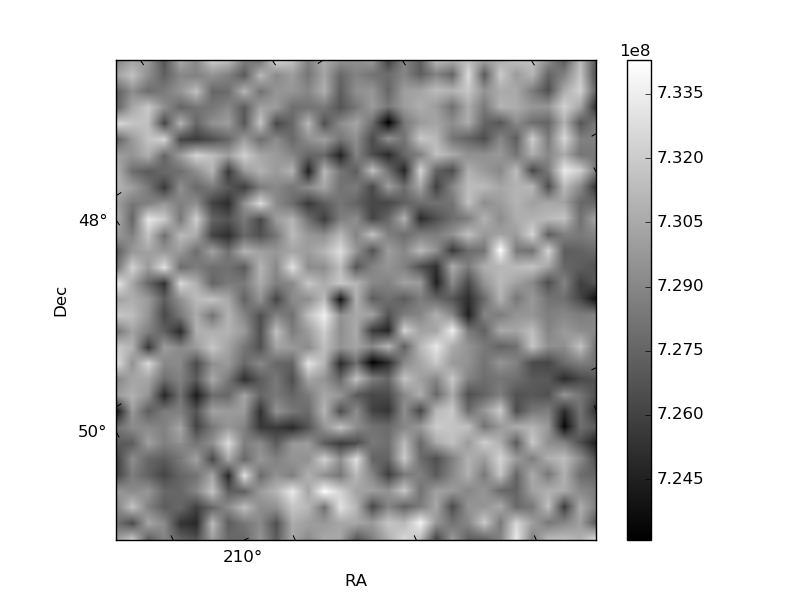
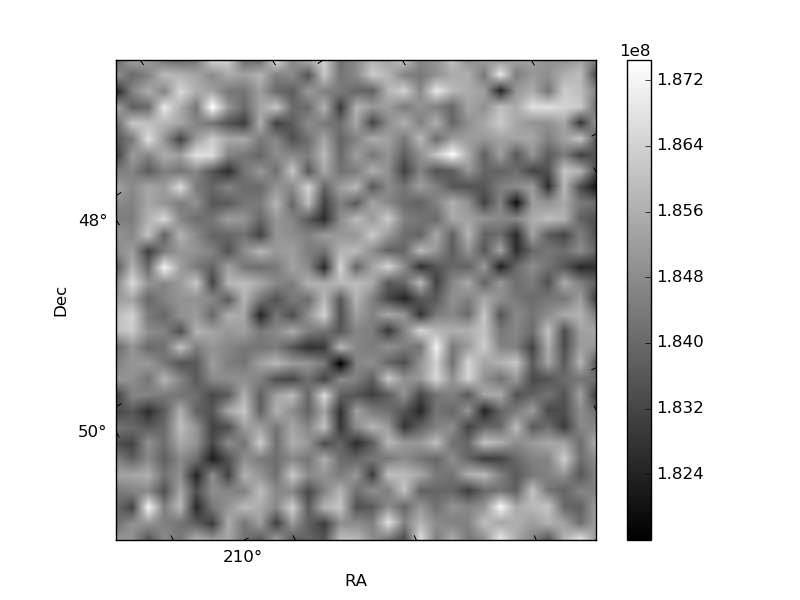
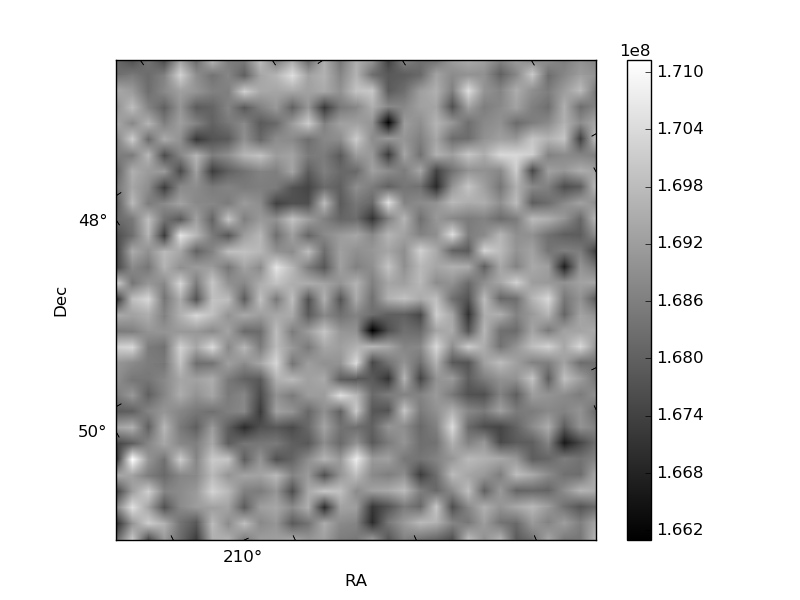
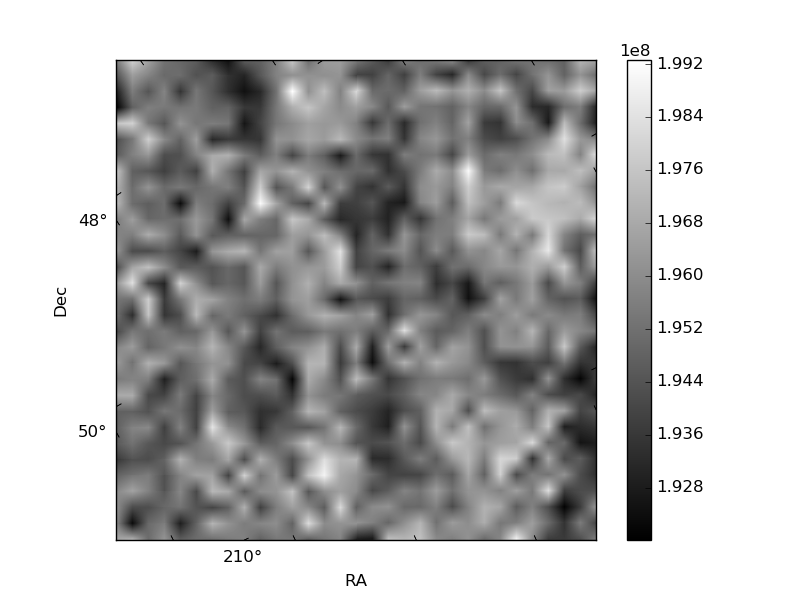
Histogram calculated using DETX and DETY for each event in the final _common_clean file
| Quadrant A | 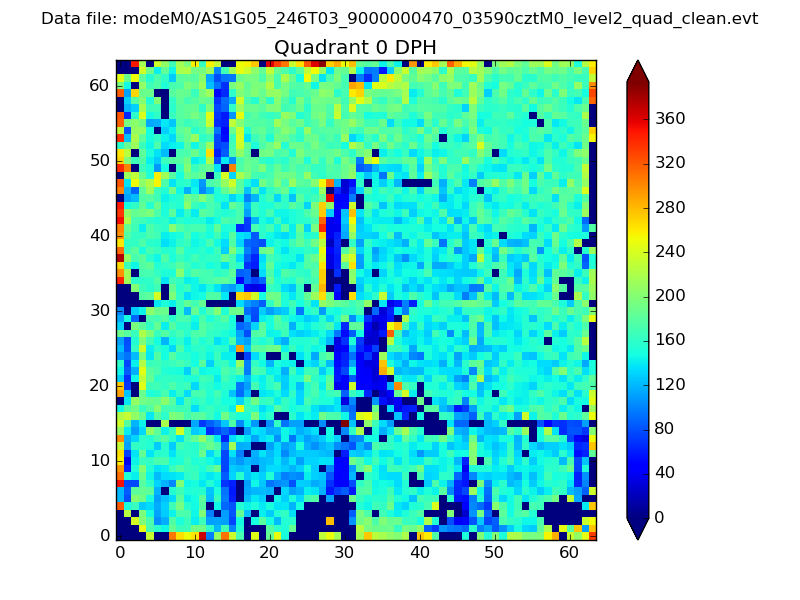 |
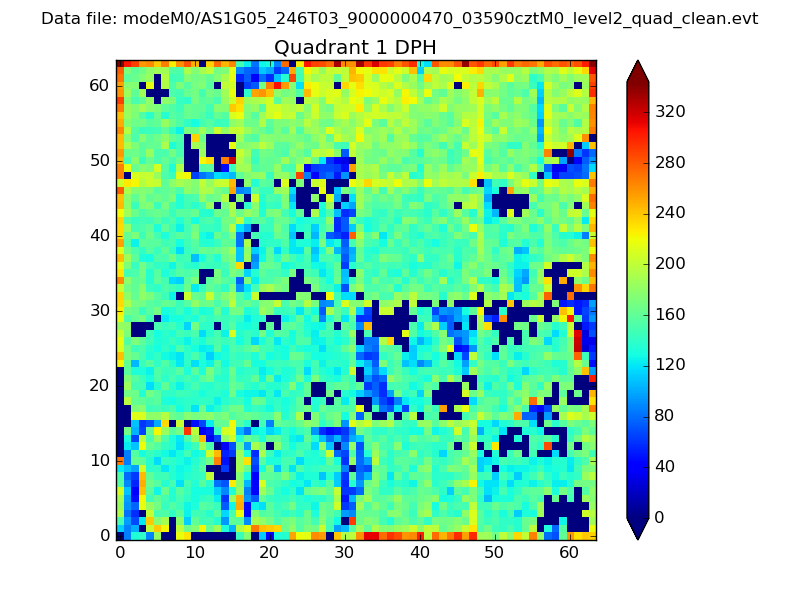 |
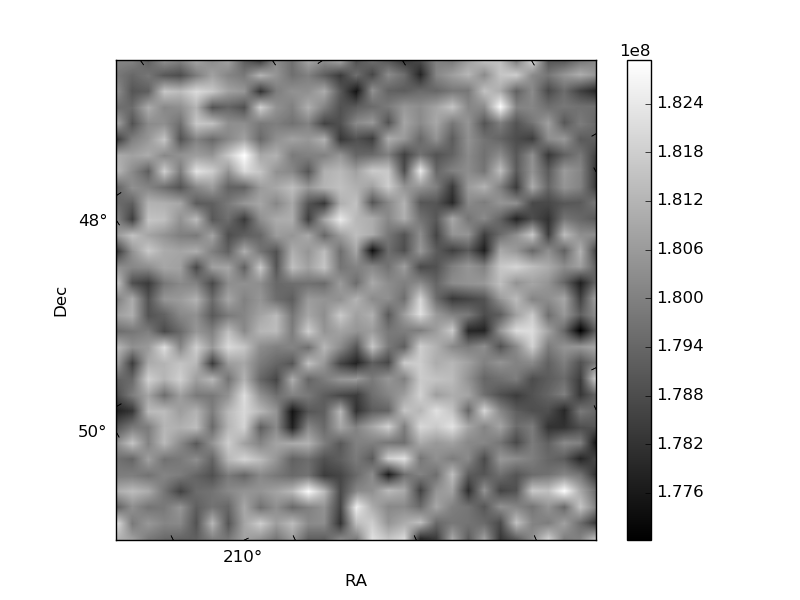
Quadrant B |
|---|---|---|---|
| Quadrant D | 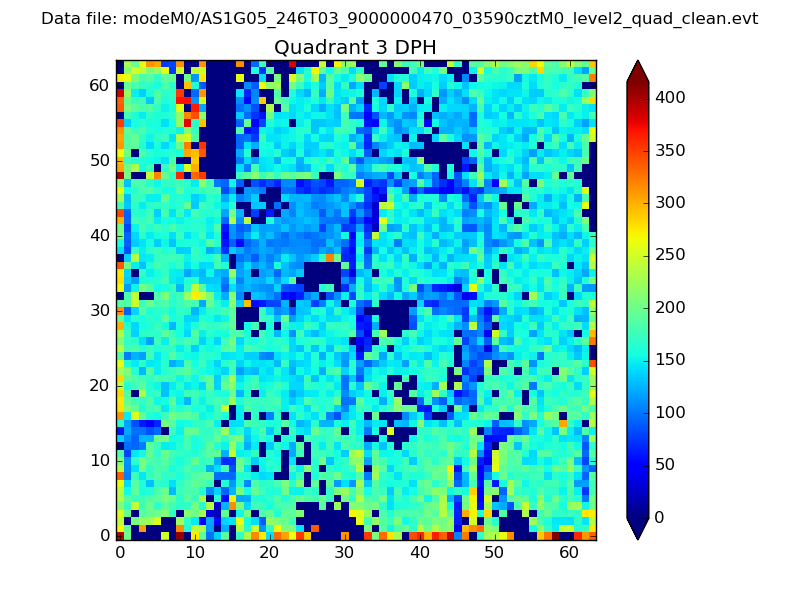 |
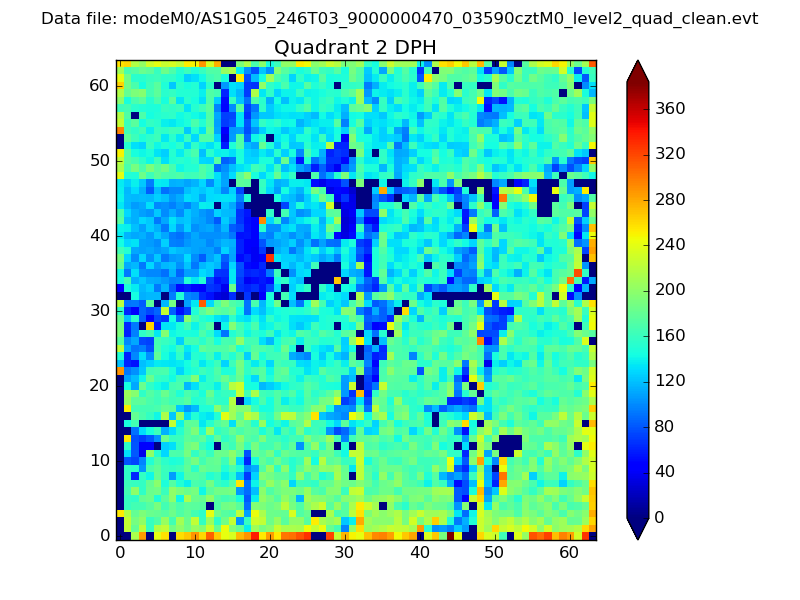 |
Quadrant C |
| Plot type | Count rate plots | Images |
|---|---|---|
| Comparison with Poisson distribution Blue bars denote a histogram of data divided into 1 sec bins. Red curve is a Poisson curve with rate = median count rate of data. |
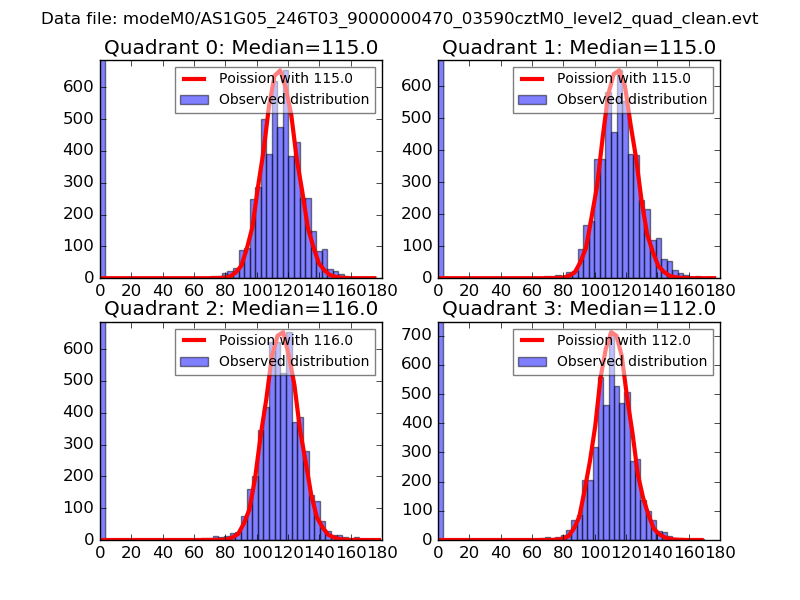 |
 |
| Quadrant-wise count rates Data is divided into 100 sec bins |
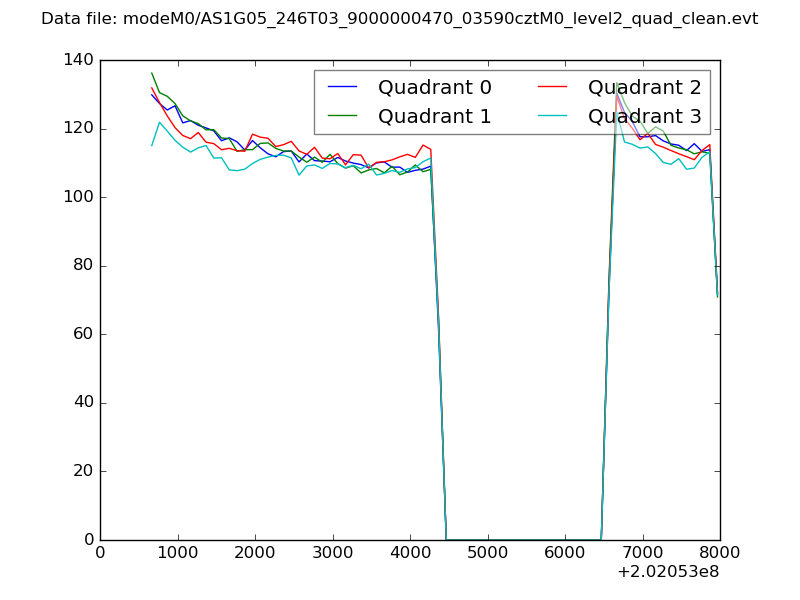 |
|
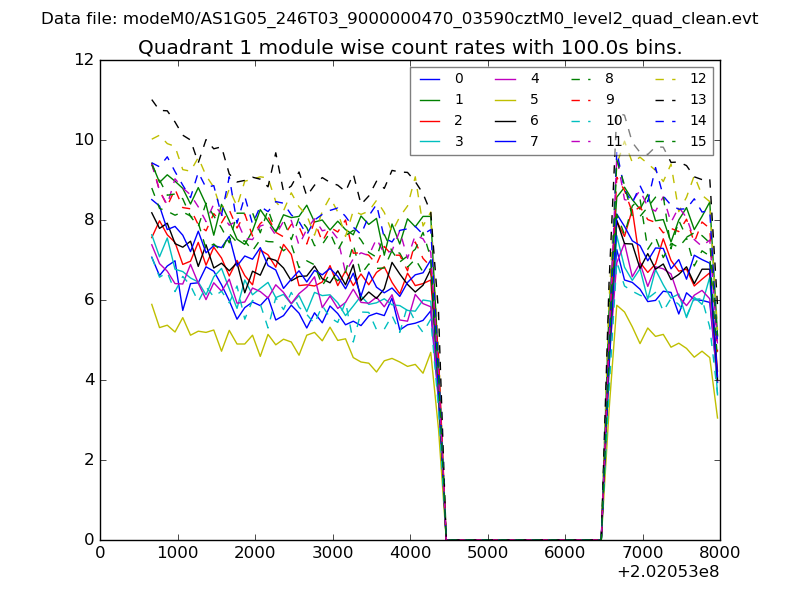
| Module-wise count rates for Quadrant A Data is divided into 100 sec bins |
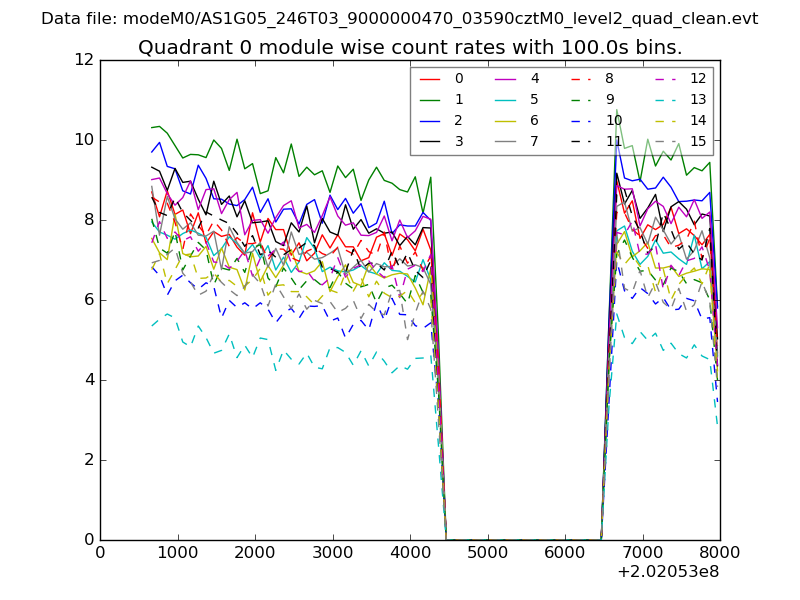 |
 |
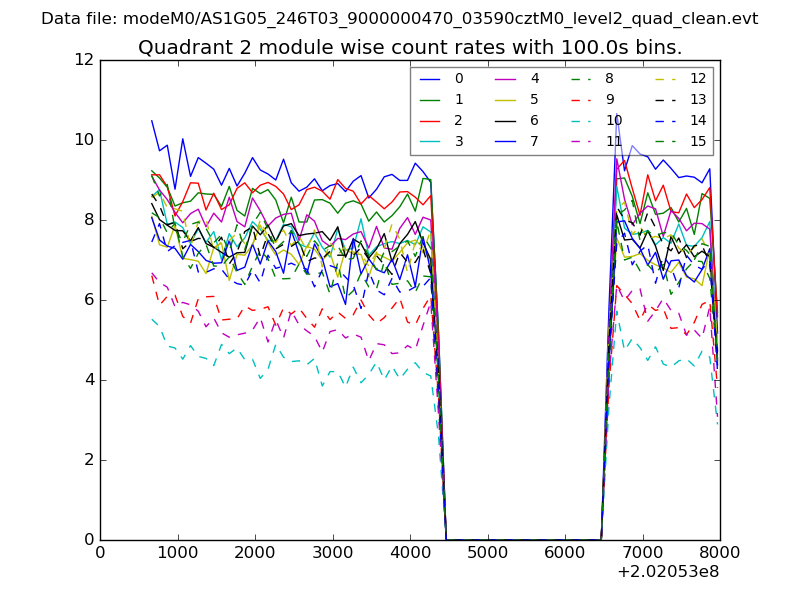
| Module-wise count rates for Quadrant B Data is divided into 100 sec bins |
 |
 |
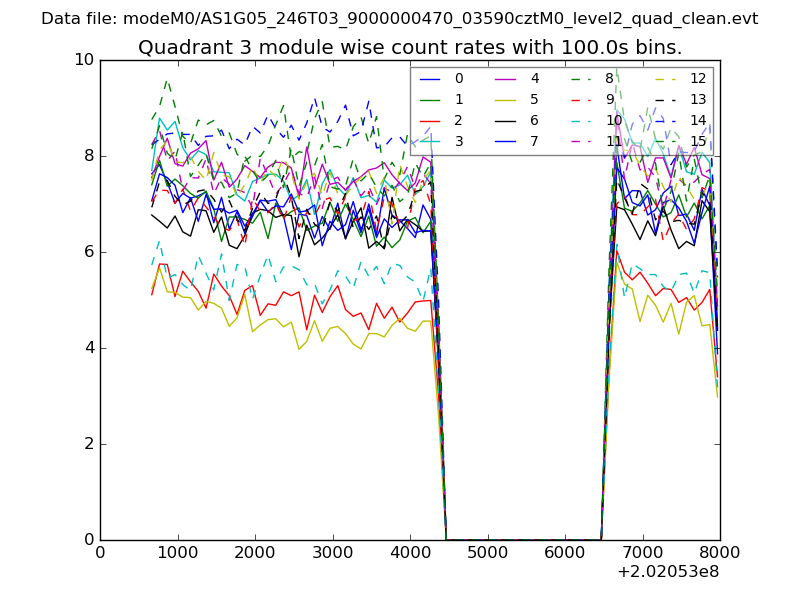
| Module-wise count rates for Quadrant C Data is divided into 100 sec bins |
 |
 |
| Module-wise count rates for Quadrant D Data is divided into 100 sec bins |
 |
 |
| Parameter | Plot |
|---|---|
| CZT HV Monitor | 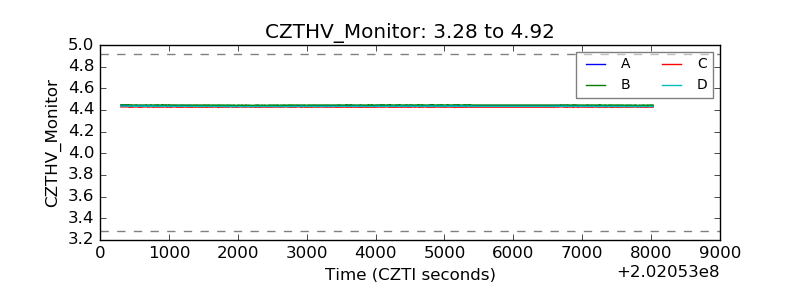 |
| D_VDD | 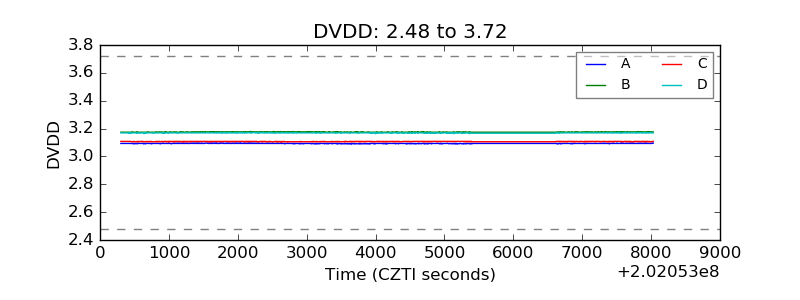 |
| Temperature 1 | 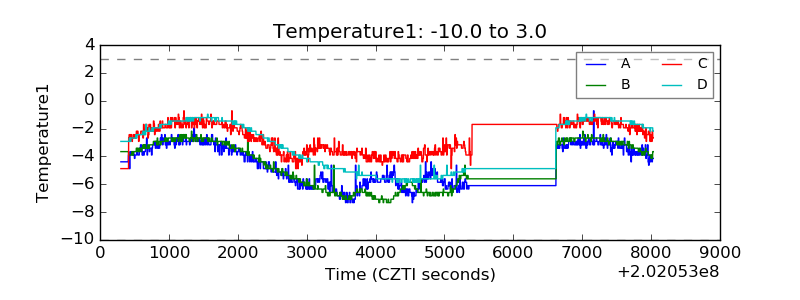 |
| Veto HV Monitor | 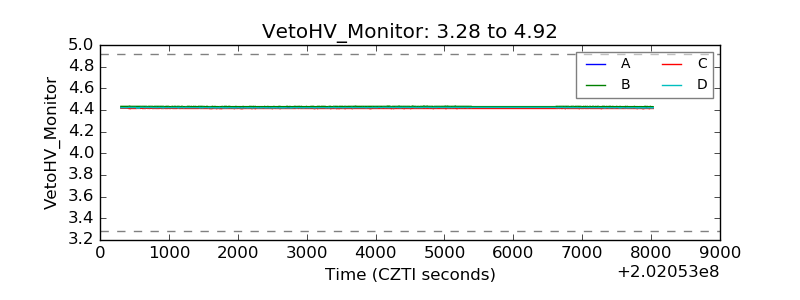 |
| Veto LLD |  |
| Alpha Counter | 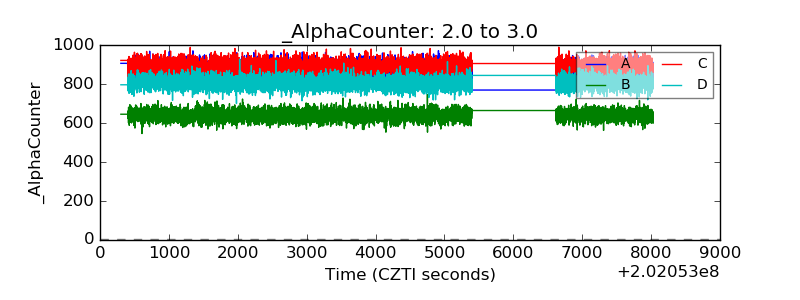 |
| _CPM_Rate | 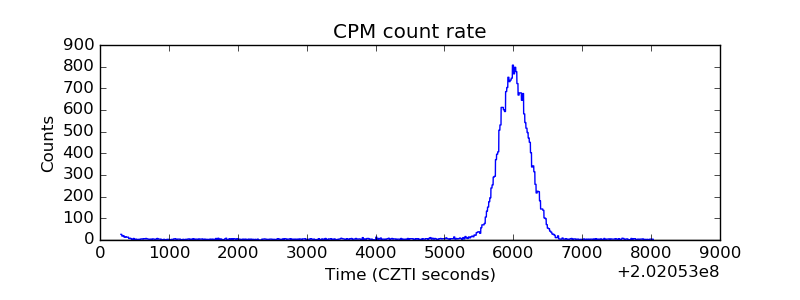 |
| CZT Counter |  |
| +2.5 Volts monitor |  |
| +5 Volts monitor |  |
| Veto Counter | 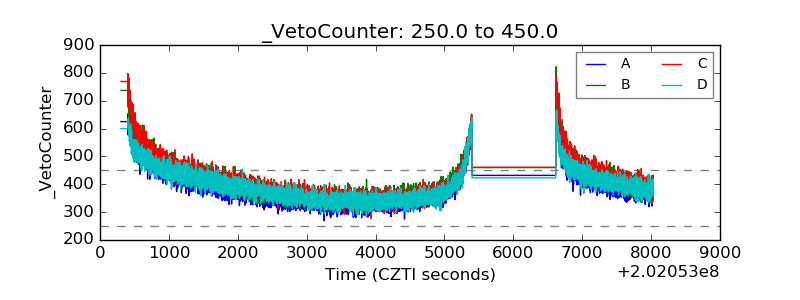 |