| Param | Original file | Final file |
|---|---|---|
| Filename | modeM0/AS1G05_246T03_9000000470_03591cztM0_level2.evt | modeM0/AS1G05_246T03_9000000470_03591cztM0_level2_quad_clean.evt |
| Size (bytes) | 430,165,440 | 79,626,240 |
| Size | 410.2 MB | 75.9 MB |
| Events in quadrant A | 2,805,379 | 498,184 |
| Events in quadrant B | 3,219,534 | 500,868 |
| Events in quadrant C | 3,648,598 | 504,127 |
| Events in quadrant D | 2,942,189 | 485,024 |
| Mode SS | |||
|---|---|---|---|
| Quadrant | BADHDUFLAG | Total packets | Discarded packets |
| A | 0 | 122 | 0 |
| B | 0 | 122 | 0 |
| C | 0 | 122 | 0 |
| D | 0 | 122 | 0 |
| Mode M0 | |||
|---|---|---|---|
| Quadrant | BADHDUFLAG | Total packets | Discarded packets |
| A | 0 | 12570 | 2 |
| B | 0 | 13512 | 1 |
| C | 0 | 15069 | 1 |
| D | 0 | 13206 | 1 |
| Mode M9 | |||
|---|---|---|---|
| Quadrant | BADHDUFLAG | Total packets | Discarded packets |
| A | 0 | 12 | 0 |
| B | 0 | 12 | 0 |
| C | 0 | 12 | 0 |
| D | 0 | 12 | 0 |
| Quadrant | Total seconds | Saturated seconds | Saturation percentage |
|---|---|---|---|
| A | 6060 | 72 | 1.188119% |
| B | 6060 | 69 | 1.138614% |
| C | 6060 | 336 | 5.544554% |
| D | 6060 | 164 | 2.706271% |
Noise dominated data is calculated using 1-second bins in cleaned event files. If a bin has >2000 counts, and if more than 50% of those come from <1% of pixels, then it is considered to be noise-dominated and hence unusable.
| Quadrant | # 1 sec bins | Bins with >0 counts | Bins with >2000 counts | High rate bins dominated by noise | Noise dominated (total time) | Noise dominated (detector-on time) | Marked lightcurve |
|---|---|---|---|---|---|---|---|
| A | 7205 | 6061 | 0 | 0 | 0.00% | 0.00% | 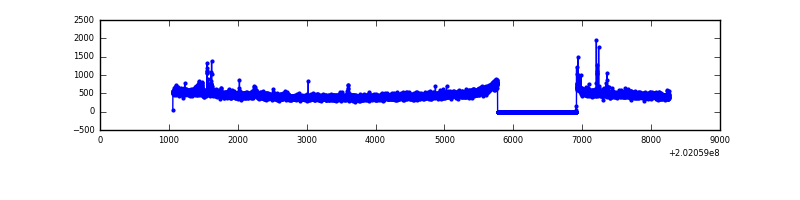 |
| B | 7205 | 6061 | 0 | 0 | 0.00% | 0.00% | 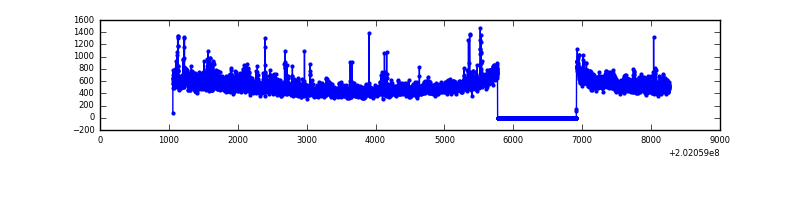 |
| C | 7205 | 6061 | 259 | 259 | 3.59% | 4.27% | 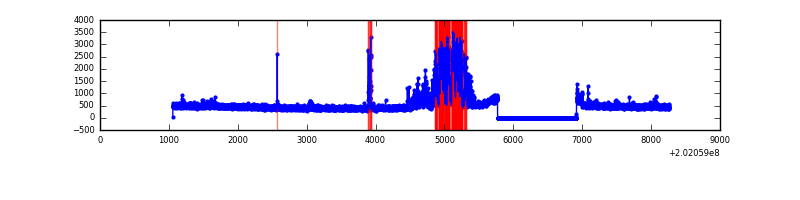 |
| D | 7205 | 6061 | 79 | 79 | 1.10% | 1.30% | 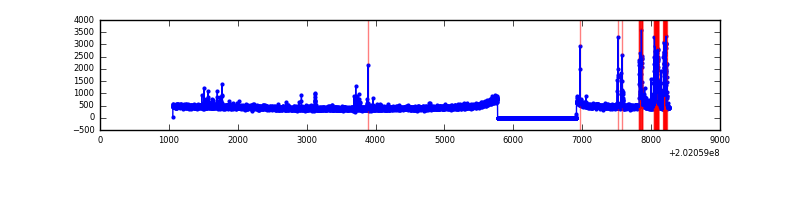 |
Top three noisy pixels from each quadrant. If the there are fewer than three noisy pixels in the level2.evt file, extra rows are filled as -1
| Pixel properties | Quadrant properties | ||||||
|---|---|---|---|---|---|---|---|
| Quadrant | DetID | PixID | Counts | Sigma | Mean | Median | Sigma |
| A | 8 | 15 | 54290 | 373.17 | 707 | 691 | 143.6 |
| A | 0 | 149 | 19704 | 132.37 | 707 | 691 | 143.6 |
| A | 0 | 226 | 9317 | 60.06 | 707 | 691 | 143.6 |
| B | 15 | 204 | 310060 | 2242.78 | 715 | 696 | 137.9 |
| B | 4 | 81 | 83686 | 601.65 | 715 | 696 | 137.9 |
| B | 0 | 183 | 29479 | 208.67 | 715 | 696 | 137.9 |
| C | 7 | 220 | 859089 | 5383.3 | 686 | 689 | 159.5 |
| C | 15 | 208 | 49644 | 307.01 | 686 | 689 | 159.5 |
| C | 2 | 53 | 44578 | 275.24 | 686 | 689 | 159.5 |
| D | 13 | 223 | 288747 | 1741.2 | 691 | 672 | 165.4 |
| D | 10 | 172 | 27640 | 163.0 | 691 | 672 | 165.4 |
| D | 13 | 239 | 9188 | 51.47 | 691 | 672 | 165.4 |
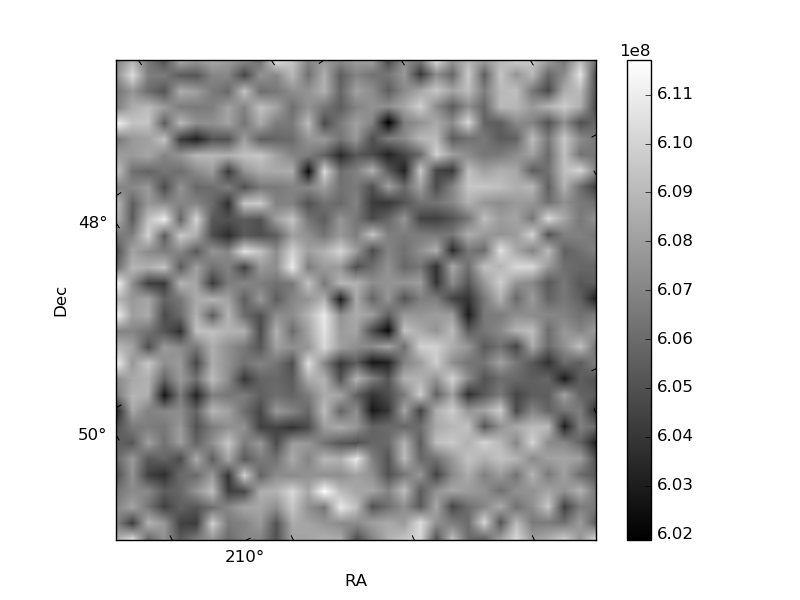
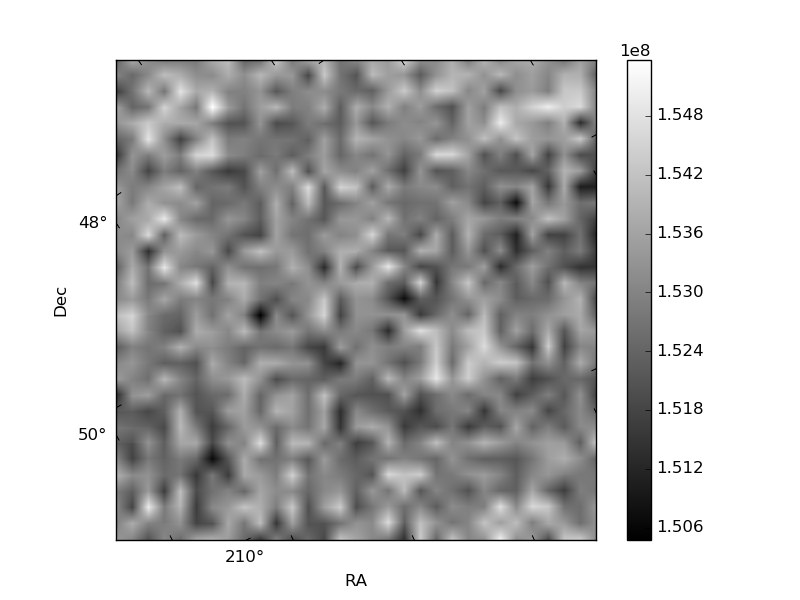
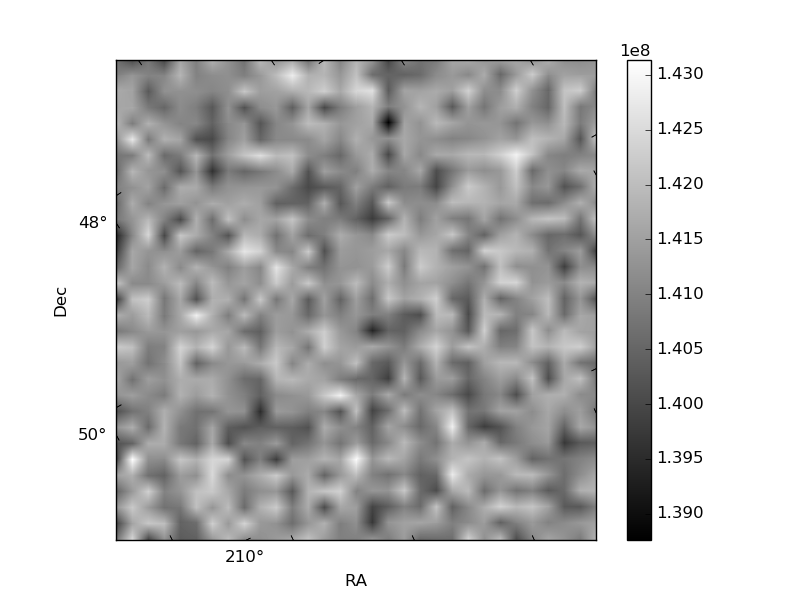
Histogram calculated using DETX and DETY for each event in the final _common_clean file
| Quadrant A | 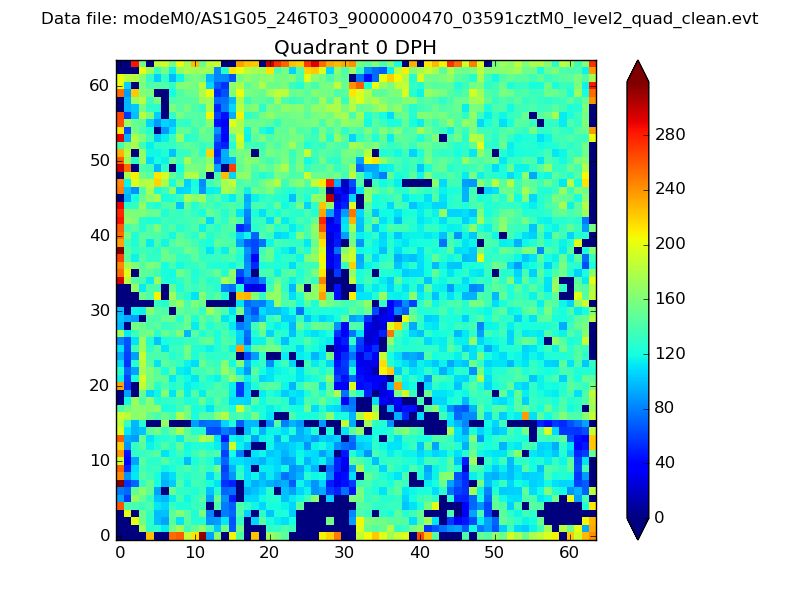 |
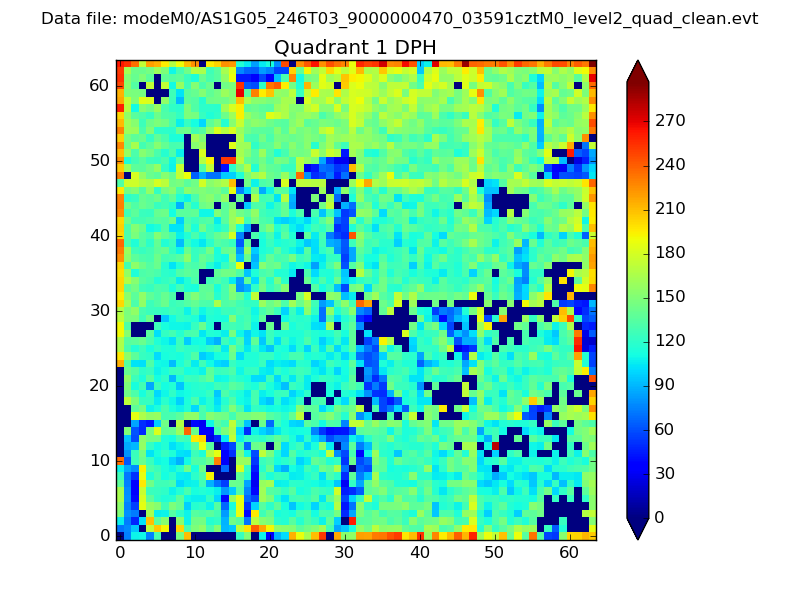 |
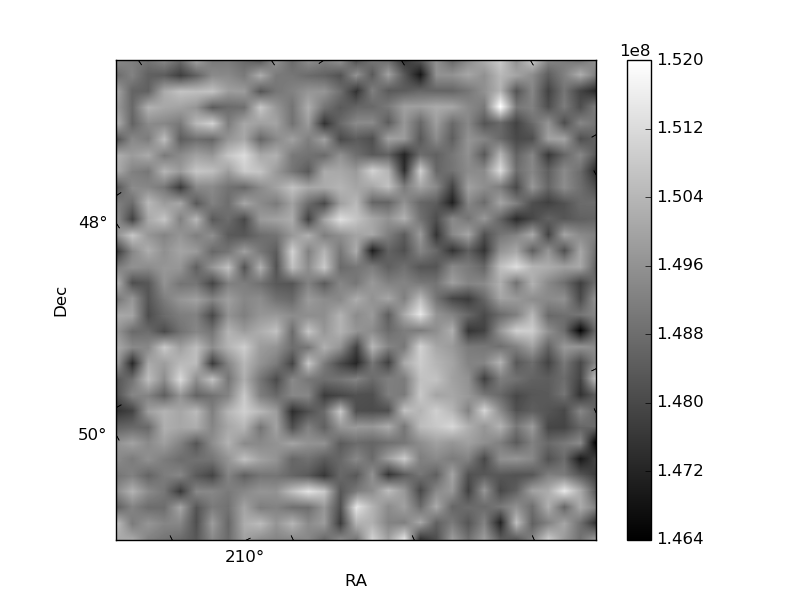
Quadrant B |
|---|---|---|---|
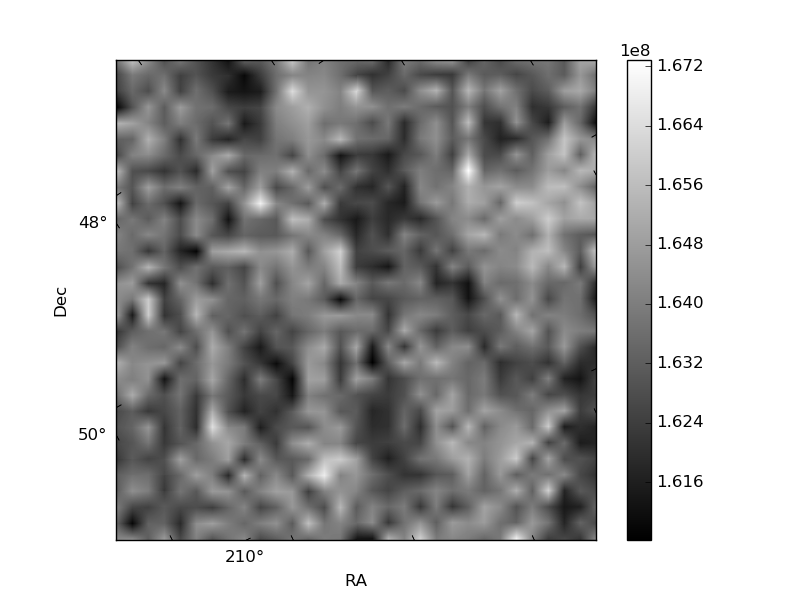
| Quadrant D | 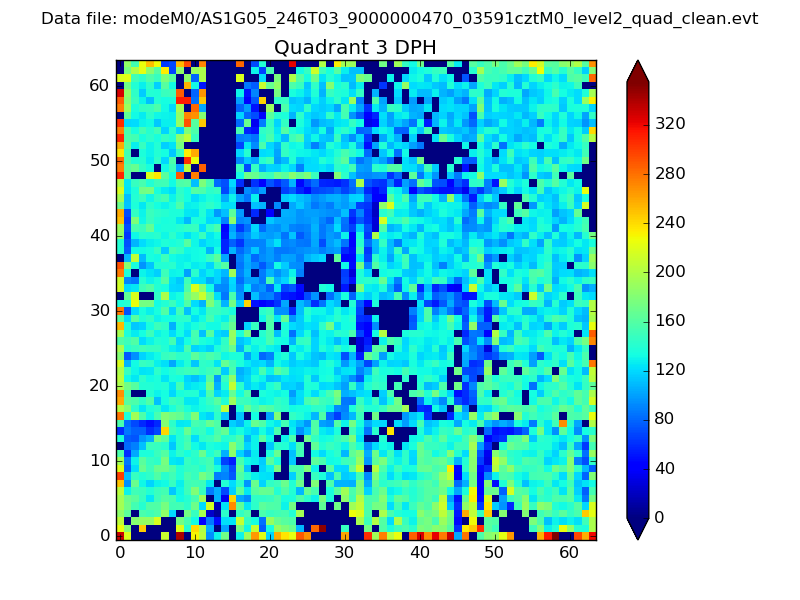 |
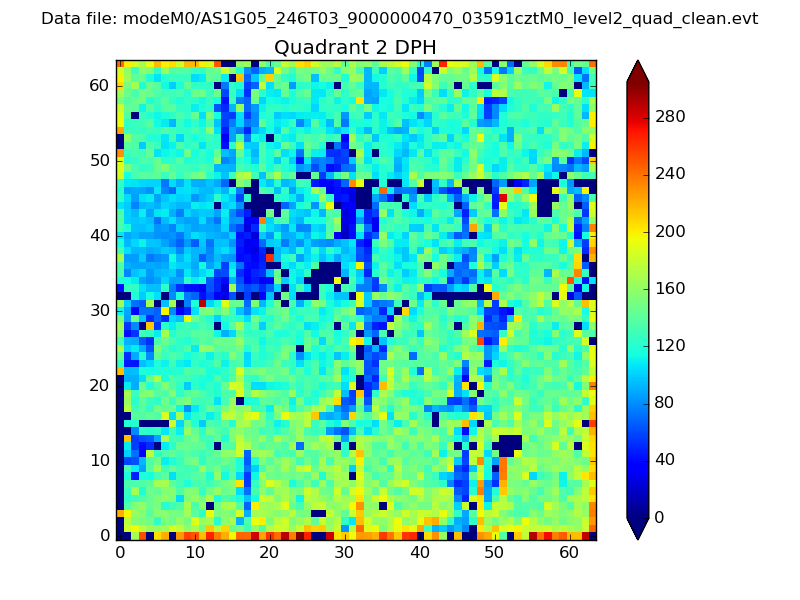 |
Quadrant C |
| Plot type | Count rate plots | Images |
|---|---|---|
| Comparison with Poisson distribution Blue bars denote a histogram of data divided into 1 sec bins. Red curve is a Poisson curve with rate = median count rate of data. |
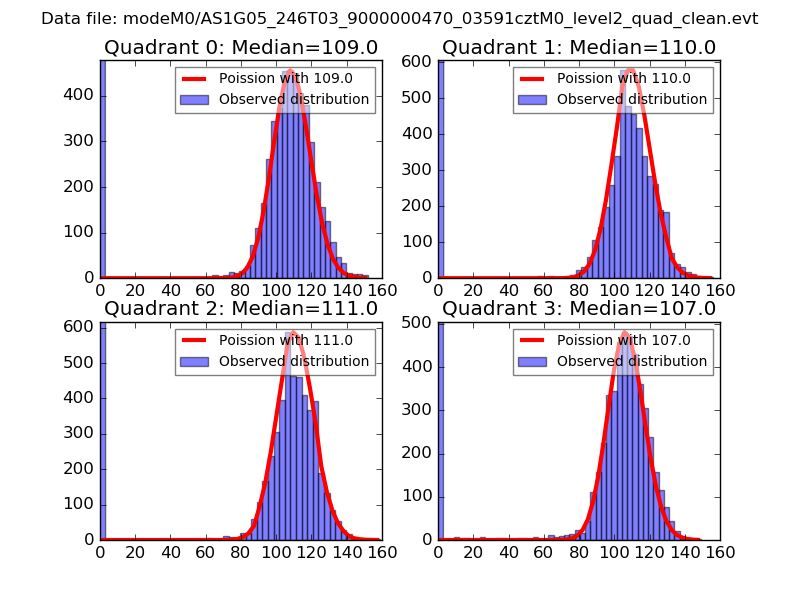 |
 |
| Quadrant-wise count rates Data is divided into 100 sec bins |
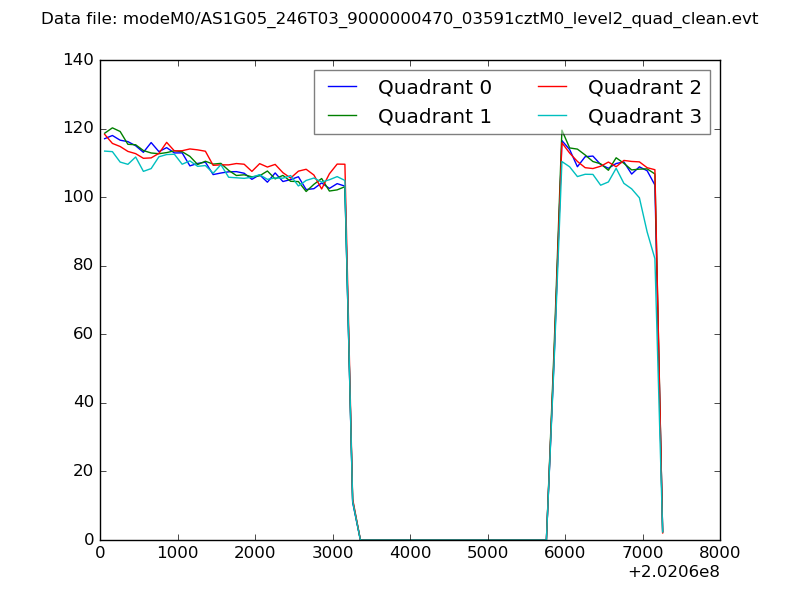 |
|
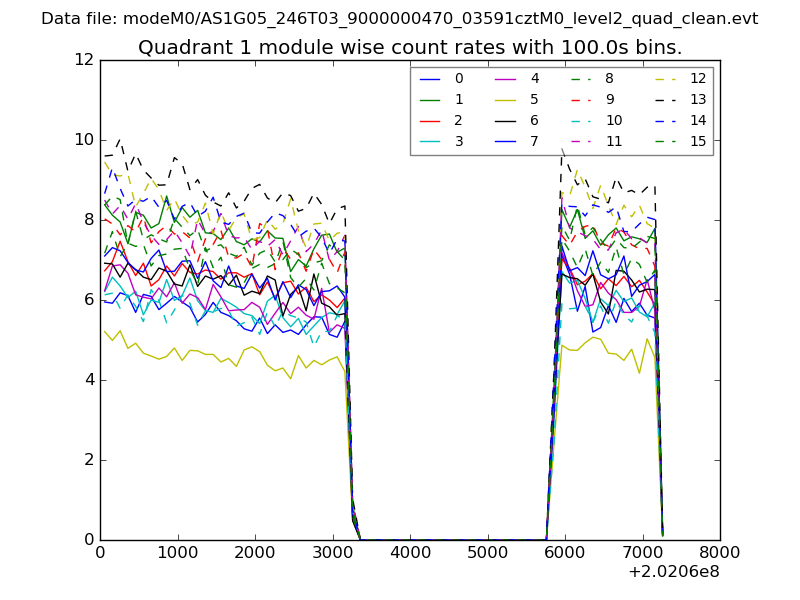
| Module-wise count rates for Quadrant A Data is divided into 100 sec bins |
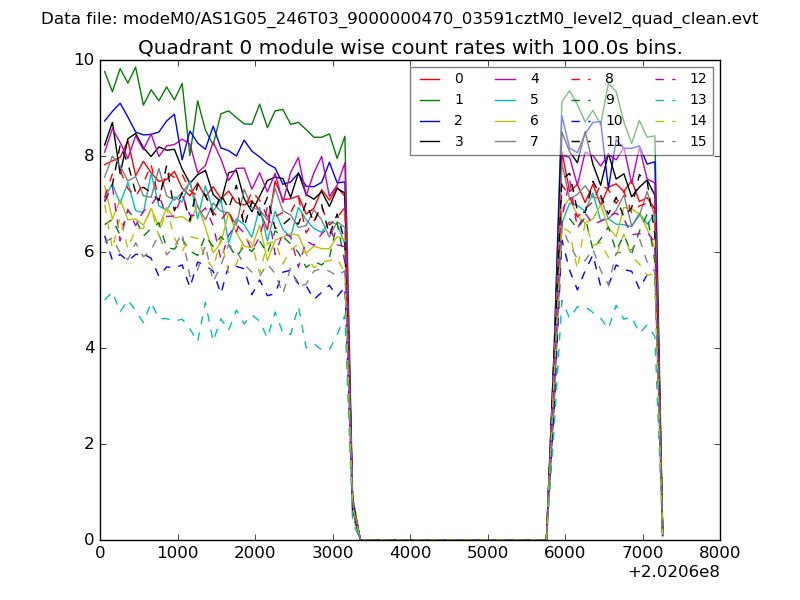 |
 |
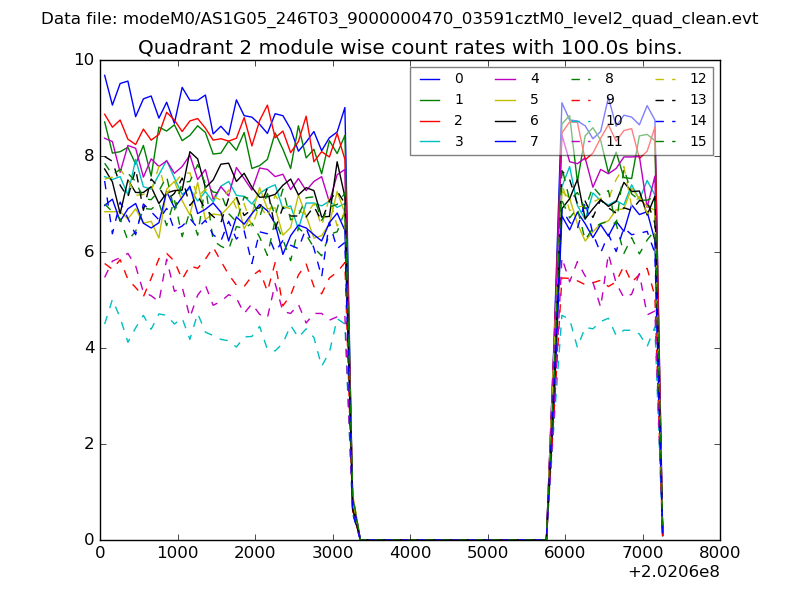
| Module-wise count rates for Quadrant B Data is divided into 100 sec bins |
 |
 |
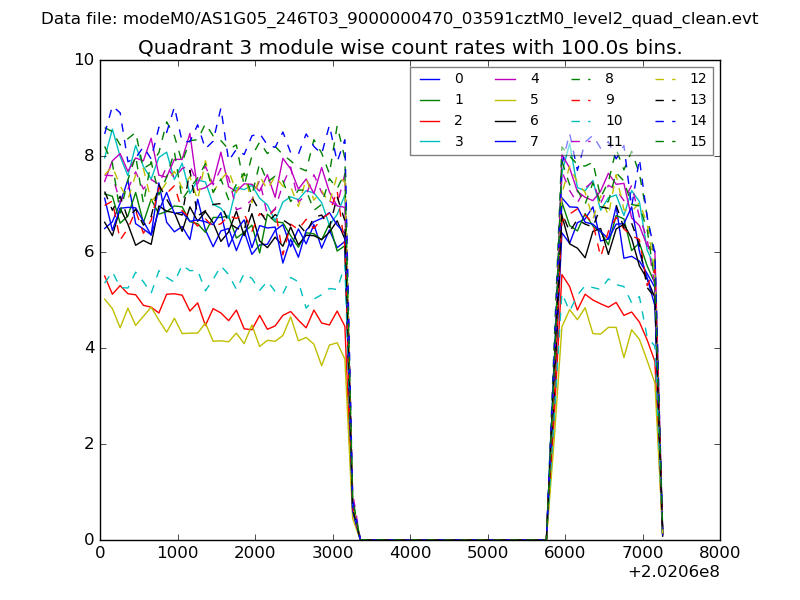
| Module-wise count rates for Quadrant C Data is divided into 100 sec bins |
 |
 |
| Module-wise count rates for Quadrant D Data is divided into 100 sec bins |
 |
 |
| Parameter | Plot |
|---|---|
| CZT HV Monitor | 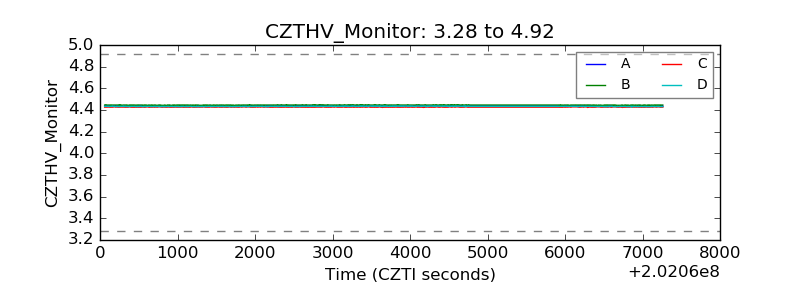 |
| D_VDD | 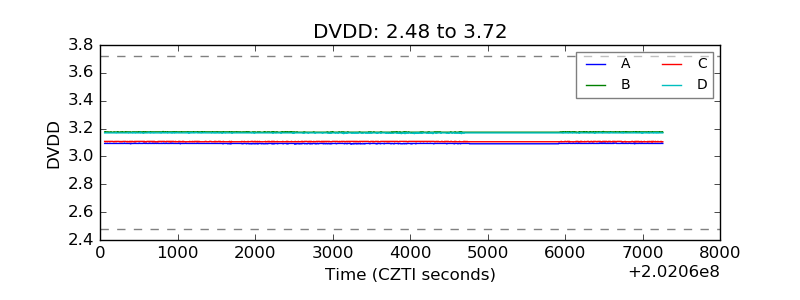 |
| Temperature 1 | 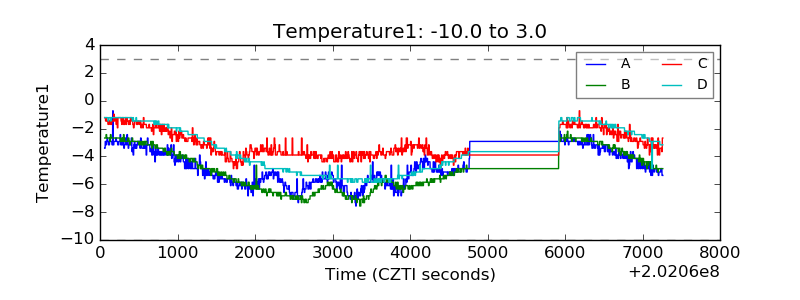 |
| Veto HV Monitor | 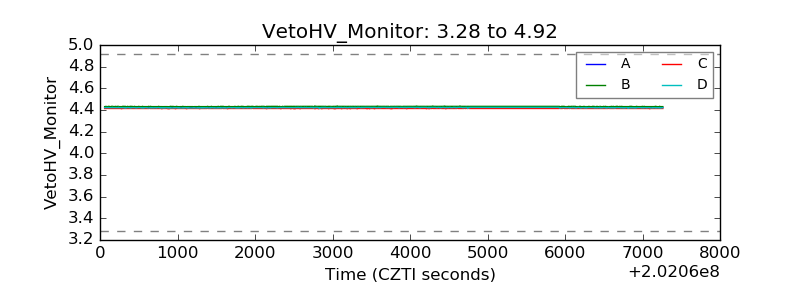 |
| Veto LLD | 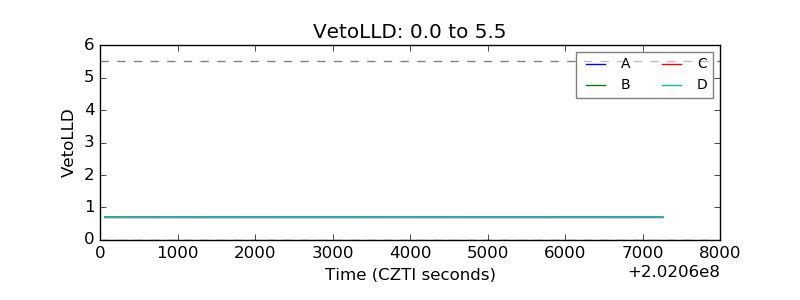 |
| Alpha Counter | 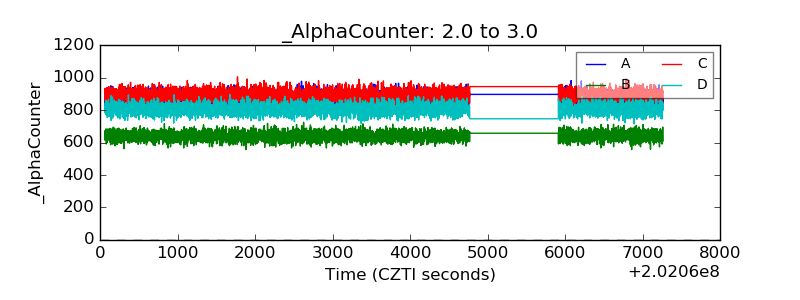 |
| _CPM_Rate | 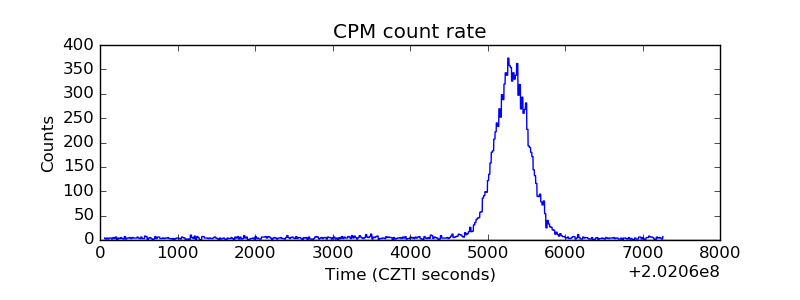 |
| CZT Counter | 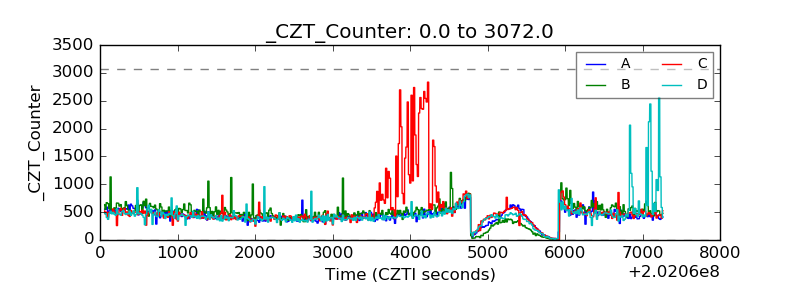 |
| +2.5 Volts monitor | 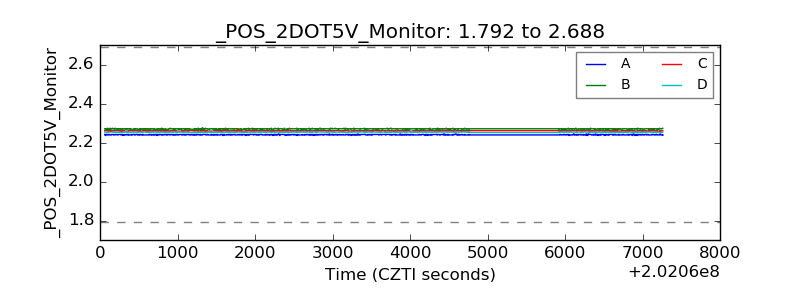 |
| +5 Volts monitor |  |
| Veto Counter | 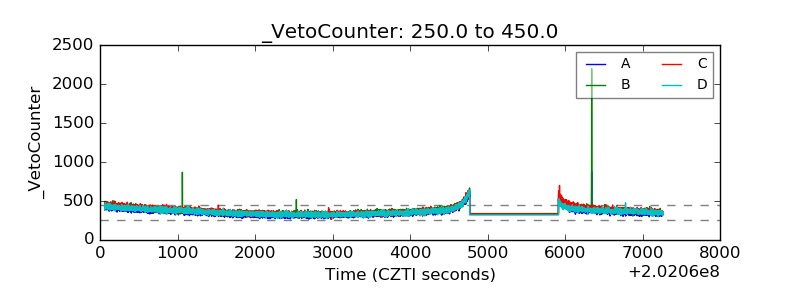 |