| Param | Original file | Final file |
|---|---|---|
| Filename | modeM0/AS1G05_246T03_9000000470_03592cztM0_level2.evt | modeM0/AS1G05_246T03_9000000470_03592cztM0_level2_quad_clean.evt |
| Size (bytes) | 457,706,880 | 71,758,080 |
| Size | 436.5 MB | 68.4 MB |
| Events in quadrant A | 2,883,350 | 436,960 |
| Events in quadrant B | 3,446,326 | 437,382 |
| Events in quadrant C | 4,093,612 | 438,559 |
| Events in quadrant D | 3,015,796 | 426,049 |
| Mode SS | |||
|---|---|---|---|
| Quadrant | BADHDUFLAG | Total packets | Discarded packets |
| A | 0 | 126 | 0 |
| B | 0 | 126 | 0 |
| C | 0 | 126 | 0 |
| D | 0 | 126 | 0 |
| Mode M0 | |||
|---|---|---|---|
| Quadrant | BADHDUFLAG | Total packets | Discarded packets |
| A | 0 | 13027 | 2 |
| B | 0 | 14403 | 2 |
| C | 0 | 16510 | 2 |
| D | 0 | 13705 | 2 |
| Mode M9 | |||
|---|---|---|---|
| Quadrant | BADHDUFLAG | Total packets | Discarded packets |
| A | 0 | 10 | 0 |
| B | 0 | 10 | 0 |
| C | 0 | 10 | 0 |
| D | 0 | 11 | 0 |
| Quadrant | Total seconds | Saturated seconds | Saturation percentage |
|---|---|---|---|
| A | 6217 | 37 | 0.595142% |
| B | 6217 | 55 | 0.884671% |
| C | 6217 | 511 | 8.219398% |
| D | 6217 | 135 | 2.171465% |
Noise dominated data is calculated using 1-second bins in cleaned event files. If a bin has >2000 counts, and if more than 50% of those come from <1% of pixels, then it is considered to be noise-dominated and hence unusable.
| Quadrant | # 1 sec bins | Bins with >0 counts | Bins with >2000 counts | High rate bins dominated by noise | Noise dominated (total time) | Noise dominated (detector-on time) | Marked lightcurve |
|---|---|---|---|---|---|---|---|
| A | 7092 | 6218 | 4 | 4 | 0.06% | 0.06% |  |
| B | 7092 | 6218 | 0 | 0 | 0.00% | 0.00% |  |
| C | 7092 | 6218 | 448 | 448 | 6.32% | 7.20% | 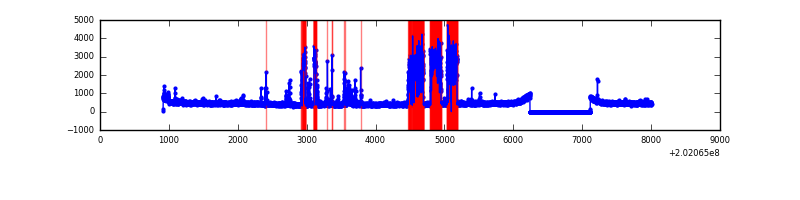 |
| D | 7092 | 6218 | 89 | 89 | 1.25% | 1.43% |  |
Top three noisy pixels from each quadrant. If the there are fewer than three noisy pixels in the level2.evt file, extra rows are filled as -1
| Pixel properties | Quadrant properties | ||||||
|---|---|---|---|---|---|---|---|
| Quadrant | DetID | PixID | Counts | Sigma | Mean | Median | Sigma |
| A | 8 | 15 | 48543 | 325.66 | 716 | 700 | 146.9 |
| A | 0 | 50 | 34795 | 232.08 | 716 | 700 | 146.9 |
| A | 0 | 149 | 24070 | 159.08 | 716 | 700 | 146.9 |
| B | 15 | 204 | 446355 | 3179.89 | 723 | 703 | 140.1 |
| B | 4 | 81 | 118719 | 842.09 | 723 | 703 | 140.1 |
| B | 0 | 229 | 23049 | 159.44 | 723 | 703 | 140.1 |
| C | 7 | 220 | 1407281 | 8957.14 | 669 | 673 | 157.0 |
| C | 1 | 16 | 28773 | 178.94 | 669 | 673 | 157.0 |
| C | 2 | 53 | 28532 | 177.4 | 669 | 673 | 157.0 |
| D | 13 | 223 | 309659 | 1820.13 | 697 | 676 | 169.8 |
| D | 10 | 172 | 26125 | 149.91 | 697 | 676 | 169.8 |
| D | 2 | 206 | 21345 | 121.76 | 697 | 676 | 169.8 |
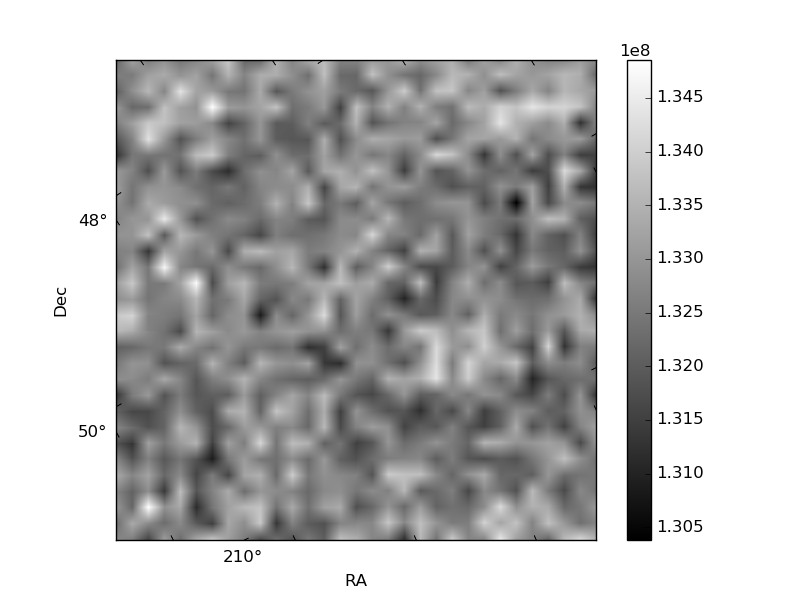
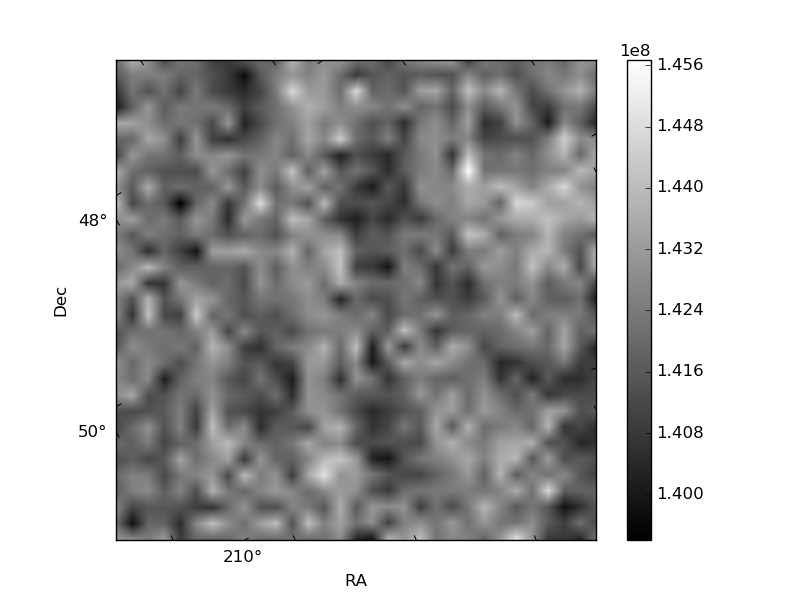
Histogram calculated using DETX and DETY for each event in the final _common_clean file
| Quadrant A | 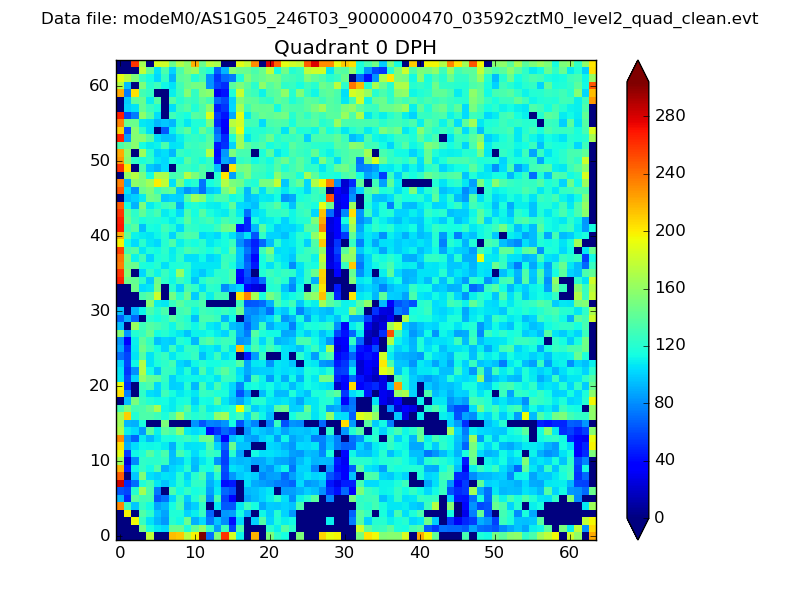 |
 |
Quadrant B |
|---|---|---|---|
| Quadrant D |  |
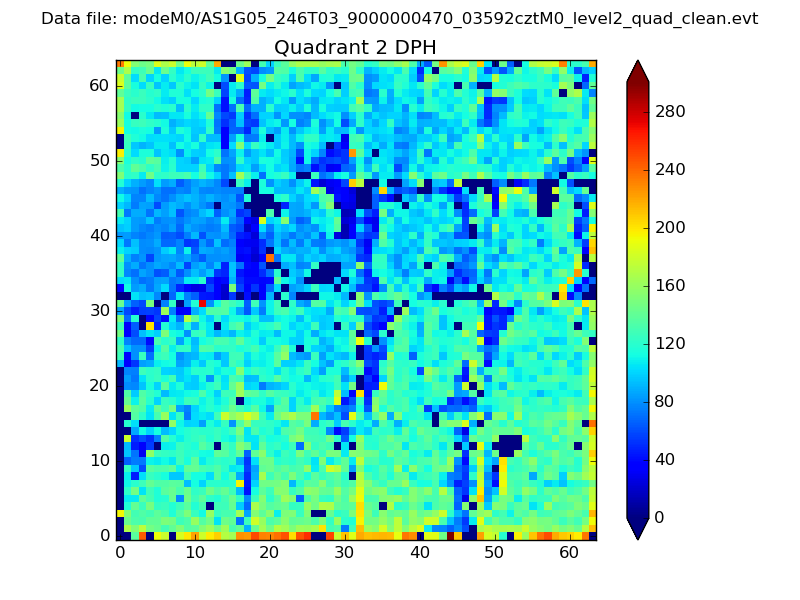 |
Quadrant C |
| Plot type | Count rate plots | Images |
|---|---|---|
| Comparison with Poisson distribution Blue bars denote a histogram of data divided into 1 sec bins. Red curve is a Poisson curve with rate = median count rate of data. |
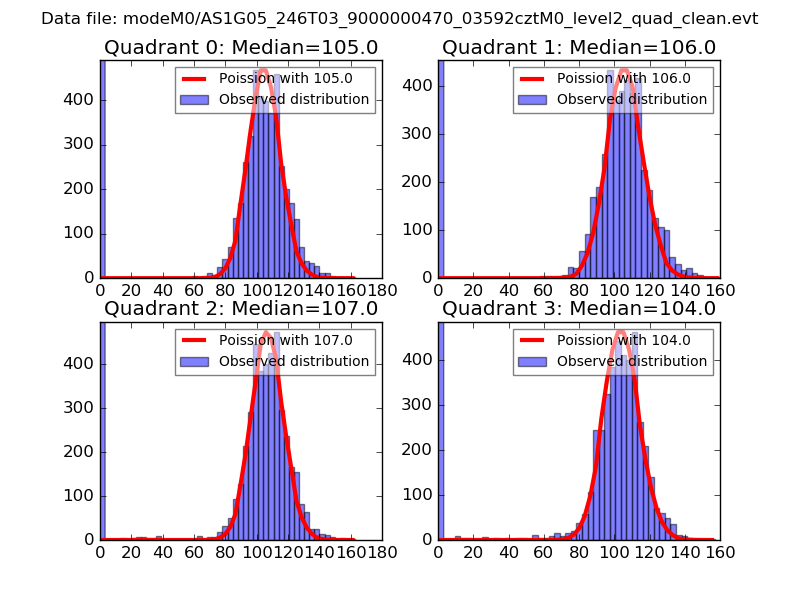 |
 |
| Quadrant-wise count rates Data is divided into 100 sec bins |
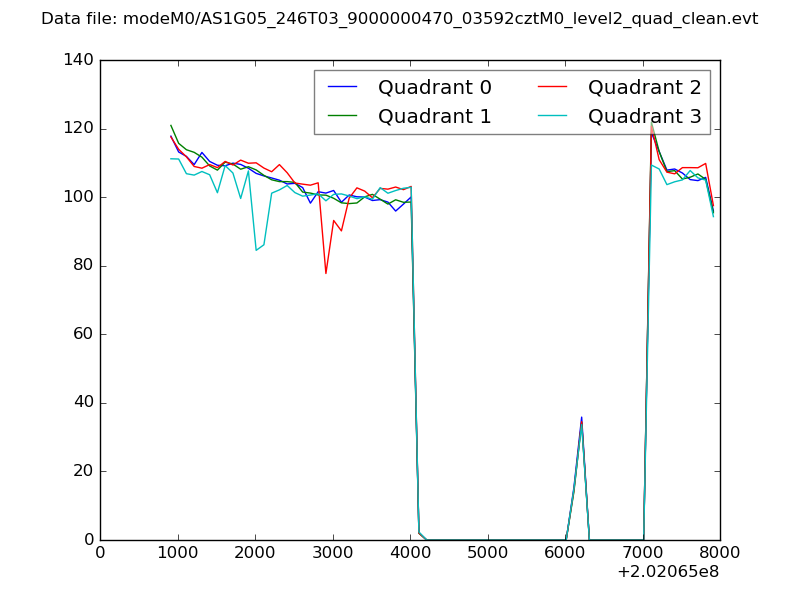 |
|
| Module-wise count rates for Quadrant A Data is divided into 100 sec bins |
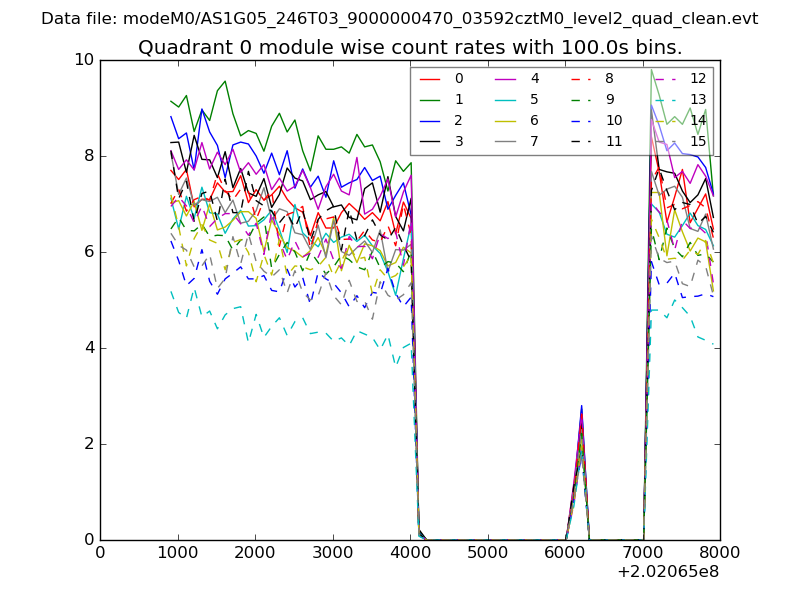 |
 |
| Module-wise count rates for Quadrant B Data is divided into 100 sec bins |
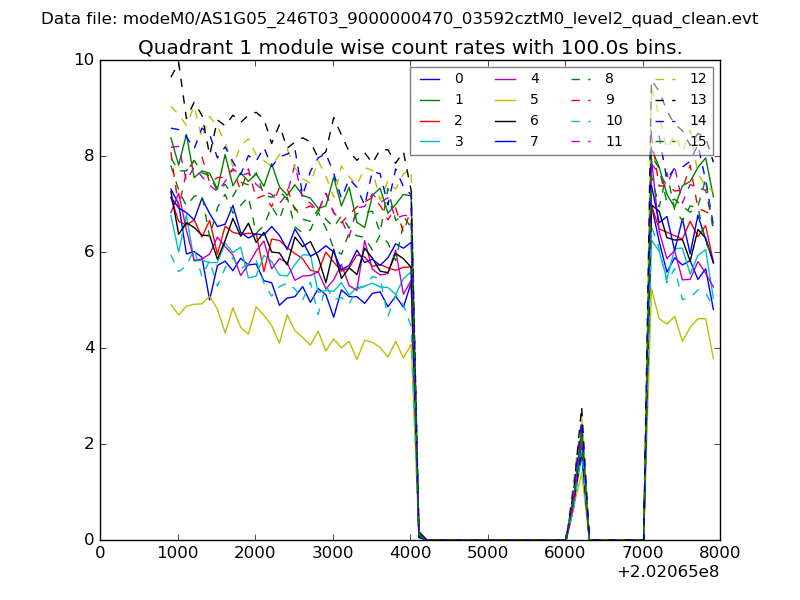 |
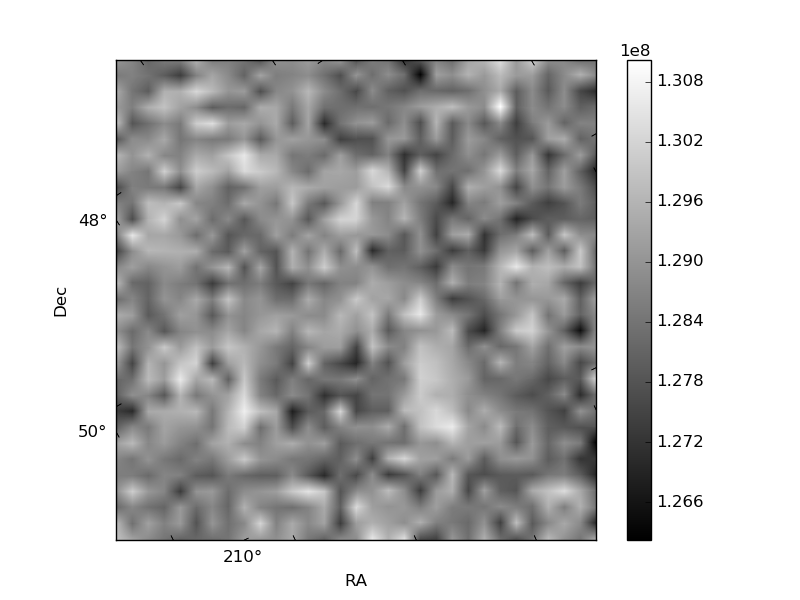 |
| Module-wise count rates for Quadrant C Data is divided into 100 sec bins |
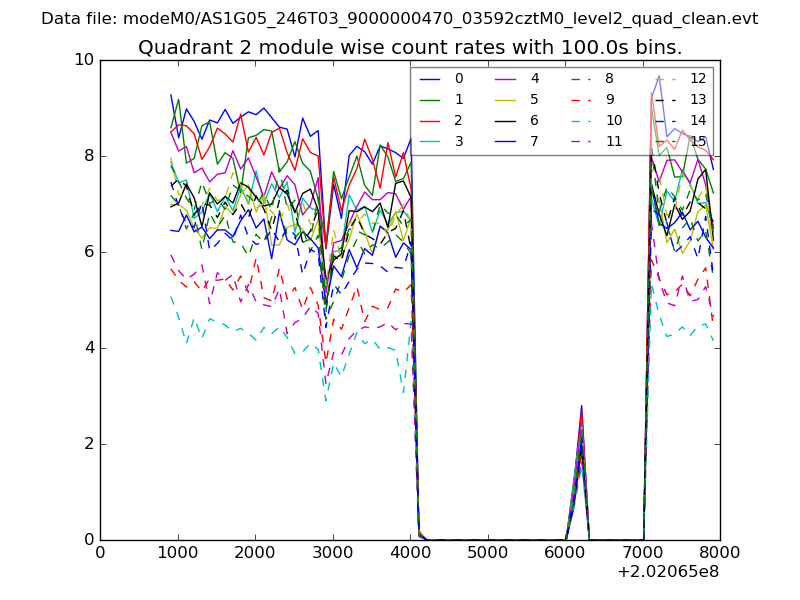 |
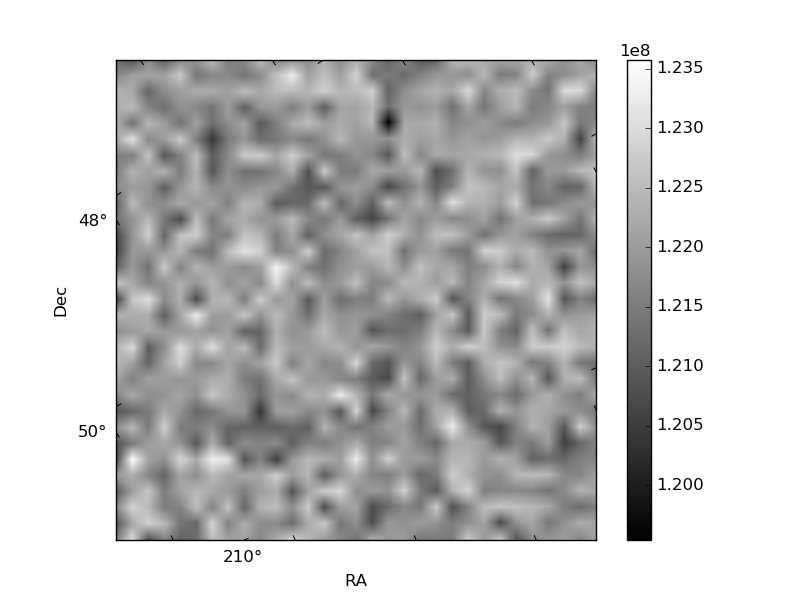 |
| Module-wise count rates for Quadrant D Data is divided into 100 sec bins |
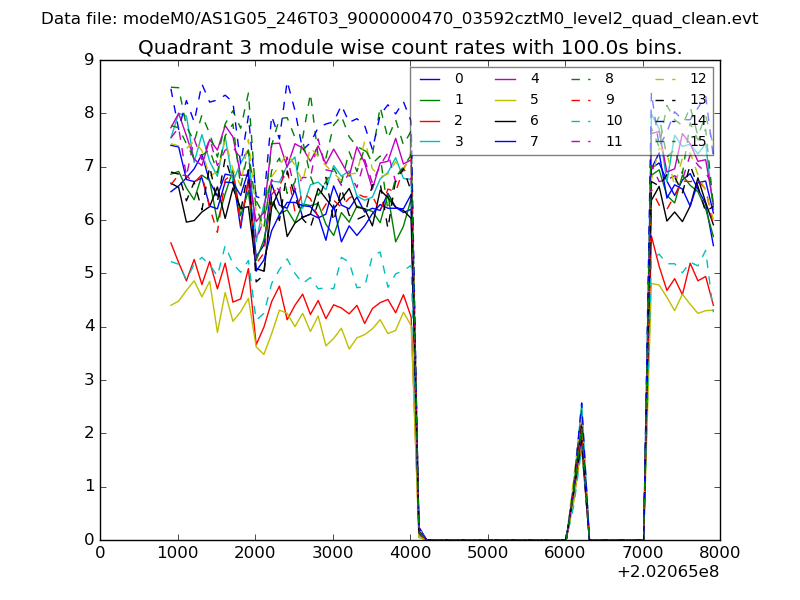 |
 |
| Parameter | Plot |
|---|---|
| CZT HV Monitor | 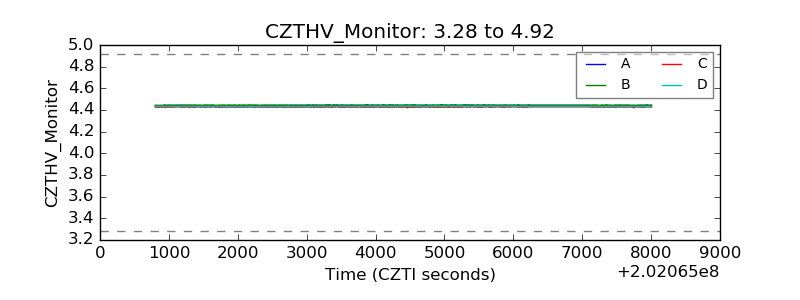 |
| D_VDD | 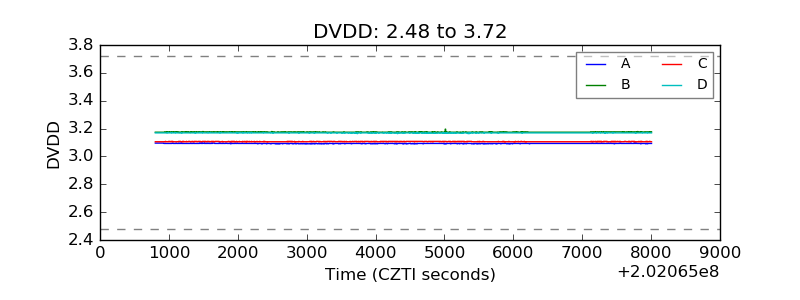 |
| Temperature 1 |  |
| Veto HV Monitor | 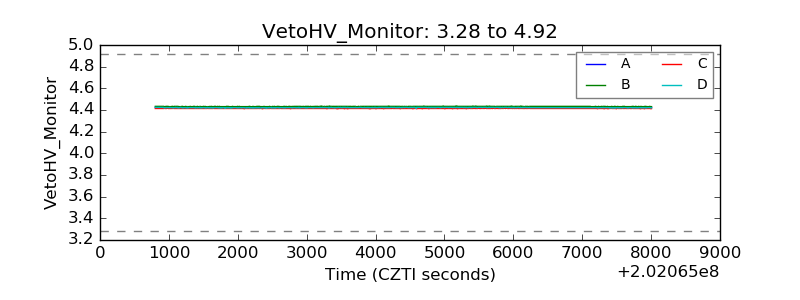 |
| Veto LLD | 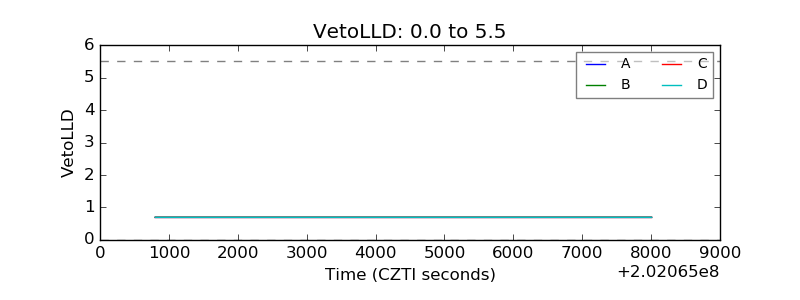 |
| Alpha Counter | 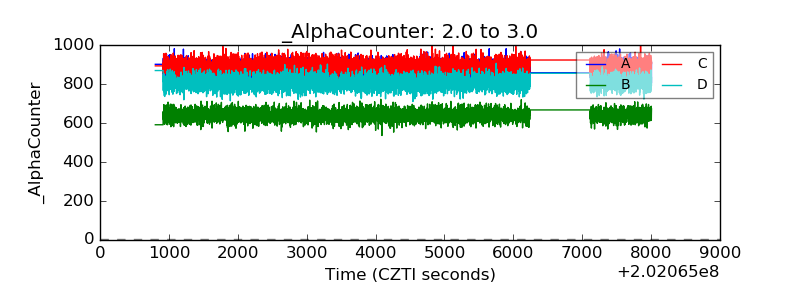 |
| _CPM_Rate | 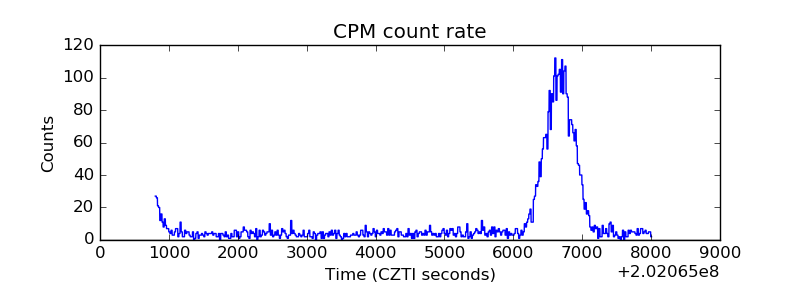 |
| CZT Counter | 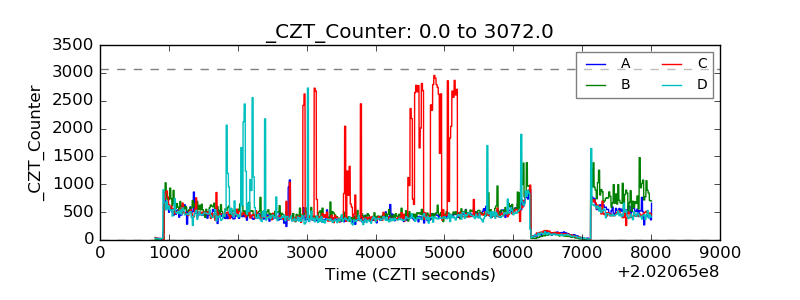 |
| +2.5 Volts monitor |  |
| +5 Volts monitor |  |
| Veto Counter | 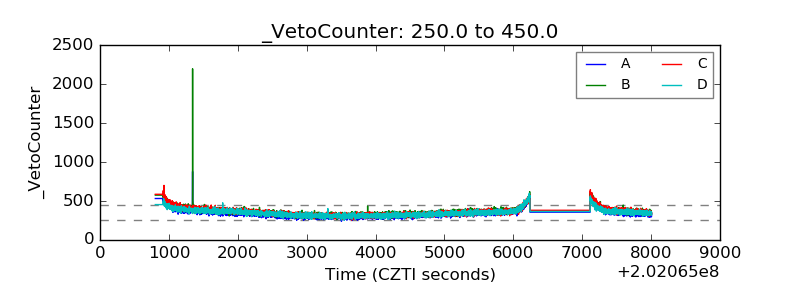 |