| Param | Original file | Final file |
|---|---|---|
| Filename | modeM0/AS1G05_246T03_9000000470_03593cztM0_level2.evt | modeM0/AS1G05_246T03_9000000470_03593cztM0_level2_quad_clean.evt |
| Size (bytes) | 75,231,360 | 15,621,120 |
| Size | 71.7 MB | 14.9 MB |
| Events in quadrant A | 509,594 | 100,445 |
| Events in quadrant B | 758,767 | 100,549 |
| Events in quadrant C | 472,384 | 101,680 |
| Events in quadrant D | 471,814 | 98,108 |
| Mode SS | |||
|---|---|---|---|
| Quadrant | BADHDUFLAG | Total packets | Discarded packets |
| A | 0 | 20 | 0 |
| B | 0 | 20 | 0 |
| C | 0 | 20 | 0 |
| D | 0 | 20 | 0 |
| Mode M0 | |||
|---|---|---|---|
| Quadrant | BADHDUFLAG | Total packets | Discarded packets |
| A | 0 | 2087 | 1 |
| B | 0 | 2924 | 1 |
| C | 0 | 1998 | 1 |
| D | 0 | 2019 | 1 |
| Mode M9 | |||
|---|---|---|---|
| Quadrant | BADHDUFLAG | Total packets | Discarded packets |
| A | 0 | 9 | 0 |
| B | 0 | 9 | 0 |
| C | 0 | 9 | 0 |
| D | 0 | 9 | 0 |
| Quadrant | Total seconds | Saturated seconds | Saturation percentage |
|---|---|---|---|
| A | 922 | 16 | 1.735358% |
| B | 922 | 37 | 4.013015% |
| C | 922 | 20 | 2.169197% |
| D | 922 | 23 | 2.494577% |
Noise dominated data is calculated using 1-second bins in cleaned event files. If a bin has >2000 counts, and if more than 50% of those come from <1% of pixels, then it is considered to be noise-dominated and hence unusable.
| Quadrant | # 1 sec bins | Bins with >0 counts | Bins with >2000 counts | High rate bins dominated by noise | Noise dominated (total time) | Noise dominated (detector-on time) | Marked lightcurve |
|---|---|---|---|---|---|---|---|
| A | 1797 | 923 | 0 | 0 | 0.00% | 0.00% | 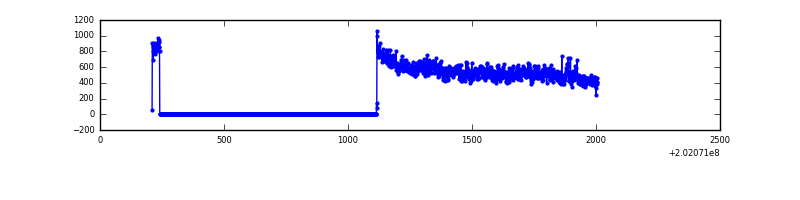 |
| B | 1797 | 923 | 0 | 0 | 0.00% | 0.00% | 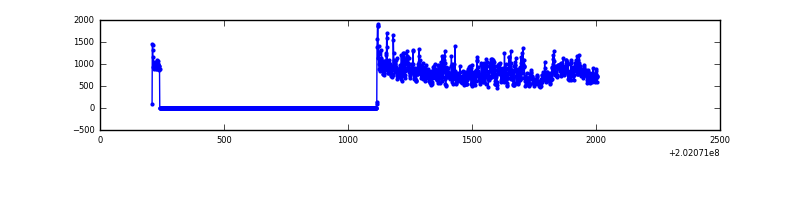 |
| C | 1797 | 923 | 0 | 0 | 0.00% | 0.00% | 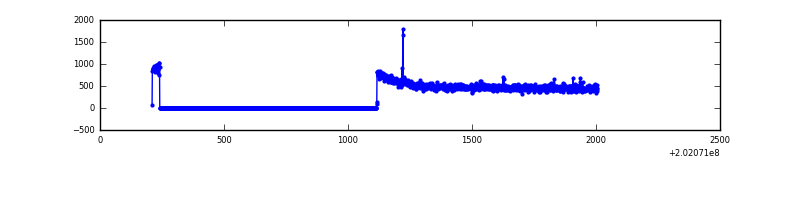 |
| D | 1797 | 923 | 3 | 3 | 0.17% | 0.33% | 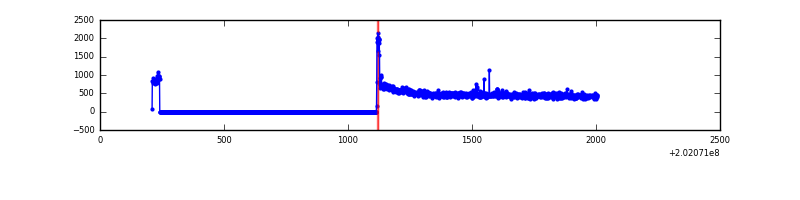 |
Top three noisy pixels from each quadrant. If the there are fewer than three noisy pixels in the level2.evt file, extra rows are filled as -1
| Pixel properties | Quadrant properties | ||||||
|---|---|---|---|---|---|---|---|
| Quadrant | DetID | PixID | Counts | Sigma | Mean | Median | Sigma |
| A | 8 | 15 | 43123 | 1605.1 | 119 | 115 | 26.8 |
| A | 12 | 113 | 4997 | 182.18 | 119 | 115 | 26.8 |
| A | 12 | 194 | 1424 | 48.84 | 119 | 115 | 26.8 |
| B | 15 | 204 | 227998 | 8947.6 | 120 | 116 | 25.5 |
| B | 4 | 81 | 33770 | 1321.4 | 120 | 116 | 25.5 |
| B | 0 | 229 | 10475 | 406.74 | 120 | 116 | 25.5 |
| C | 1 | 16 | 4466 | 144.61 | 119 | 119 | 30.1 |
| C | 15 | 208 | 1483 | 45.37 | 119 | 119 | 30.1 |
| C | 13 | 61 | 948 | 27.58 | 119 | 119 | 30.1 |
| D | 12 | 219 | 16020 | 519.9 | 119 | 114 | 30.6 |
| D | 13 | 223 | 2866 | 89.95 | 119 | 114 | 30.6 |
| D | 10 | 172 | 1940 | 59.68 | 119 | 114 | 30.6 |
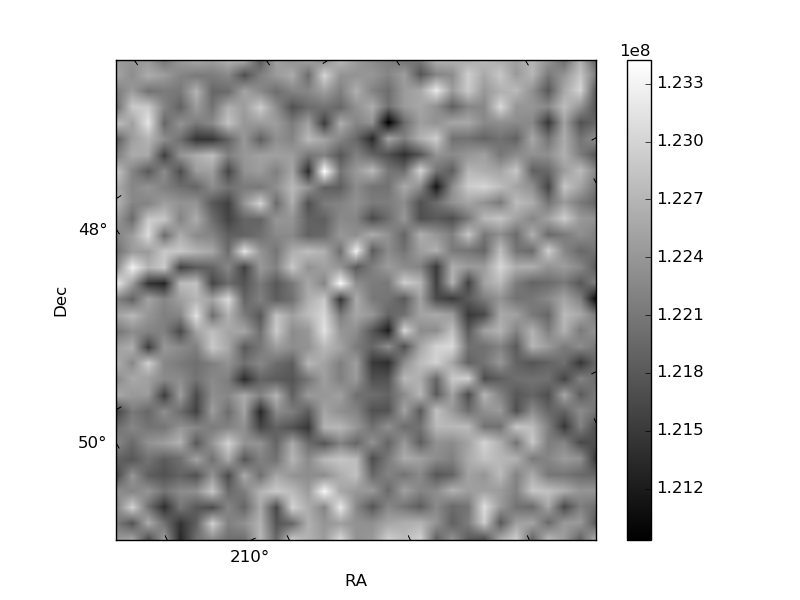
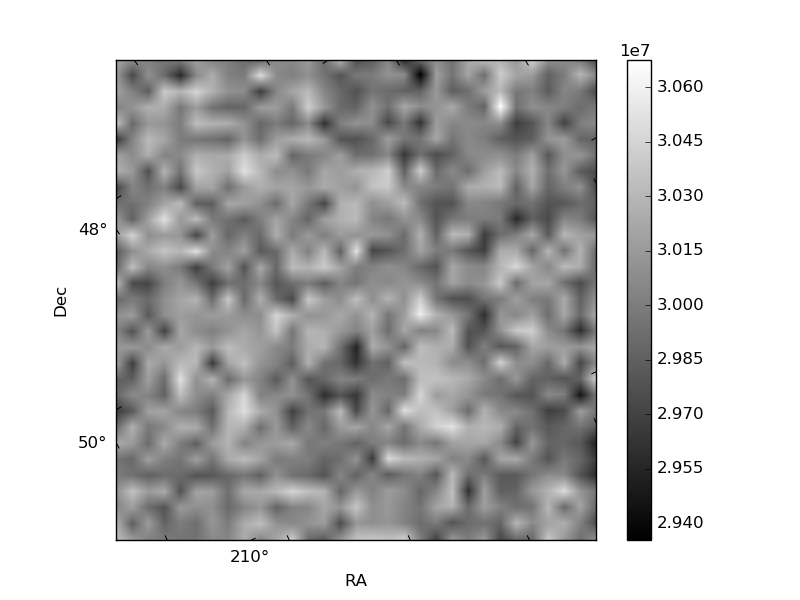
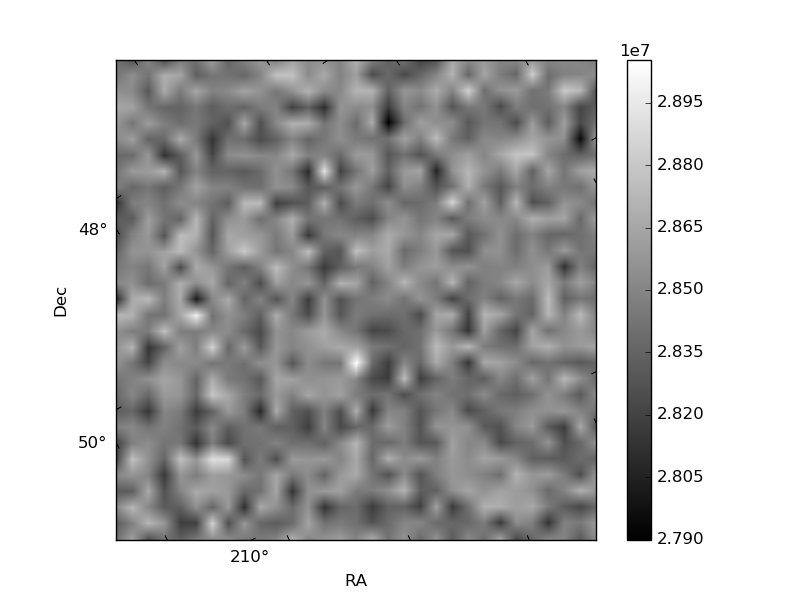
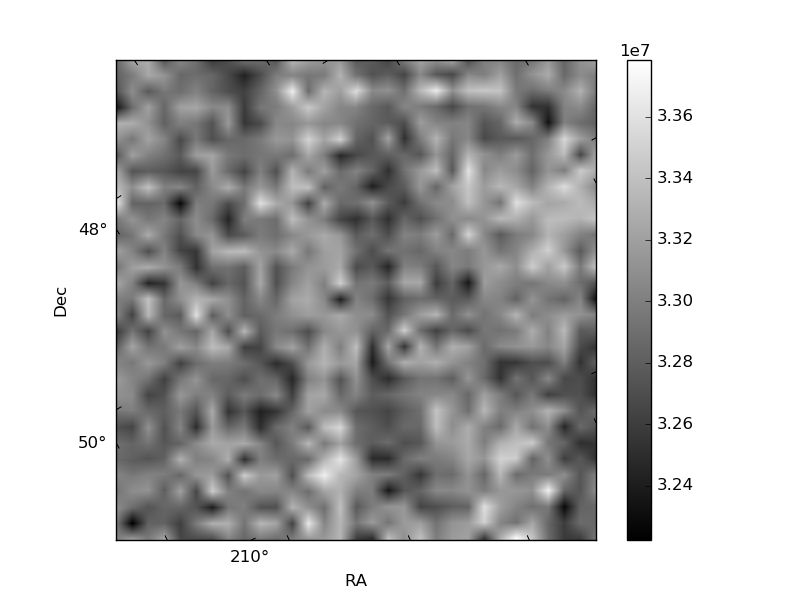
Histogram calculated using DETX and DETY for each event in the final _common_clean file
| Quadrant A | 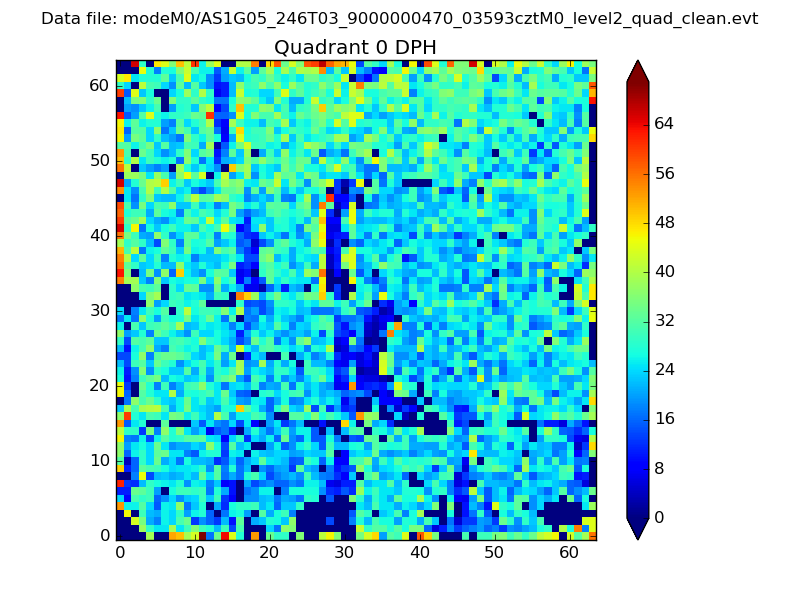 |
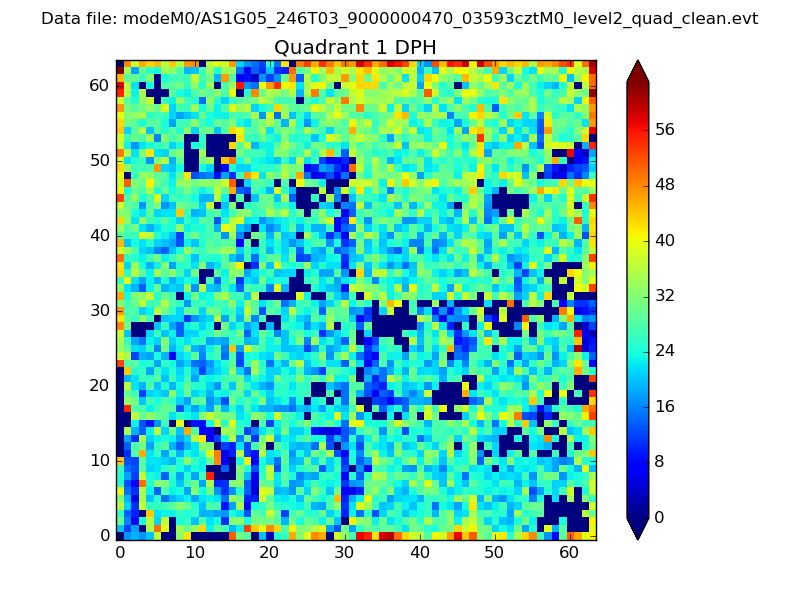 |
Quadrant B |
|---|---|---|---|
| Quadrant D | 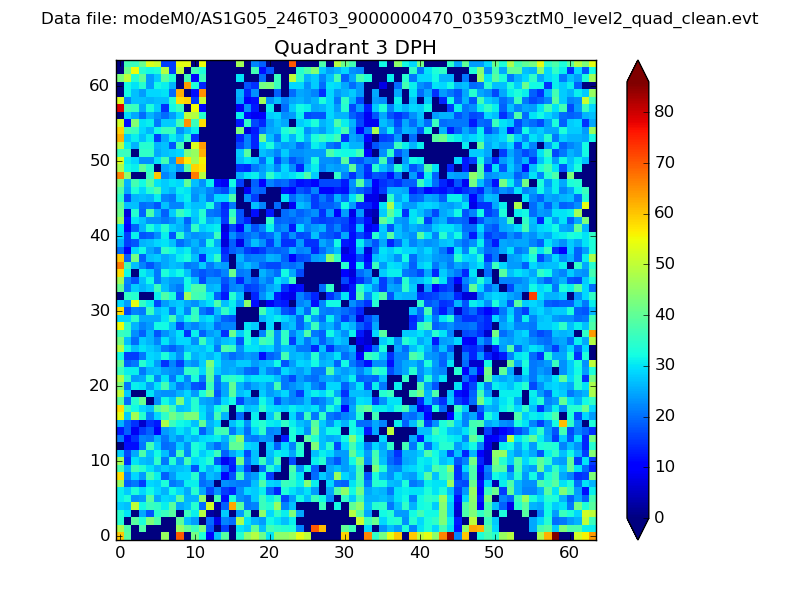 |
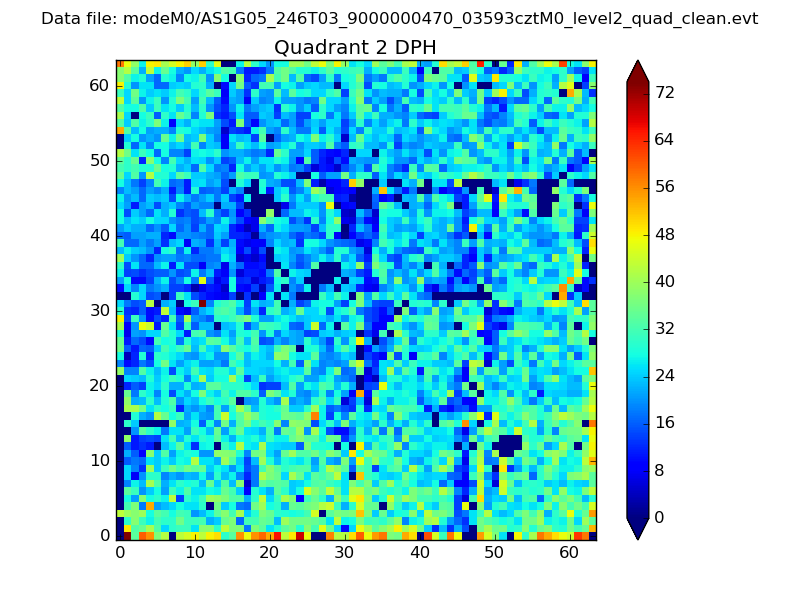 |
Quadrant C |
| Plot type | Count rate plots | Images |
|---|---|---|
| Comparison with Poisson distribution Blue bars denote a histogram of data divided into 1 sec bins. Red curve is a Poisson curve with rate = median count rate of data. |
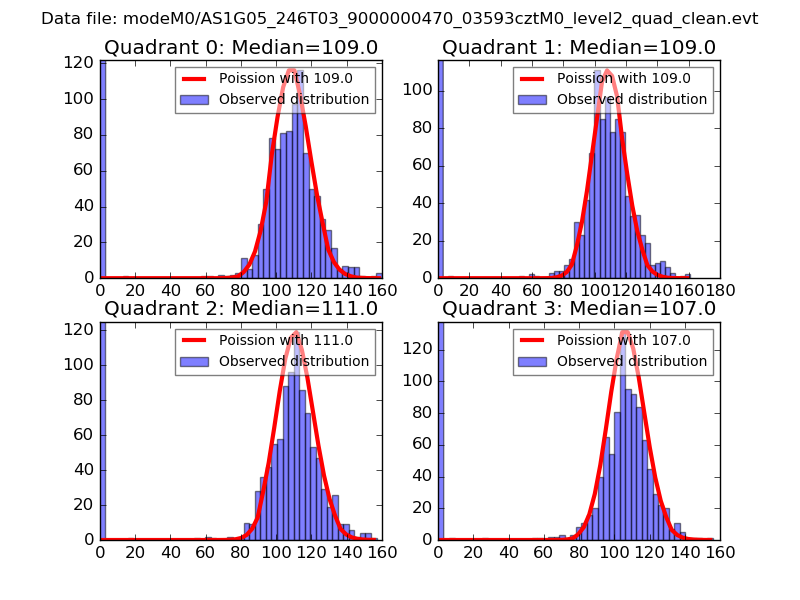 |
 |
| Quadrant-wise count rates Data is divided into 100 sec bins |
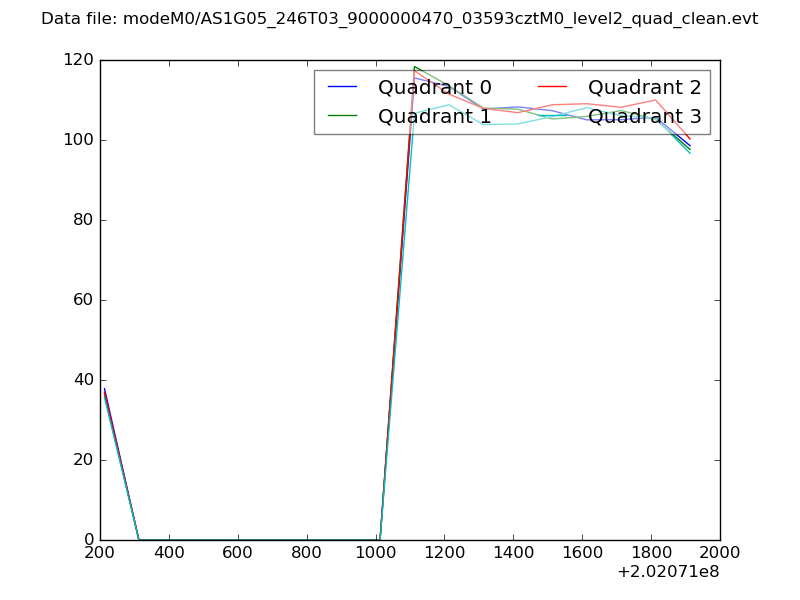 |
|
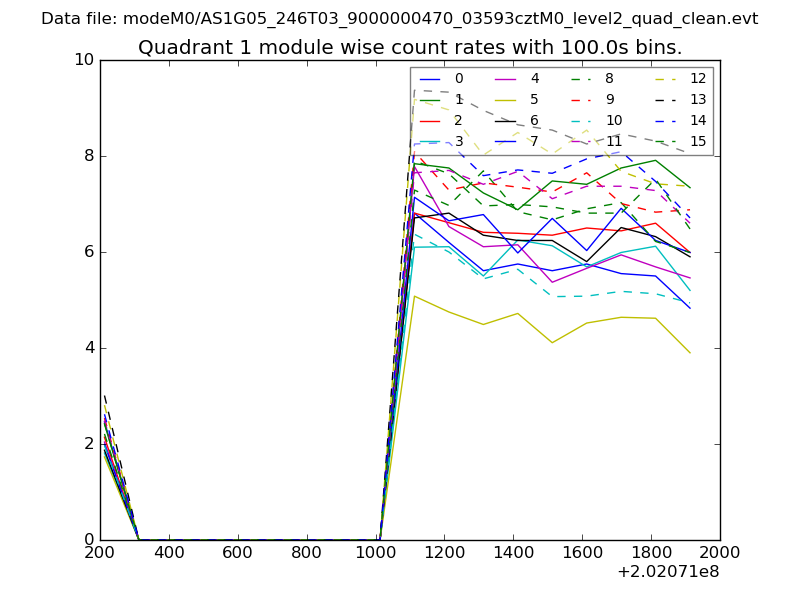
| Module-wise count rates for Quadrant A Data is divided into 100 sec bins |
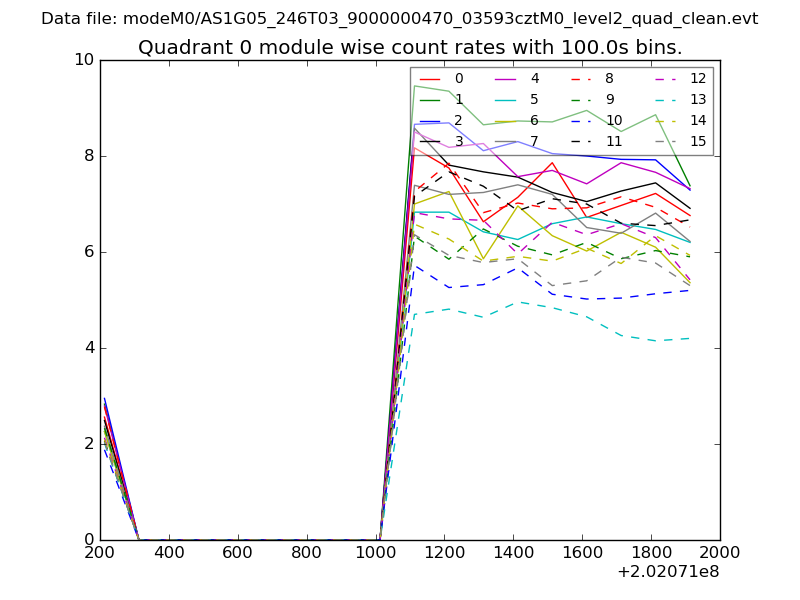 |
 |
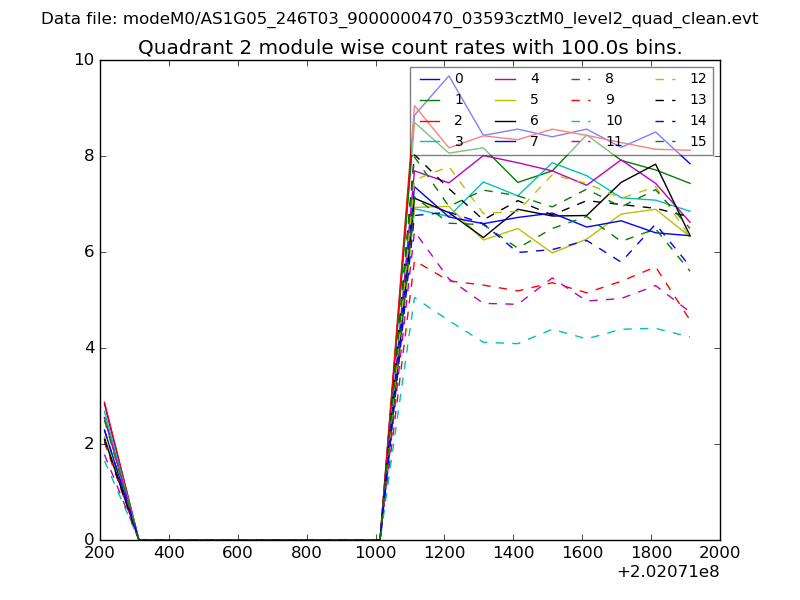
| Module-wise count rates for Quadrant B Data is divided into 100 sec bins |
 |
 |
| Module-wise count rates for Quadrant C Data is divided into 100 sec bins |
 |
 |
| Module-wise count rates for Quadrant D Data is divided into 100 sec bins |
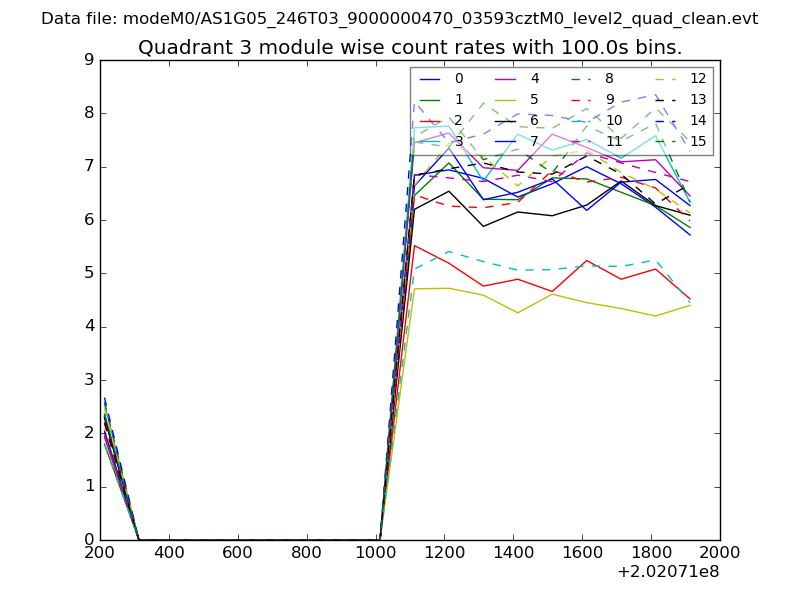 |
 |
| Parameter | Plot |
|---|---|
| CZT HV Monitor | 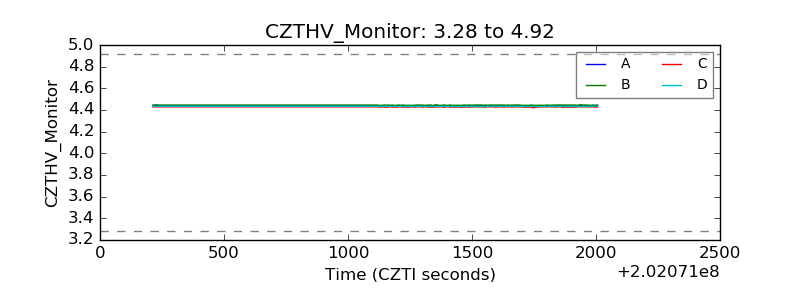 |
| D_VDD | 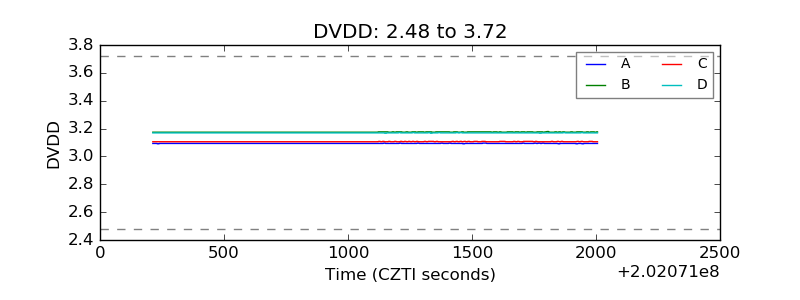 |
| Temperature 1 | 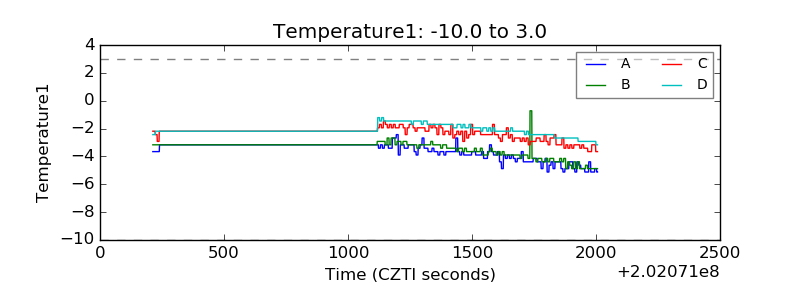 |
| Veto HV Monitor | 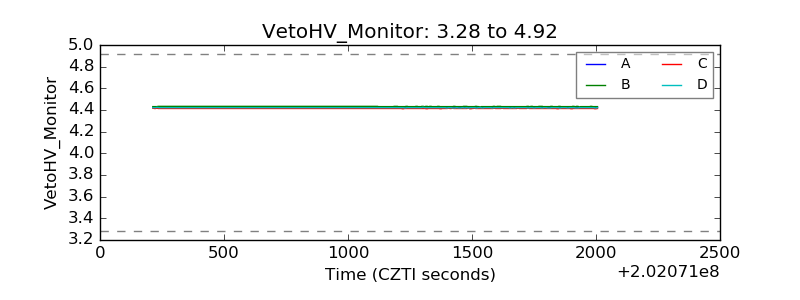 |
| Veto LLD | 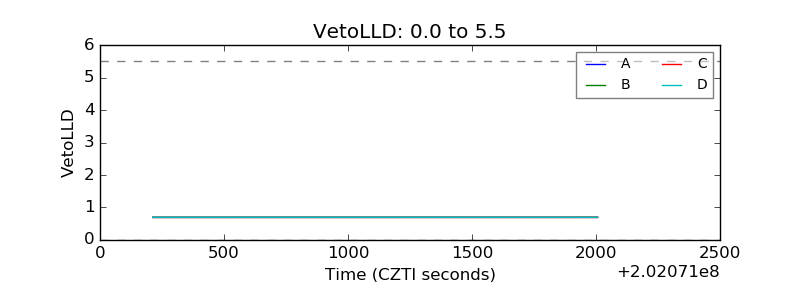 |
| Alpha Counter | 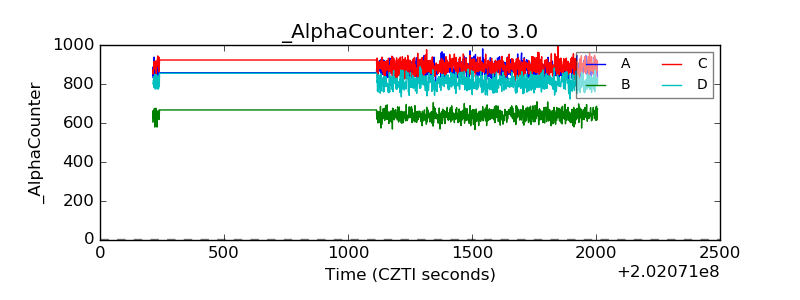 |
| _CPM_Rate | 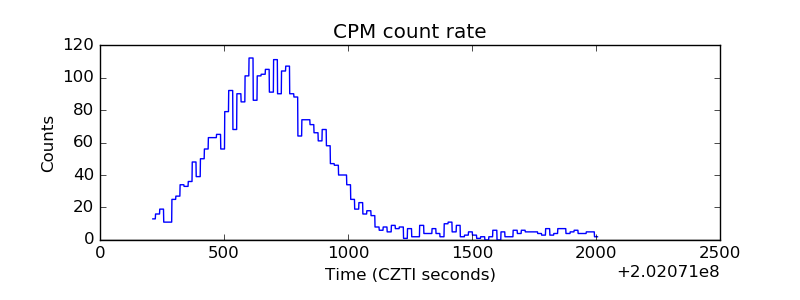 |
| CZT Counter | 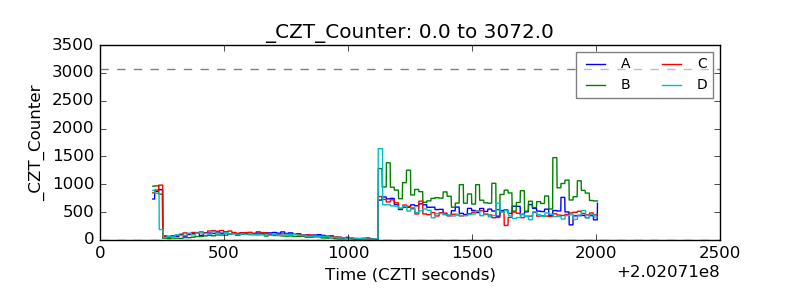 |
| +2.5 Volts monitor |  |
| +5 Volts monitor |  |
| Veto Counter | 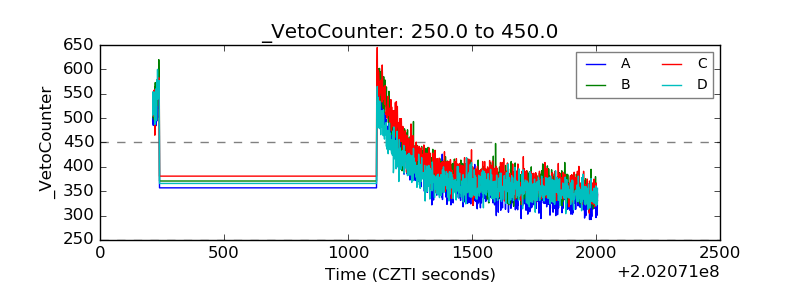 |