| Param | Original file | Final file |
|---|---|---|
| Filename | modeM0/AS1G05_246T04_9000000472_03598cztM0_level2.evt | modeM0/AS1G05_246T04_9000000472_03598cztM0_level2_quad_clean.evt |
| Size (bytes) | 1,521,887,040 | 196,289,280 |
| Size | 1.4 GB | 187.2 MB |
| Events in quadrant A | 9,570,242 | 1,173,908 |
| Events in quadrant B | 9,760,706 | 1,178,349 |
| Events in quadrant C | 16,828,106 | 1,120,857 |
| Events in quadrant D | 8,628,372 | 1,140,868 |
| Mode M0 | |||
|---|---|---|---|
| Quadrant | BADHDUFLAG | Total packets | Discarded packets |
| A | 0 | 41329 | 7 |
| B | 0 | 41654 | 4 |
| C | 0 | 63138 | 9 |
| D | 0 | 40508 | 4 |
| Mode SS | |||
|---|---|---|---|
| Quadrant | BADHDUFLAG | Total packets | Discarded packets |
| A | 0 | 392 | 0 |
| B | 0 | 392 | 0 |
| C | 0 | 392 | 0 |
| D | 0 | 392 | 0 |
| Mode M9 | |||
|---|---|---|---|
| Quadrant | BADHDUFLAG | Total packets | Discarded packets |
| A | 0 | 23 | 0 |
| B | 0 | 23 | 0 |
| C | 0 | 23 | 0 |
| D | 0 | 23 | 0 |
| Quadrant | Total seconds | Saturated seconds | Saturation percentage |
|---|---|---|---|
| A | 19314 | 210 | 1.087294% |
| B | 19315 | 249 | 1.289154% |
| C | 19314 | 1620 | 8.387698% |
| D | 19315 | 197 | 1.019933% |
Noise dominated data is calculated using 1-second bins in cleaned event files. If a bin has >2000 counts, and if more than 50% of those come from <1% of pixels, then it is considered to be noise-dominated and hence unusable.
| Quadrant | # 1 sec bins | Bins with >0 counts | Bins with >2000 counts | High rate bins dominated by noise | Noise dominated (total time) | Noise dominated (detector-on time) | Marked lightcurve |
|---|---|---|---|---|---|---|---|
| A | 21475 | 19320 | 21 | 21 | 0.10% | 0.11% | 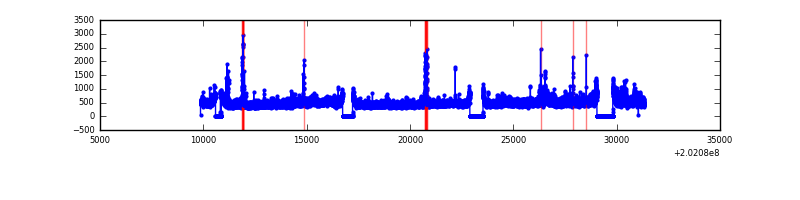 |
| B | 21475 | 19320 | 39 | 39 | 0.18% | 0.20% | 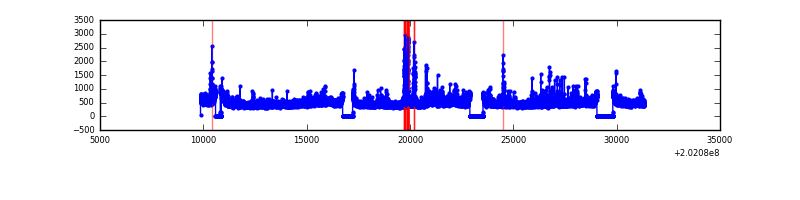 |
| C | 21475 | 19320 | 1166 | 1166 | 5.43% | 6.04% | 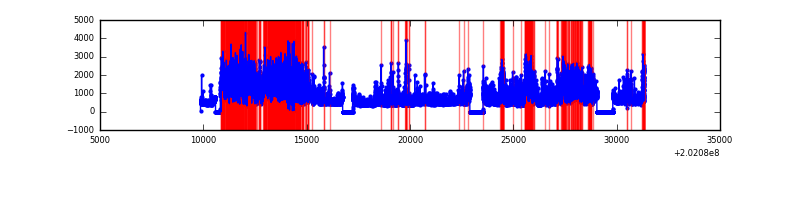 |
| D | 21475 | 19320 | 65 | 65 | 0.30% | 0.34% | 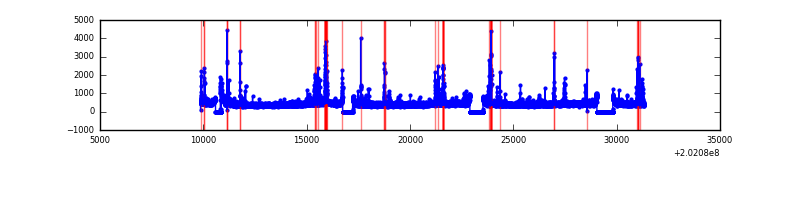 |
Top three noisy pixels from each quadrant. If the there are fewer than three noisy pixels in the level2.evt file, extra rows are filled as -1
| Pixel properties | Quadrant properties | ||||||
|---|---|---|---|---|---|---|---|
| Quadrant | DetID | PixID | Counts | Sigma | Mean | Median | Sigma |
| A | 8 | 15 | 701081 | 1558.2 | 2191 | 2140 | 448.6 |
| A | 13 | 164 | 138849 | 304.78 | 2191 | 2140 | 448.6 |
| A | 3 | 1 | 136382 | 299.28 | 2191 | 2140 | 448.6 |
| B | 15 | 204 | 620304 | 1437.06 | 2226 | 2167 | 430.1 |
| B | 4 | 81 | 215408 | 495.75 | 2226 | 2167 | 430.1 |
| B | 14 | 167 | 204313 | 469.96 | 2226 | 2167 | 430.1 |
| C | 2 | 53 | 7085882 | 14527.07 | 2090 | 2099 | 487.6 |
| C | 9 | 247 | 1412723 | 2892.84 | 2090 | 2099 | 487.6 |
| C | 15 | 208 | 85350 | 170.73 | 2090 | 2099 | 487.6 |
| D | 13 | 223 | 139914 | 269.05 | 2131 | 2070 | 512.3 |
| D | 10 | 172 | 137827 | 264.98 | 2131 | 2070 | 512.3 |
| D | 13 | 239 | 75278 | 142.89 | 2131 | 2070 | 512.3 |
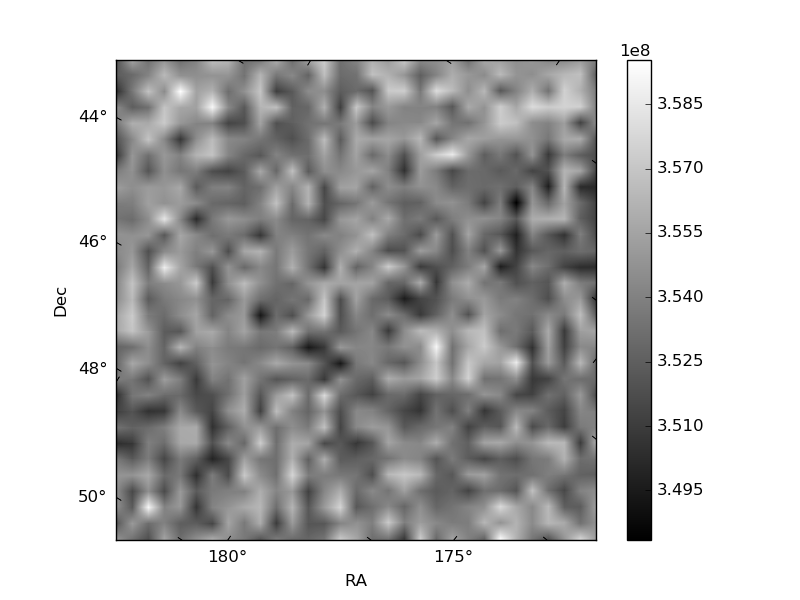
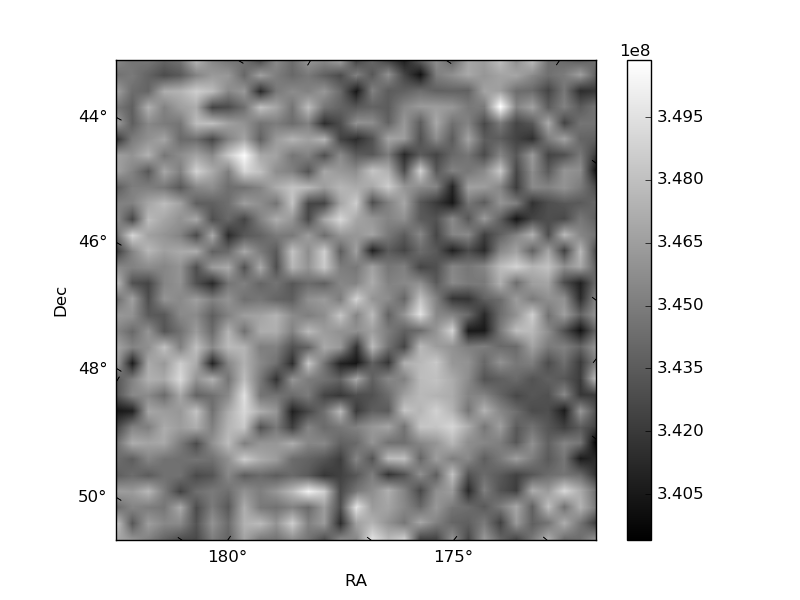
Histogram calculated using DETX and DETY for each event in the final _common_clean file
| Quadrant A | 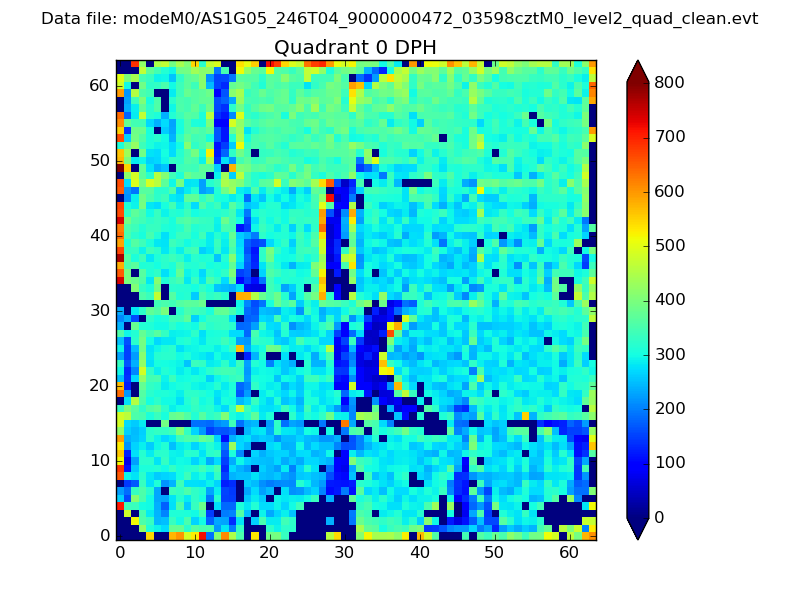 |
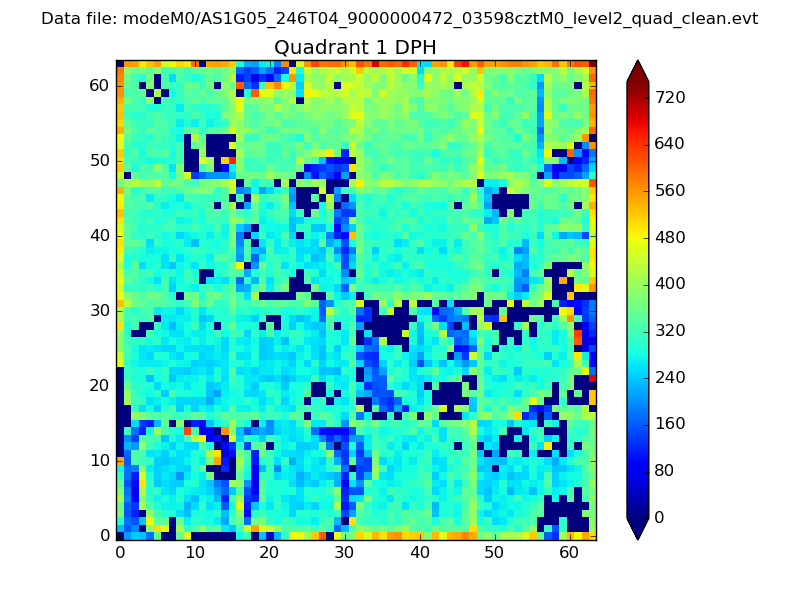 |
Quadrant B |
|---|---|---|---|
| Quadrant D | 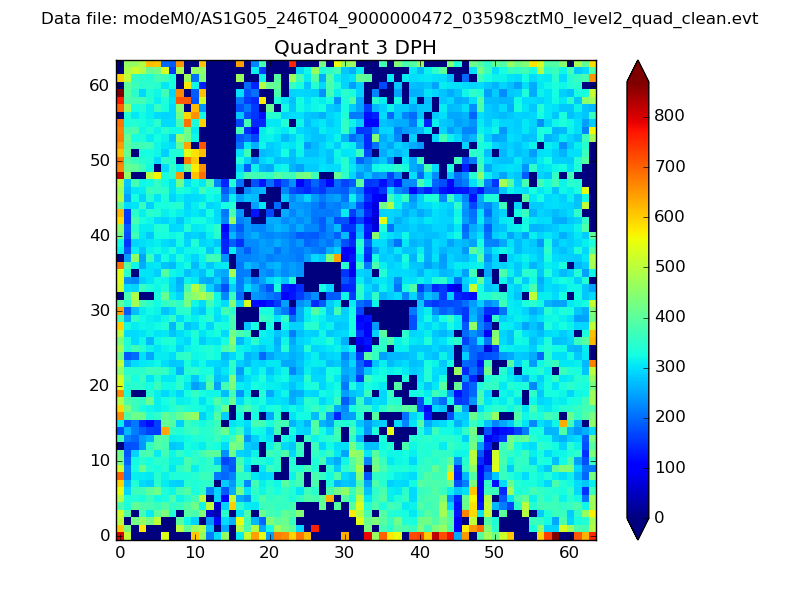 |
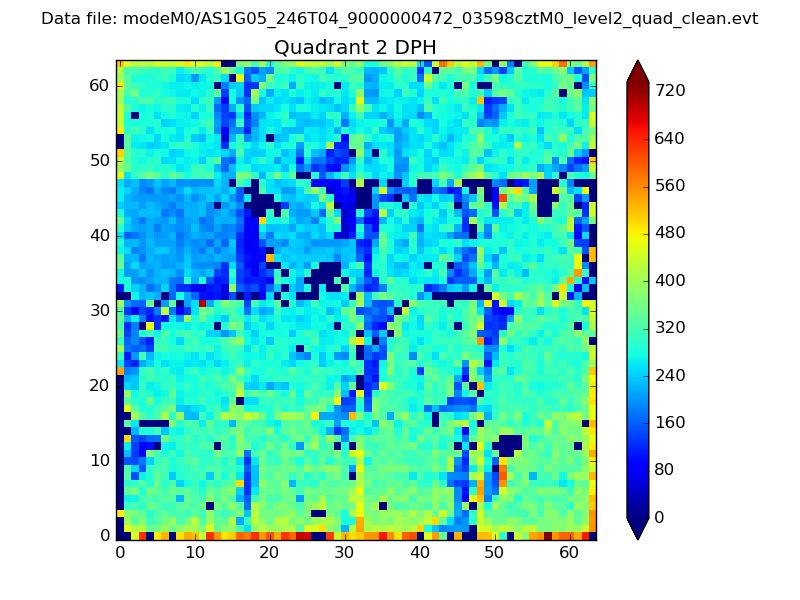 |
Quadrant C |
| Plot type | Count rate plots | Images |
|---|---|---|
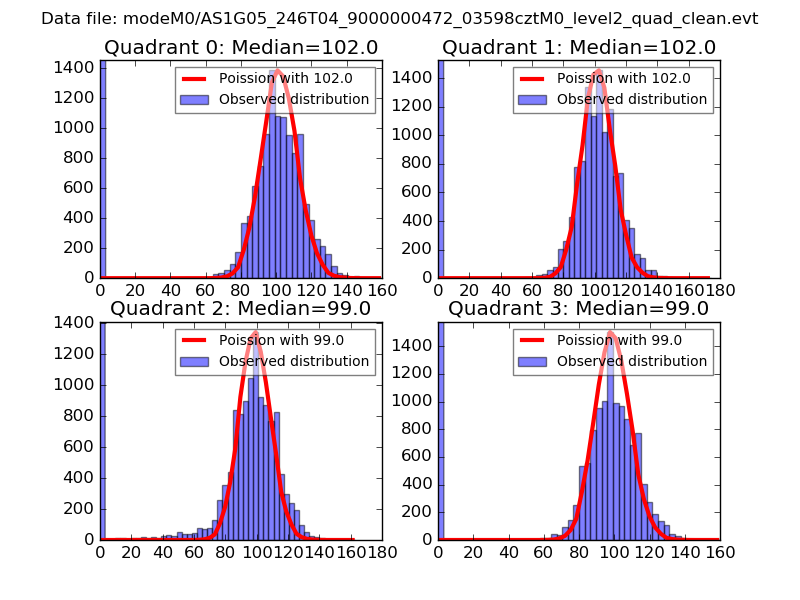
| Comparison with Poisson distribution Blue bars denote a histogram of data divided into 1 sec bins. Red curve is a Poisson curve with rate = median count rate of data. |
 |
 |
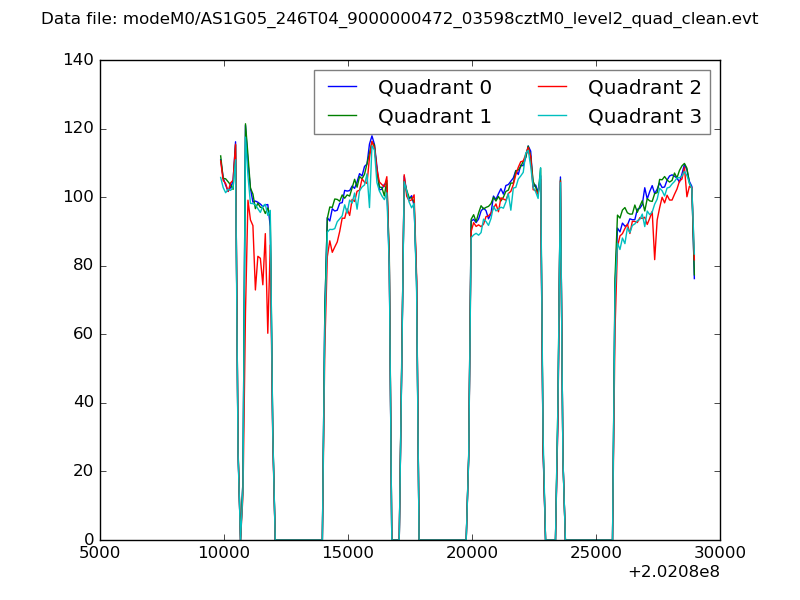
| Quadrant-wise count rates Data is divided into 100 sec bins |
 |
|
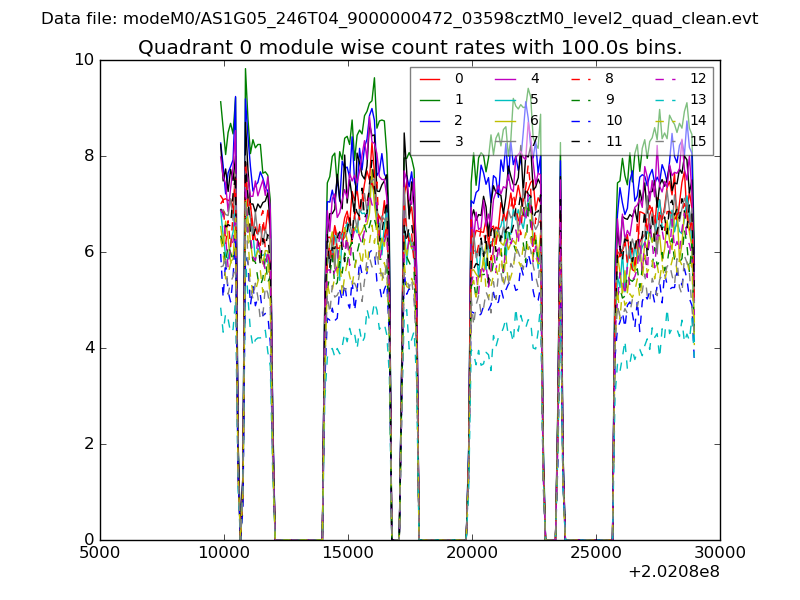
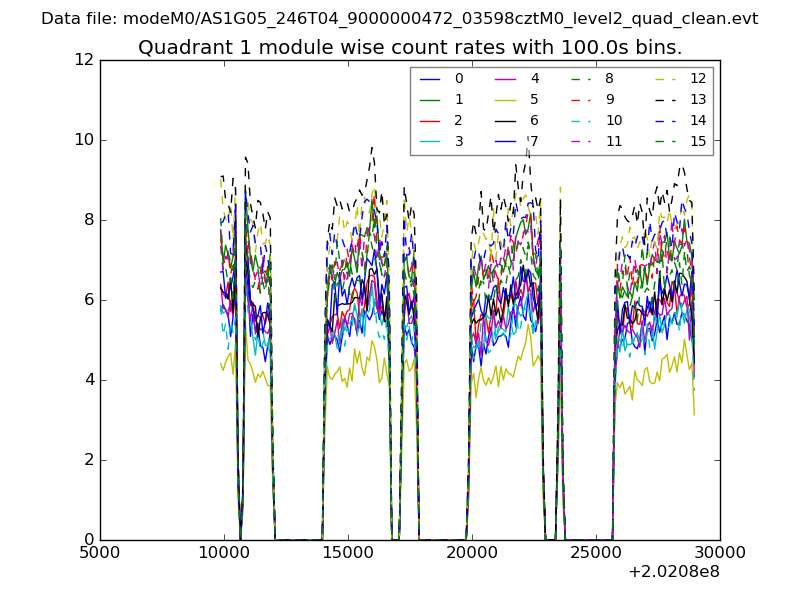
| Module-wise count rates for Quadrant A Data is divided into 100 sec bins |
 |
 |
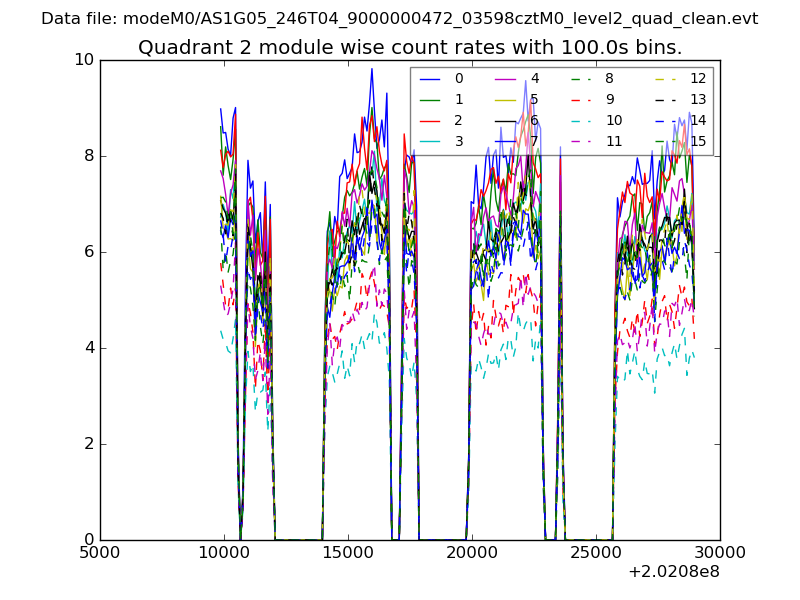
| Module-wise count rates for Quadrant B Data is divided into 100 sec bins |
 |
 |
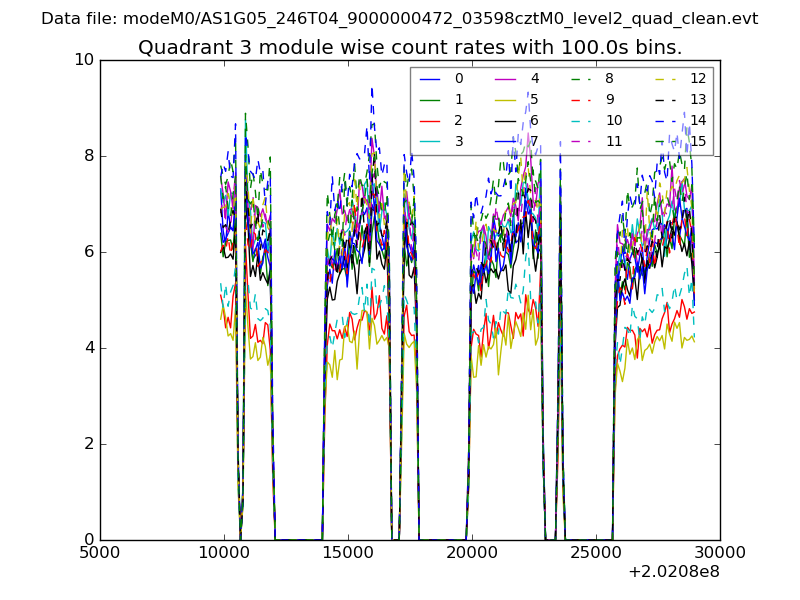
| Module-wise count rates for Quadrant C Data is divided into 100 sec bins |
 |
 |
| Module-wise count rates for Quadrant D Data is divided into 100 sec bins |
 |
 |
| Parameter | Plot |
|---|---|
| CZT HV Monitor | 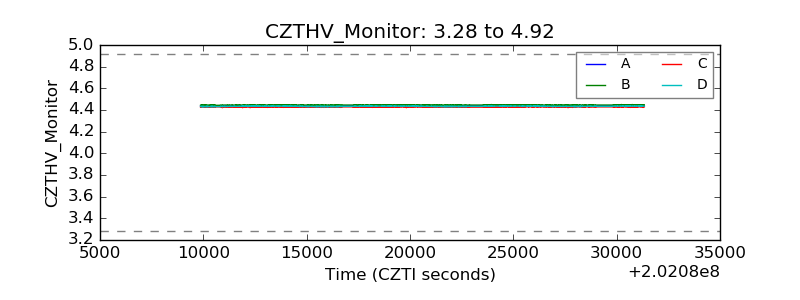 |
| D_VDD |  |
| Temperature 1 | 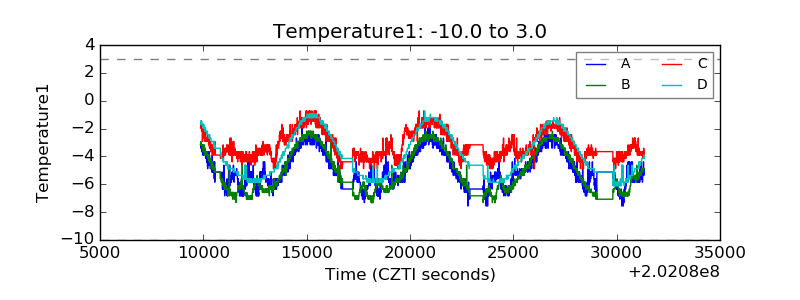 |
| Veto HV Monitor | 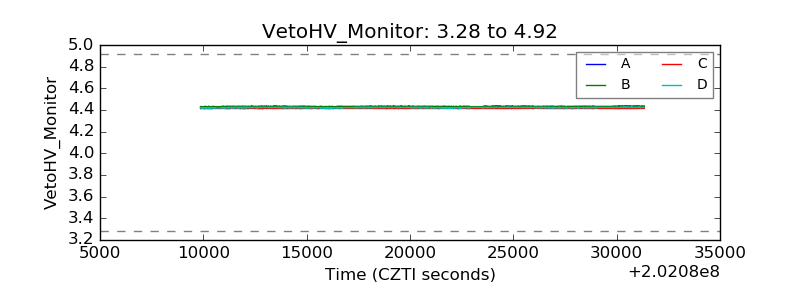 |
| Veto LLD | 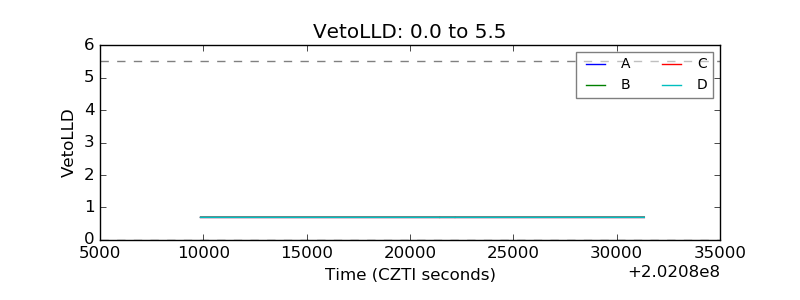 |
| Alpha Counter | 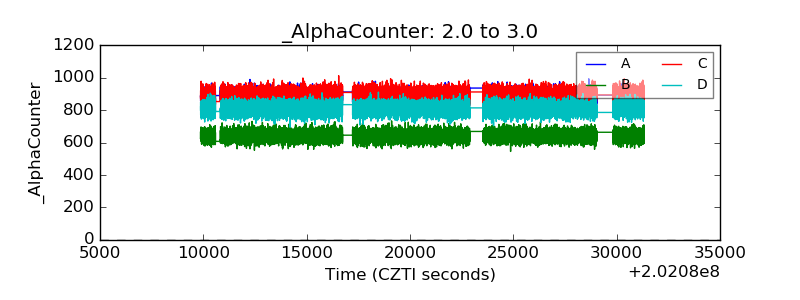 |
| _CPM_Rate | 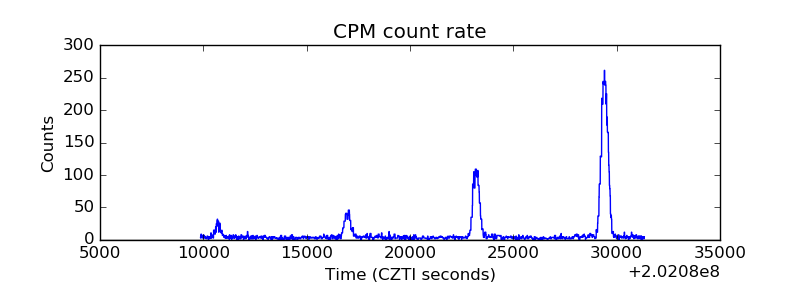 |
| CZT Counter | 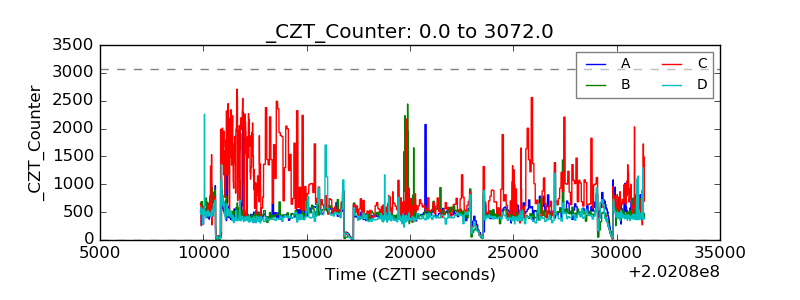 |
| +2.5 Volts monitor |  |
| +5 Volts monitor |  |
| Veto Counter | 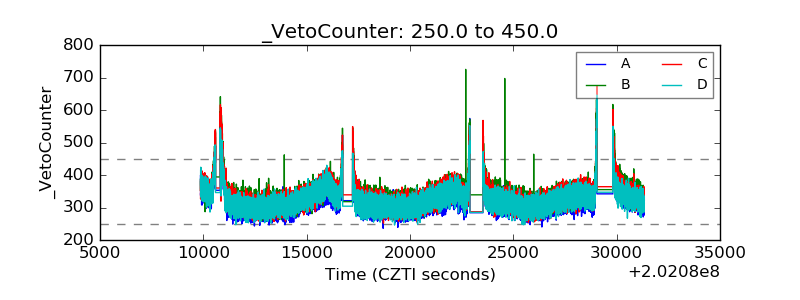 |