| Param | Original file | Final file |
|---|---|---|
| Filename | modeM0/AS1G05_246T04_9000000472_03599cztM0_level2.evt | modeM0/AS1G05_246T04_9000000472_03599cztM0_level2_quad_clean.evt |
| Size (bytes) | 559,972,800 | 62,418,240 |
| Size | 534.0 MB | 59.5 MB |
| Events in quadrant A | 4,153,764 | 362,543 |
| Events in quadrant B | 3,483,546 | 366,591 |
| Events in quadrant C | 5,777,553 | 329,071 |
| Events in quadrant D | 3,082,207 | 356,657 |
| Mode M0 | |||
|---|---|---|---|
| Quadrant | BADHDUFLAG | Total packets | Discarded packets |
| A | 0 | 16933 | 3 |
| B | 0 | 14601 | 2 |
| C | 0 | 21638 | 2 |
| D | 0 | 14256 | 2 |
| Mode SS | |||
|---|---|---|---|
| Quadrant | BADHDUFLAG | Total packets | Discarded packets |
| A | 0 | 136 | 0 |
| B | 0 | 136 | 0 |
| C | 0 | 136 | 0 |
| D | 0 | 136 | 0 |
| Mode M9 | |||
|---|---|---|---|
| Quadrant | BADHDUFLAG | Total packets | Discarded packets |
| A | 0 | 13 | 0 |
| B | 0 | 13 | 0 |
| C | 0 | 13 | 0 |
| D | 0 | 14 | 0 |
| Quadrant | Total seconds | Saturated seconds | Saturation percentage |
|---|---|---|---|
| A | 6817 | 163 | 2.391081% |
| B | 6817 | 106 | 1.554936% |
| C | 6817 | 779 | 11.427314% |
| D | 6817 | 88 | 1.290890% |
Noise dominated data is calculated using 1-second bins in cleaned event files. If a bin has >2000 counts, and if more than 50% of those come from <1% of pixels, then it is considered to be noise-dominated and hence unusable.
| Quadrant | # 1 sec bins | Bins with >0 counts | Bins with >2000 counts | High rate bins dominated by noise | Noise dominated (total time) | Noise dominated (detector-on time) | Marked lightcurve |
|---|---|---|---|---|---|---|---|
| A | 7727 | 6818 | 15 | 15 | 0.19% | 0.22% | 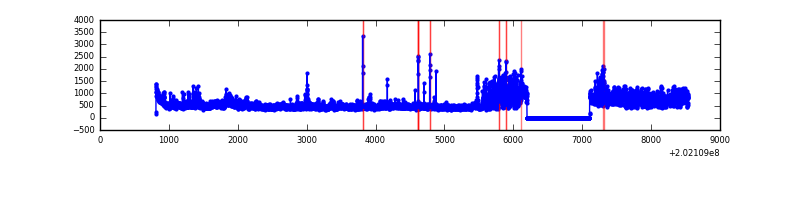 |
| B | 7727 | 6818 | 1 | 1 | 0.01% | 0.01% |  |
| C | 7727 | 6818 | 572 | 572 | 7.40% | 8.39% | 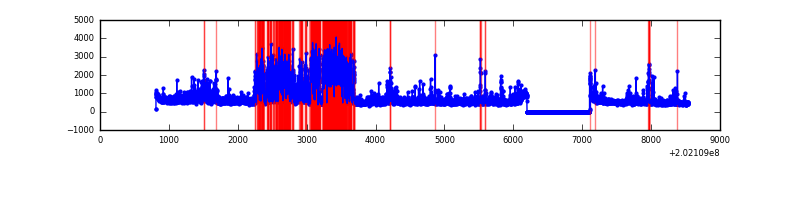 |
| D | 7727 | 6818 | 12 | 12 | 0.16% | 0.18% |  |
Top three noisy pixels from each quadrant. If the there are fewer than three noisy pixels in the level2.evt file, extra rows are filled as -1
| Pixel properties | Quadrant properties | ||||||
|---|---|---|---|---|---|---|---|
| Quadrant | DetID | PixID | Counts | Sigma | Mean | Median | Sigma |
| A | 8 | 15 | 964695 | 5911.02 | 791 | 774 | 163.1 |
| A | 13 | 164 | 80409 | 488.34 | 791 | 774 | 163.1 |
| A | 3 | 1 | 29203 | 174.33 | 791 | 774 | 163.1 |
| B | 15 | 204 | 312573 | 1976.62 | 805 | 783 | 157.7 |
| B | 0 | 182 | 18964 | 115.26 | 805 | 783 | 157.7 |
| B | 3 | 226 | 13443 | 80.26 | 805 | 783 | 157.7 |
| C | 9 | 247 | 2041732 | 11889.83 | 730 | 732 | 171.7 |
| C | 2 | 53 | 867562 | 5049.71 | 730 | 732 | 171.7 |
| C | 13 | 61 | 6236 | 32.06 | 730 | 732 | 171.7 |
| D | 13 | 223 | 56737 | 298.29 | 769 | 745 | 187.7 |
| D | 14 | 34 | 46931 | 246.05 | 769 | 745 | 187.7 |
| D | 13 | 239 | 36948 | 192.87 | 769 | 745 | 187.7 |
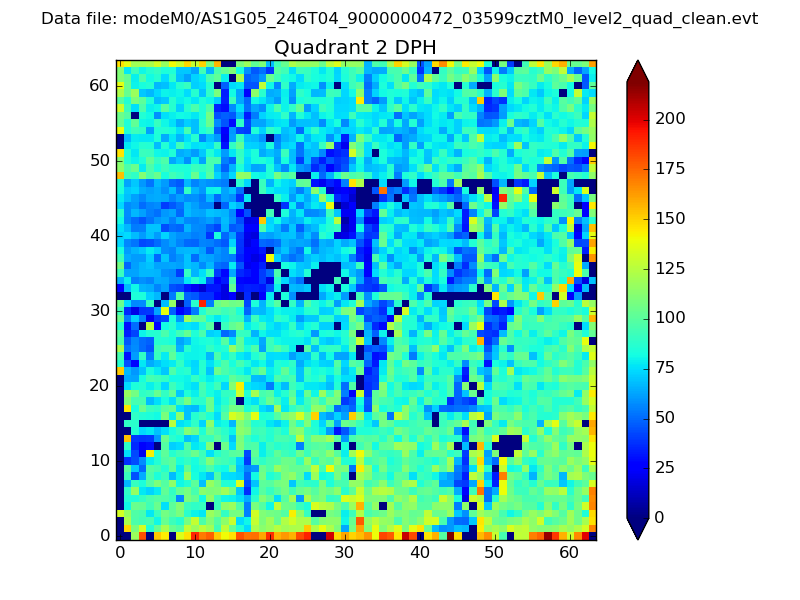
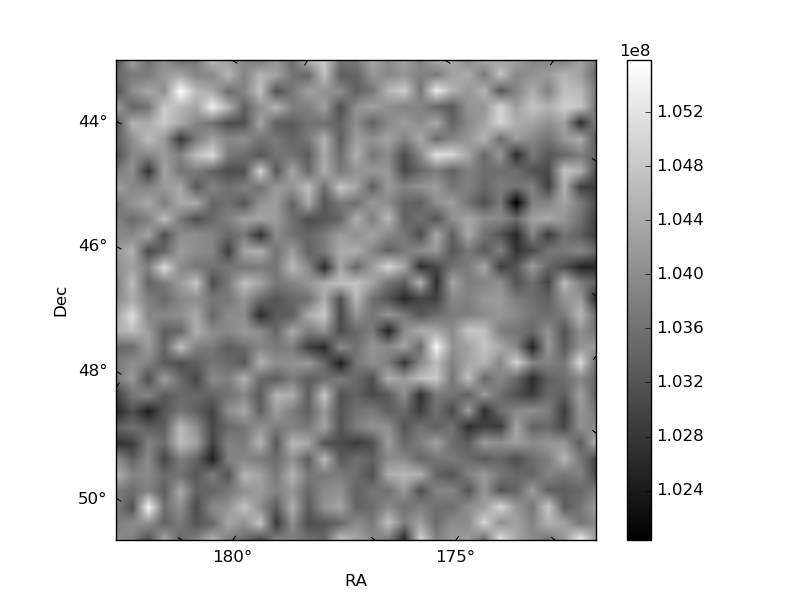
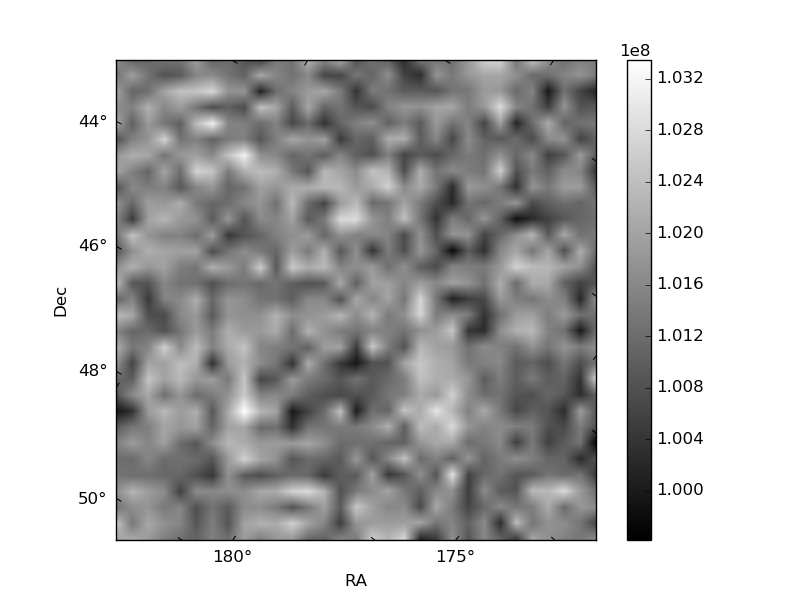
Histogram calculated using DETX and DETY for each event in the final _common_clean file
| Quadrant A | 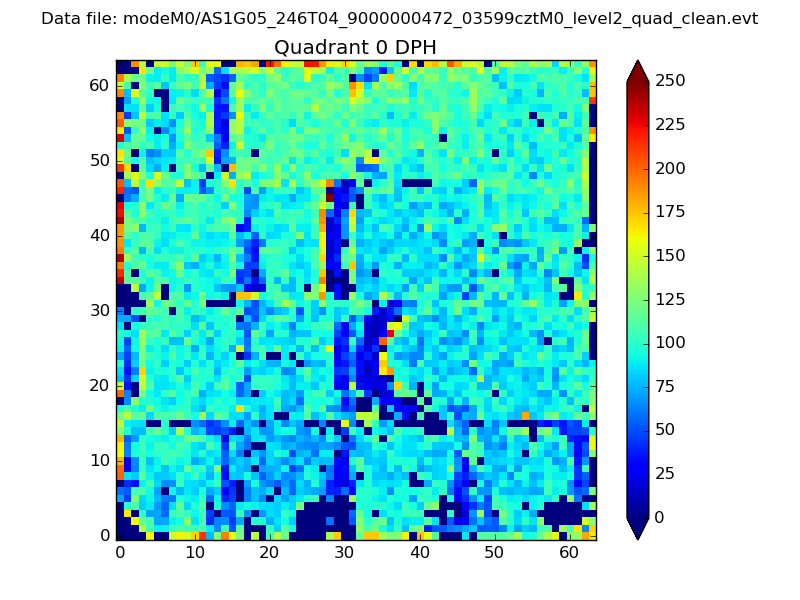 |
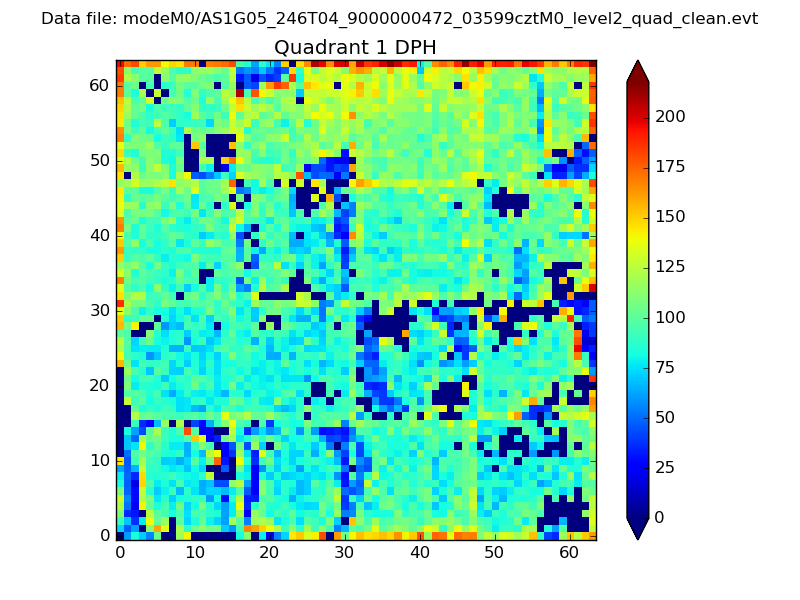 |
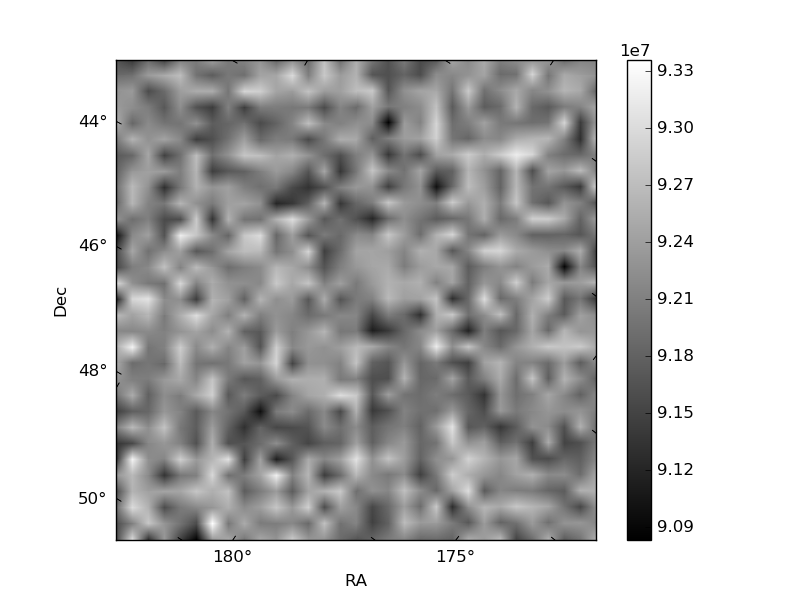
Quadrant B |
|---|---|---|---|
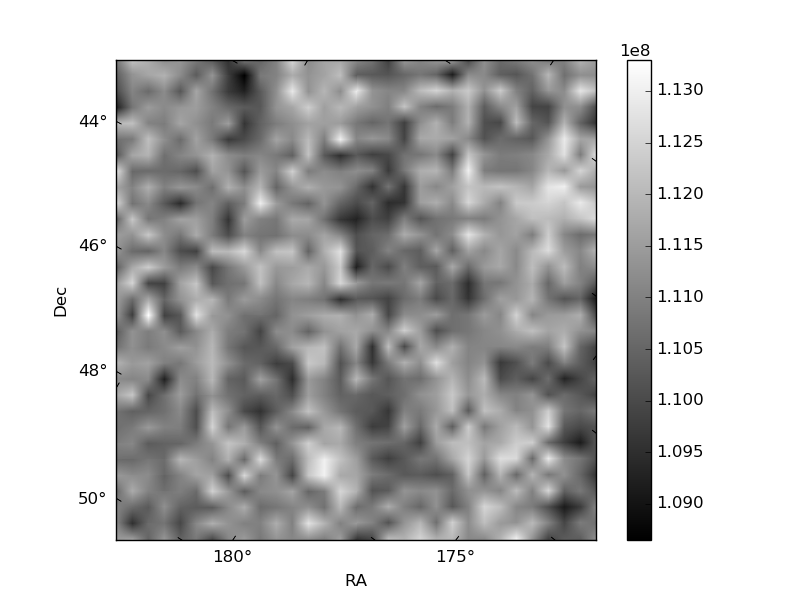
| Quadrant D |  |
 |
Quadrant C |
| Plot type | Count rate plots | Images |
|---|---|---|
| Comparison with Poisson distribution Blue bars denote a histogram of data divided into 1 sec bins. Red curve is a Poisson curve with rate = median count rate of data. |
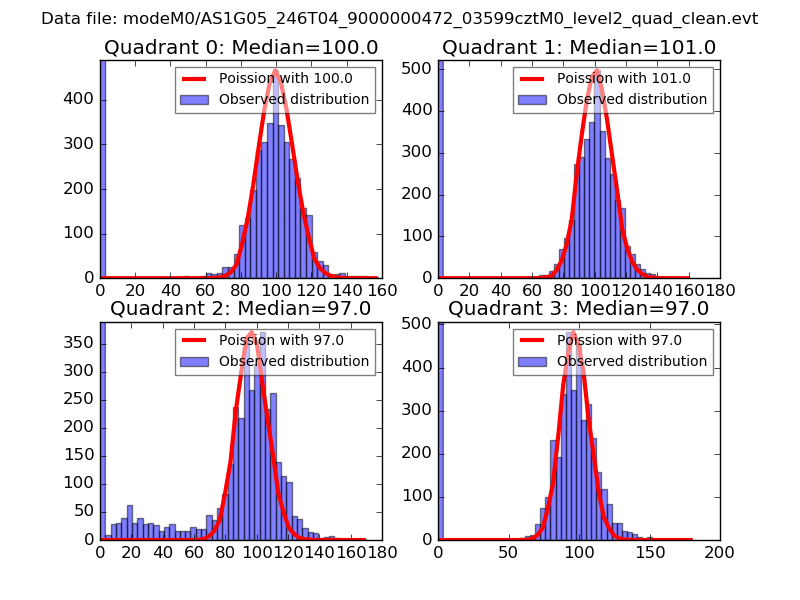 |
 |
| Quadrant-wise count rates Data is divided into 100 sec bins |
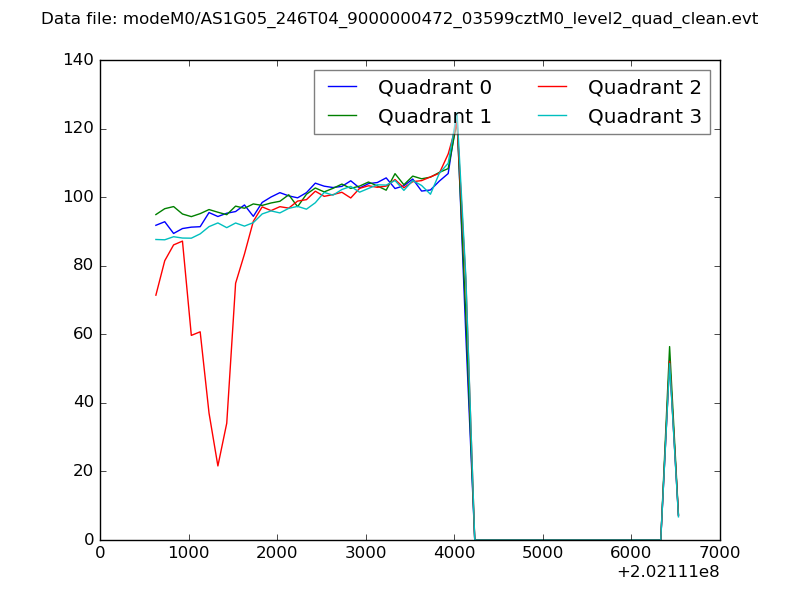 |
|
| Module-wise count rates for Quadrant A Data is divided into 100 sec bins |
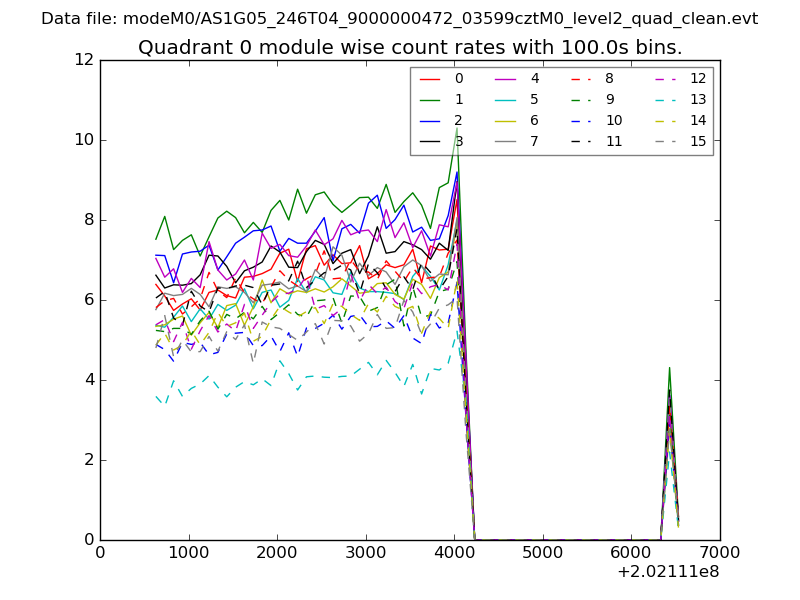 |
 |
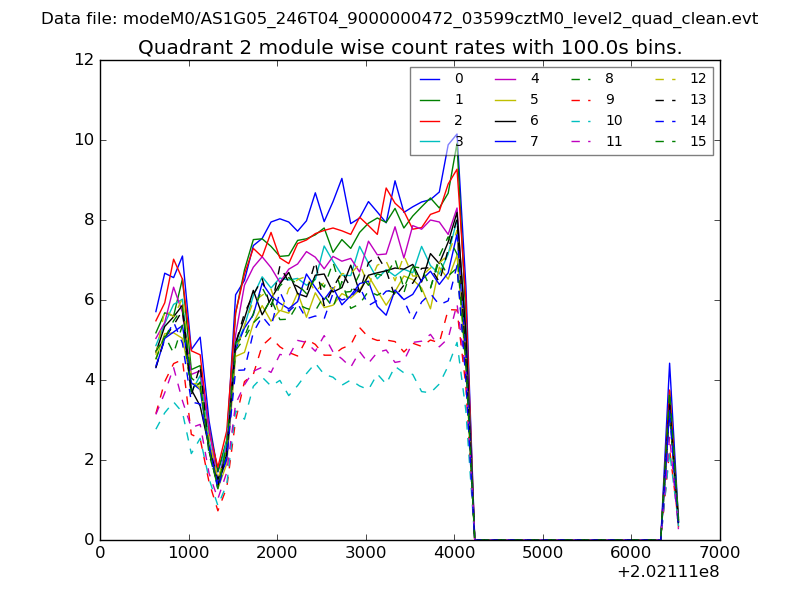
| Module-wise count rates for Quadrant B Data is divided into 100 sec bins |
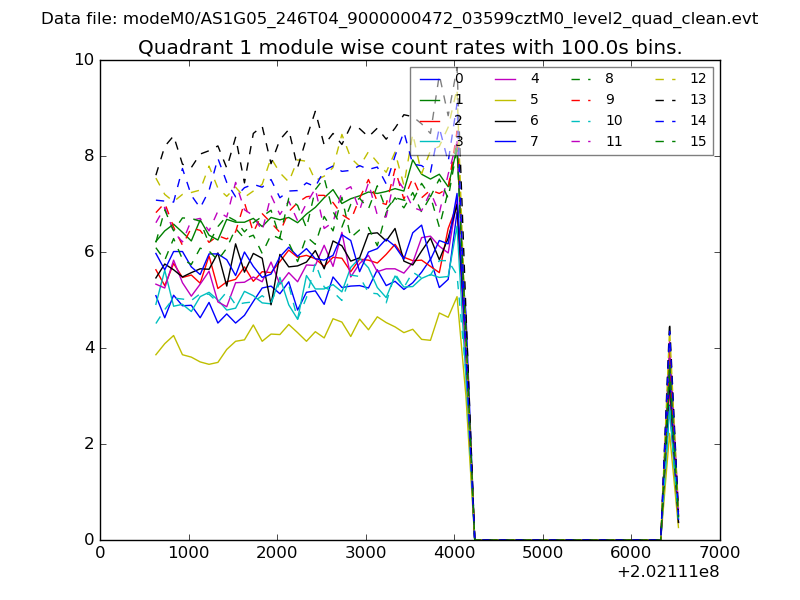 |
 |
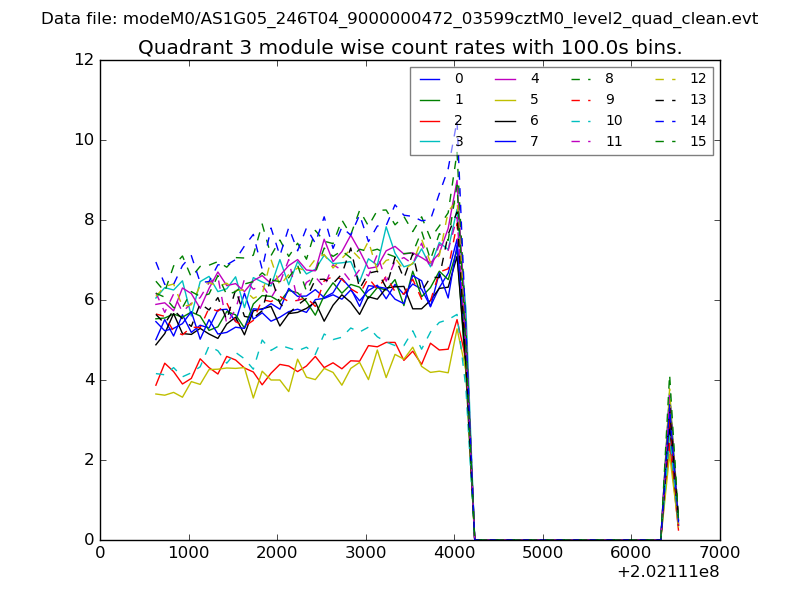
| Module-wise count rates for Quadrant C Data is divided into 100 sec bins |
 |
 |
| Module-wise count rates for Quadrant D Data is divided into 100 sec bins |
 |
 |
| Parameter | Plot |
|---|---|
| CZT HV Monitor | 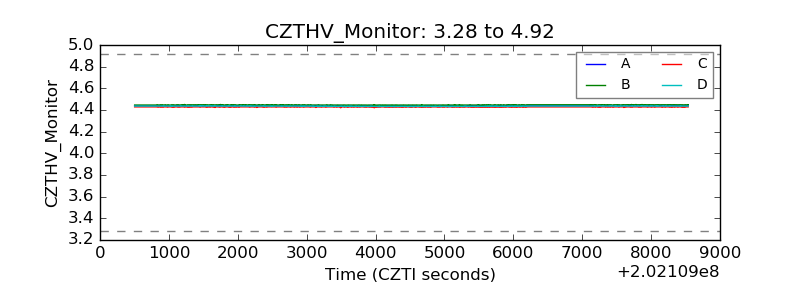 |
| D_VDD | 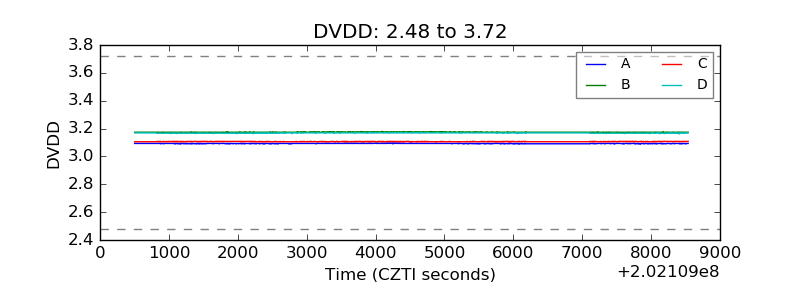 |
| Temperature 1 | 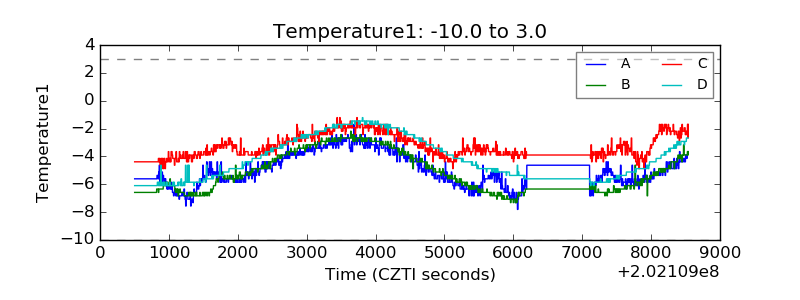 |
| Veto HV Monitor | 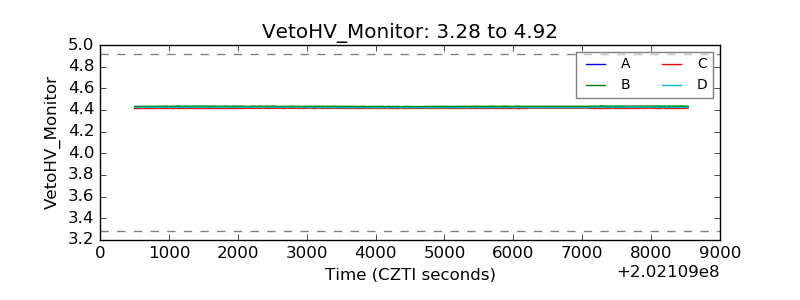 |
| Veto LLD |  |
| Alpha Counter | 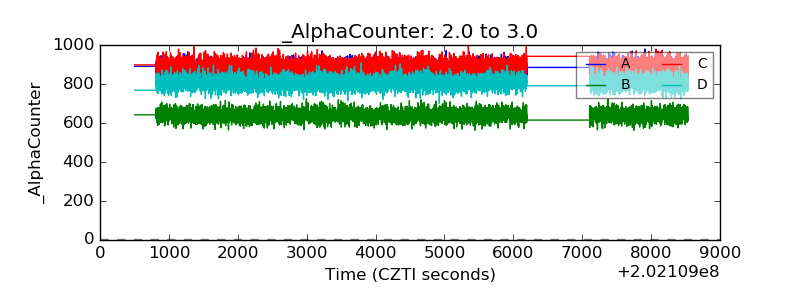 |
| _CPM_Rate | 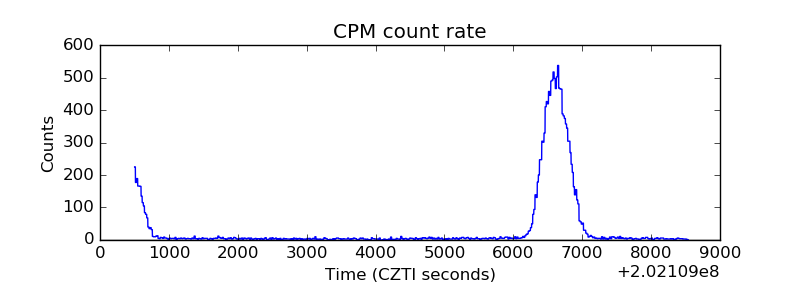 |
| CZT Counter | 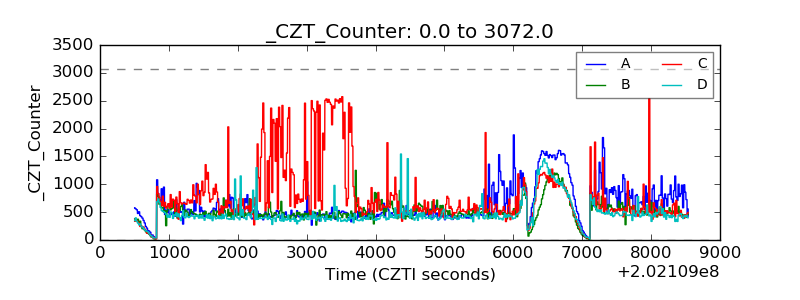 |
| +2.5 Volts monitor | 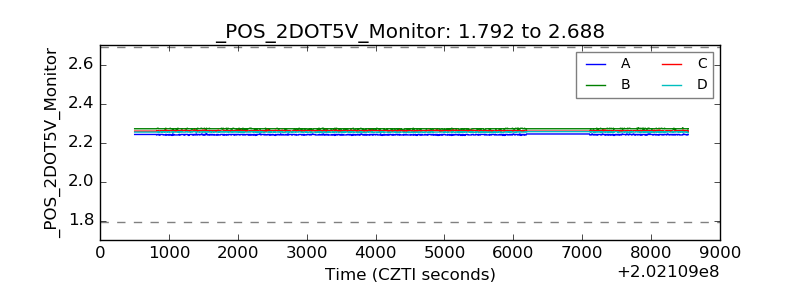 |
| +5 Volts monitor |  |
| Veto Counter | 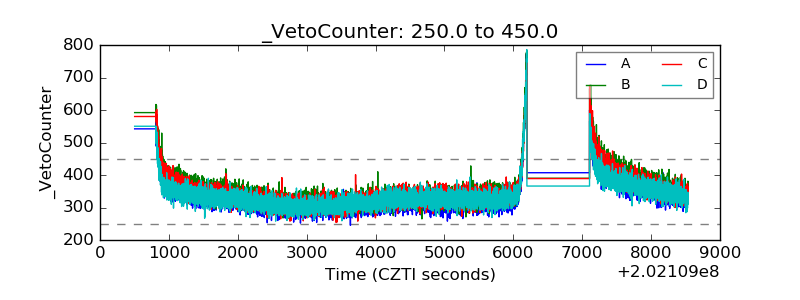 |