| Param | Original file | Final file |
|---|---|---|
| Filename | modeM0/AS1G05_246T04_9000000472_03601cztM0_level2.evt | modeM0/AS1G05_246T04_9000000472_03601cztM0_level2_quad_clean.evt |
| Size (bytes) | 506,744,640 | 74,404,800 |
| Size | 483.3 MB | 71.0 MB |
| Events in quadrant A | 4,500,473 | 448,182 |
| Events in quadrant B | 3,635,582 | 453,179 |
| Events in quadrant C | 3,555,692 | 445,137 |
| Events in quadrant D | 3,192,987 | 431,786 |
| Mode M0 | |||
|---|---|---|---|
| Quadrant | BADHDUFLAG | Total packets | Discarded packets |
| A | 0 | 18139 | 3 |
| B | 0 | 14997 | 2 |
| C | 0 | 15147 | 2 |
| D | 0 | 14393 | 2 |
| Mode SS | |||
|---|---|---|---|
| Quadrant | BADHDUFLAG | Total packets | Discarded packets |
| A | 0 | 138 | 0 |
| B | 0 | 138 | 0 |
| C | 0 | 138 | 0 |
| D | 0 | 138 | 0 |
| Mode M9 | |||
|---|---|---|---|
| Quadrant | BADHDUFLAG | Total packets | Discarded packets |
| A | 0 | 18 | 0 |
| B | 0 | 18 | 0 |
| C | 0 | 18 | 0 |
| D | 0 | 19 | 0 |
| Quadrant | Total seconds | Saturated seconds | Saturation percentage |
|---|---|---|---|
| A | 6812 | 178 | 2.613036% |
| B | 6812 | 85 | 1.247798% |
| C | 6812 | 113 | 1.658837% |
| D | 6812 | 85 | 1.247798% |
Noise dominated data is calculated using 1-second bins in cleaned event files. If a bin has >2000 counts, and if more than 50% of those come from <1% of pixels, then it is considered to be noise-dominated and hence unusable.
| Quadrant | # 1 sec bins | Bins with >0 counts | Bins with >2000 counts | High rate bins dominated by noise | Noise dominated (total time) | Noise dominated (detector-on time) | Marked lightcurve |
|---|---|---|---|---|---|---|---|
| A | 7882 | 6813 | 43 | 43 | 0.55% | 0.63% | 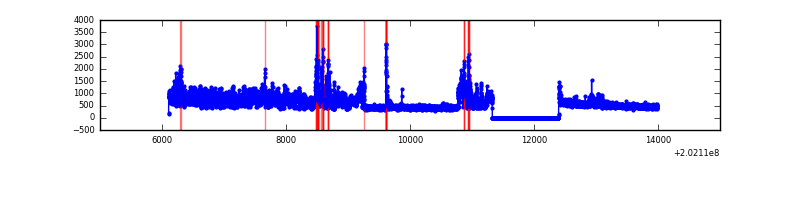 |
| B | 7882 | 6813 | 0 | 0 | 0.00% | 0.00% | 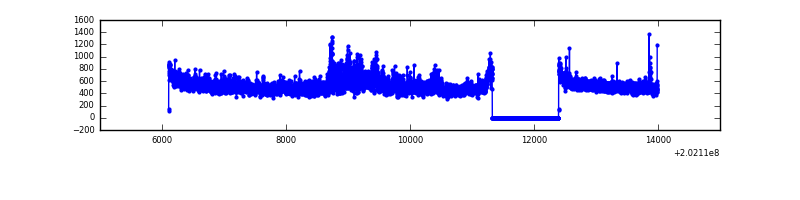 |
| C | 7882 | 6813 | 29 | 29 | 0.37% | 0.43% | 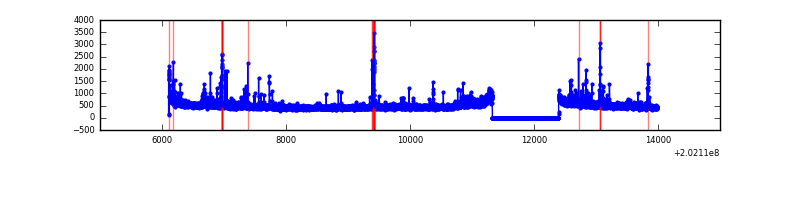 |
| D | 7882 | 6813 | 26 | 26 | 0.33% | 0.38% | 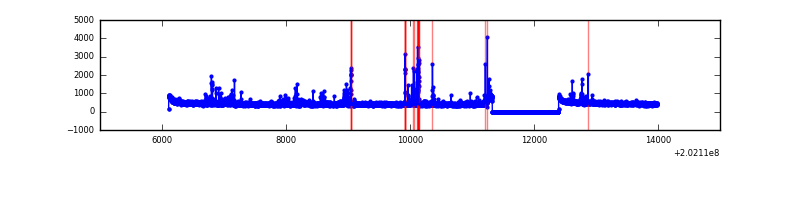 |
Top three noisy pixels from each quadrant. If the there are fewer than three noisy pixels in the level2.evt file, extra rows are filled as -1
| Pixel properties | Quadrant properties | ||||||
|---|---|---|---|---|---|---|---|
| Quadrant | DetID | PixID | Counts | Sigma | Mean | Median | Sigma |
| A | 8 | 15 | 1242734 | 7442.7 | 808 | 789 | 166.9 |
| A | 0 | 50 | 125526 | 747.52 | 808 | 789 | 166.9 |
| A | 13 | 164 | 22521 | 130.24 | 808 | 789 | 166.9 |
| B | 15 | 204 | 406054 | 2555.58 | 817 | 796 | 158.6 |
| B | 0 | 219 | 16971 | 102.0 | 817 | 796 | 158.6 |
| B | 0 | 182 | 13630 | 80.93 | 817 | 796 | 158.6 |
| C | 2 | 53 | 302287 | 1676.77 | 776 | 778 | 179.8 |
| C | 9 | 247 | 197317 | 1093.0 | 776 | 778 | 179.8 |
| C | 1 | 16 | 12707 | 66.34 | 776 | 778 | 179.8 |
| D | 13 | 223 | 107967 | 569.13 | 779 | 755 | 188.4 |
| D | 3 | 12 | 44979 | 234.76 | 779 | 755 | 188.4 |
| D | 14 | 34 | 24708 | 127.15 | 779 | 755 | 188.4 |
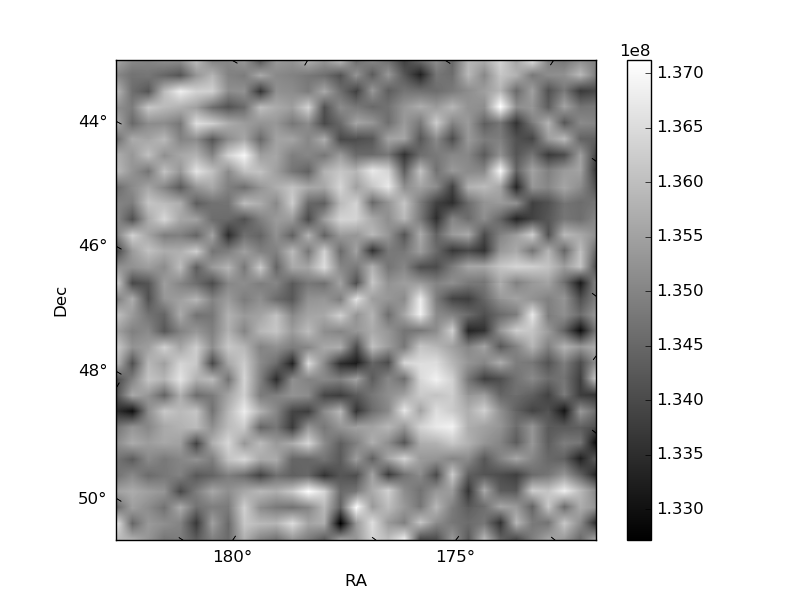
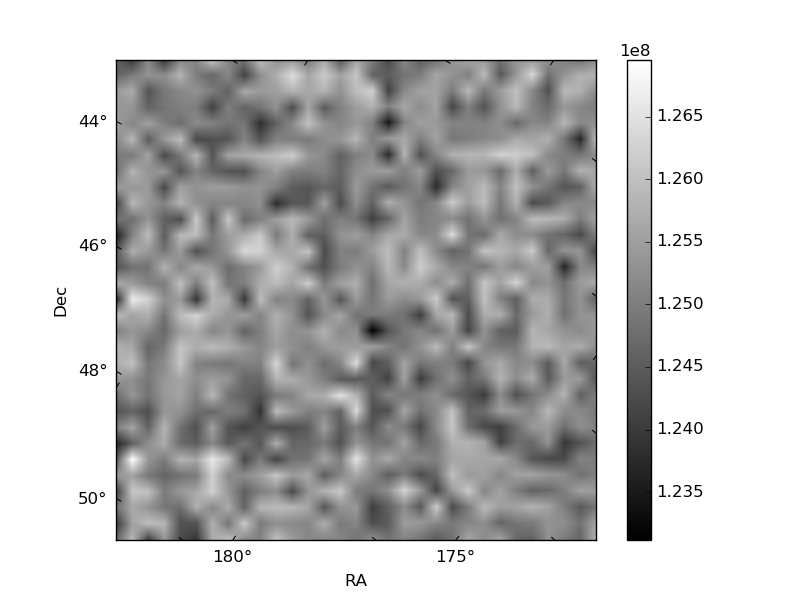
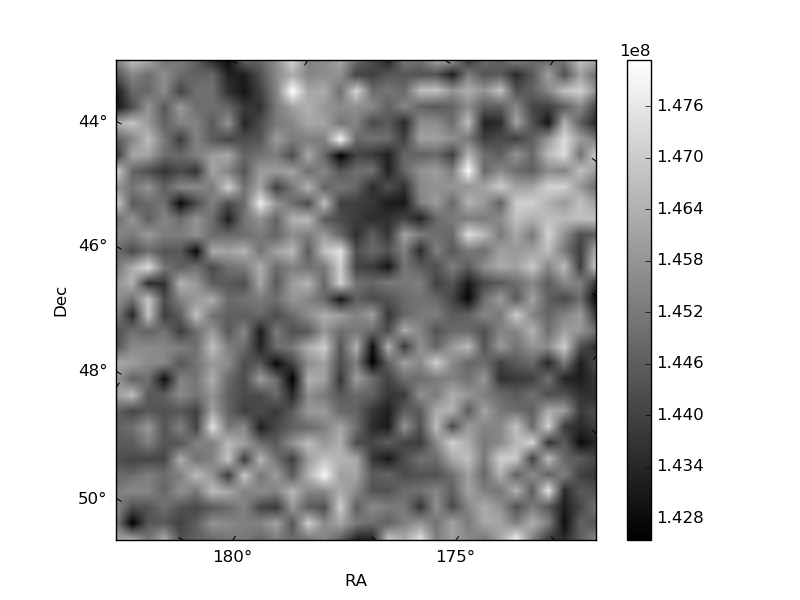
Histogram calculated using DETX and DETY for each event in the final _common_clean file
| Quadrant A | 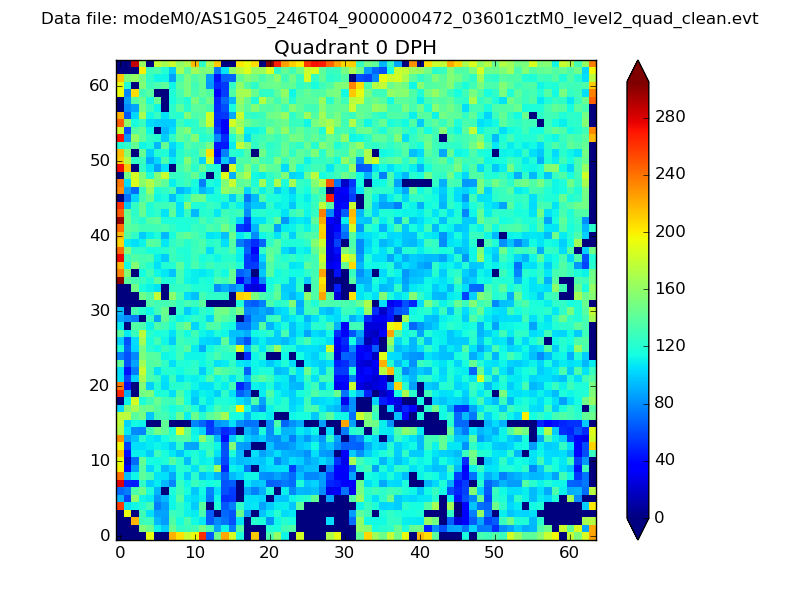 |
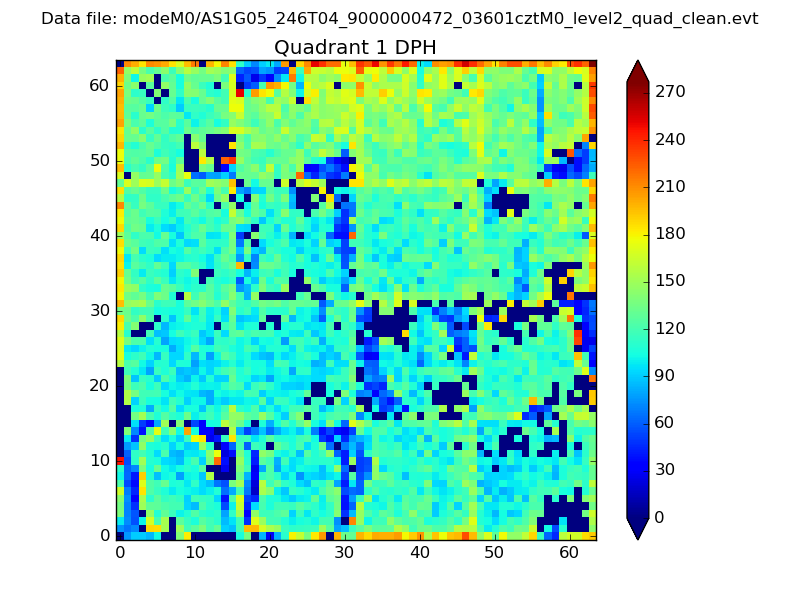 |
Quadrant B |
|---|---|---|---|
| Quadrant D | 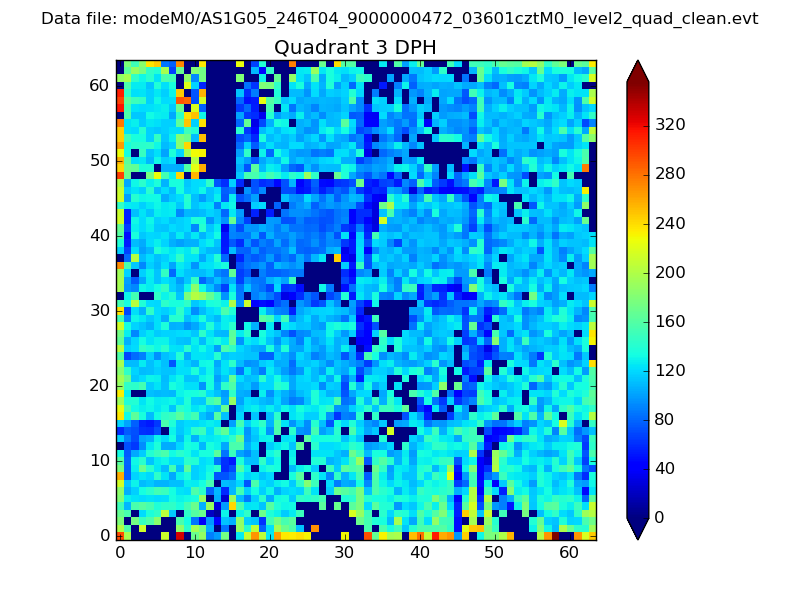 |
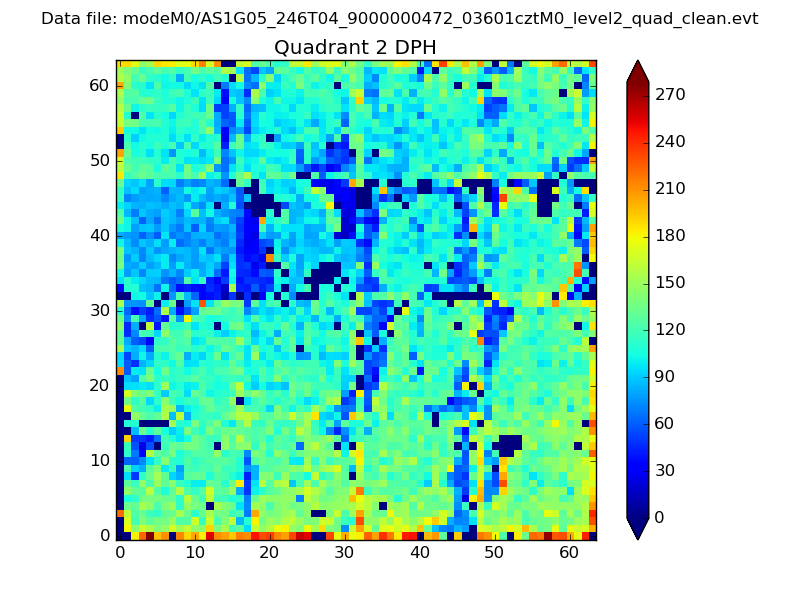 |
Quadrant C |
| Plot type | Count rate plots | Images |
|---|---|---|
| Comparison with Poisson distribution Blue bars denote a histogram of data divided into 1 sec bins. Red curve is a Poisson curve with rate = median count rate of data. |
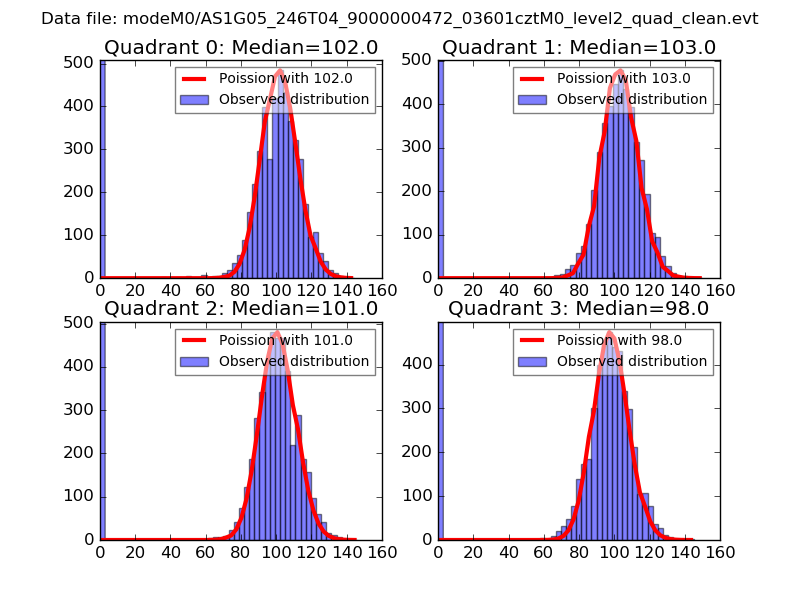 |
 |
| Quadrant-wise count rates Data is divided into 100 sec bins |
 |
|
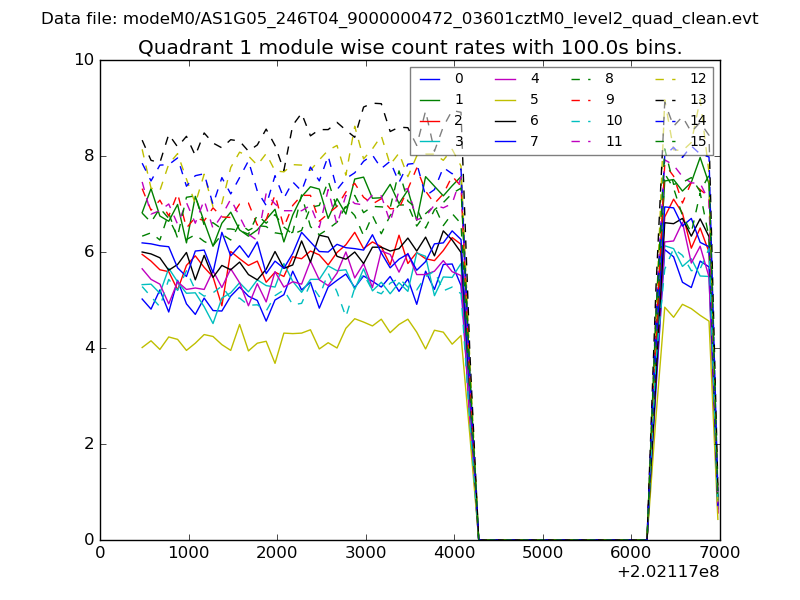
| Module-wise count rates for Quadrant A Data is divided into 100 sec bins |
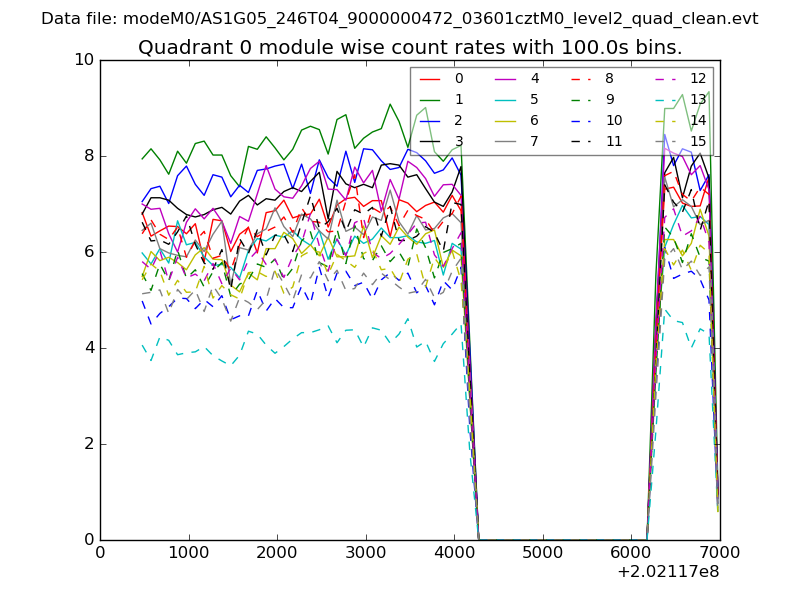 |
 |
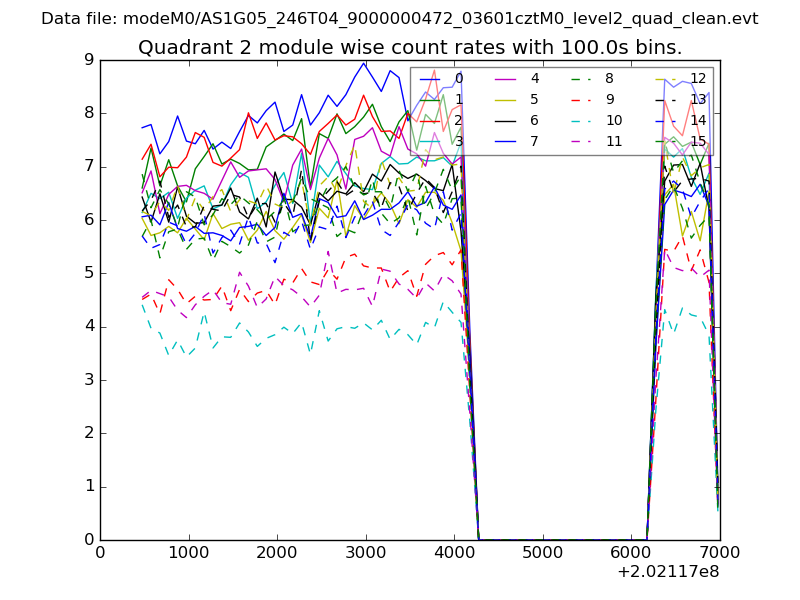
| Module-wise count rates for Quadrant B Data is divided into 100 sec bins |
 |
 |
| Module-wise count rates for Quadrant C Data is divided into 100 sec bins |
 |
 |
| Module-wise count rates for Quadrant D Data is divided into 100 sec bins |
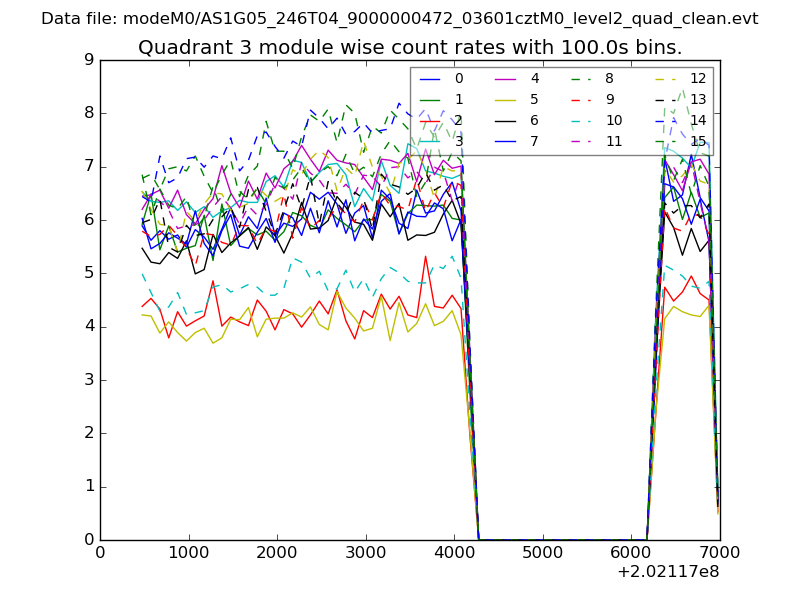 |
 |
| Parameter | Plot |
|---|---|
| CZT HV Monitor | 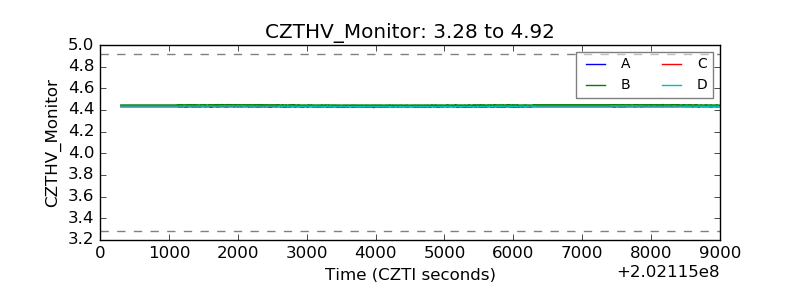 |
| D_VDD | 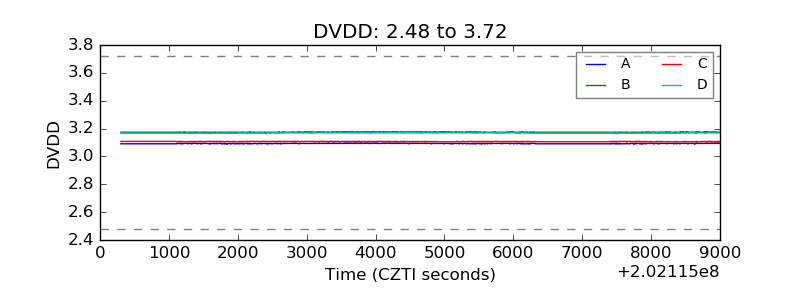 |
| Temperature 1 | 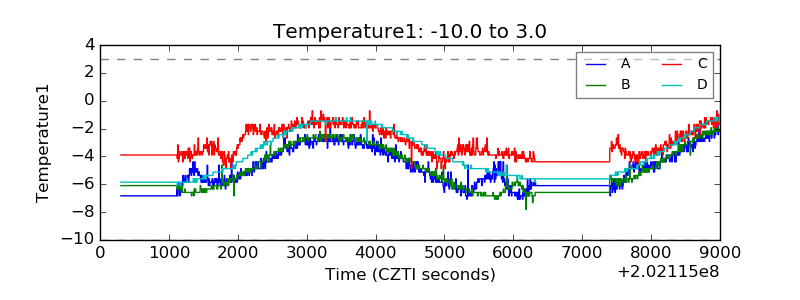 |
| Veto HV Monitor | 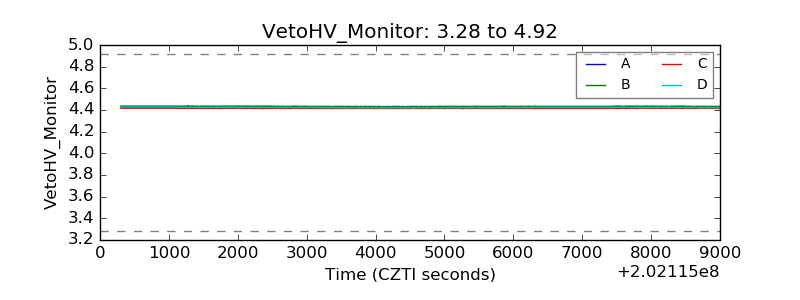 |
| Veto LLD | 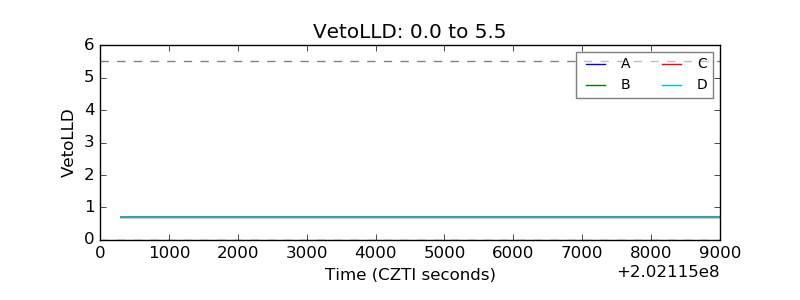 |
| Alpha Counter | 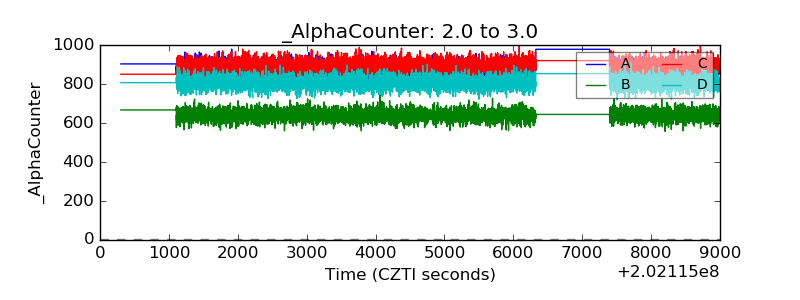 |
| _CPM_Rate | 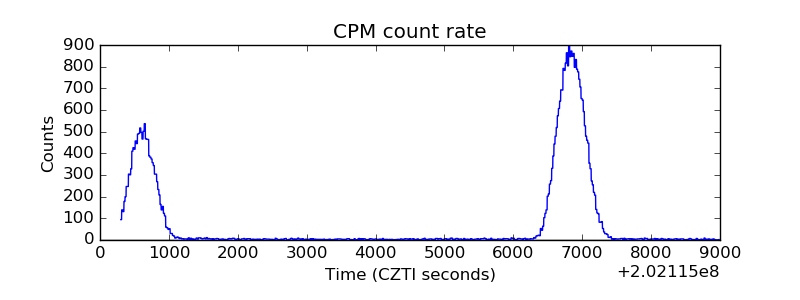 |
| CZT Counter | 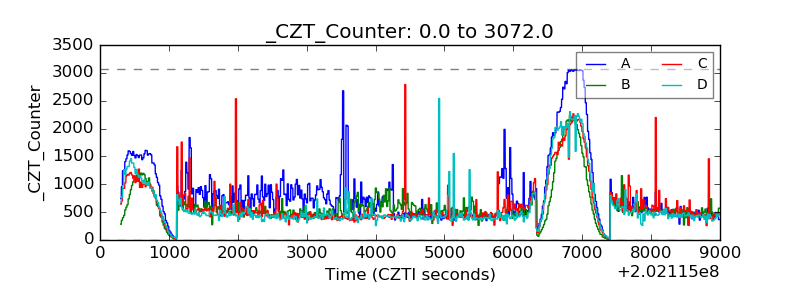 |
| +2.5 Volts monitor |  |
| +5 Volts monitor |  |
| Veto Counter | 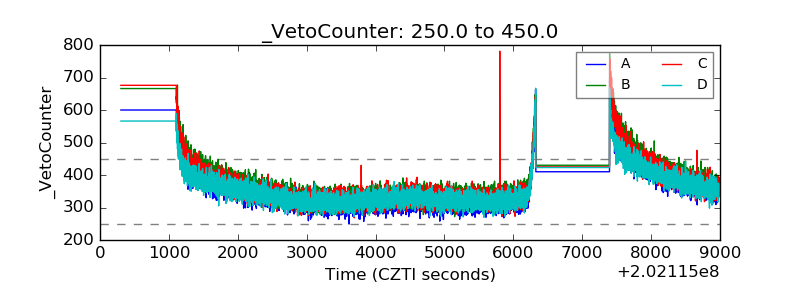 |