| Param | Original file | Final file |
|---|---|---|
| Filename | modeM0/AS1G05_246T04_9000000472_03602cztM0_level2.evt | modeM0/AS1G05_246T04_9000000472_03602cztM0_level2_quad_clean.evt |
| Size (bytes) | 407,036,160 | 82,258,560 |
| Size | 388.2 MB | 78.4 MB |
| Events in quadrant A | 2,991,268 | 526,218 |
| Events in quadrant B | 3,124,937 | 523,815 |
| Events in quadrant C | 3,003,493 | 512,062 |
| Events in quadrant D | 2,791,396 | 501,794 |
| Mode M0 | |||
|---|---|---|---|
| Quadrant | BADHDUFLAG | Total packets | Discarded packets |
| A | 0 | 12952 | 2 |
| B | 0 | 12982 | 1 |
| C | 0 | 12986 | 1 |
| D | 0 | 12683 | 1 |
| Mode SS | |||
|---|---|---|---|
| Quadrant | BADHDUFLAG | Total packets | Discarded packets |
| A | 0 | 124 | 0 |
| B | 0 | 124 | 0 |
| C | 0 | 124 | 0 |
| D | 0 | 124 | 0 |
| Mode M9 | |||
|---|---|---|---|
| Quadrant | BADHDUFLAG | Total packets | Discarded packets |
| A | 0 | 12 | 0 |
| B | 0 | 12 | 0 |
| C | 0 | 12 | 0 |
| D | 0 | 12 | 0 |
| Quadrant | Total seconds | Saturated seconds | Saturation percentage |
|---|---|---|---|
| A | 6117 | 69 | 1.128004% |
| B | 6117 | 61 | 0.997221% |
| C | 6117 | 61 | 0.997221% |
| D | 6117 | 51 | 0.833742% |
Noise dominated data is calculated using 1-second bins in cleaned event files. If a bin has >2000 counts, and if more than 50% of those come from <1% of pixels, then it is considered to be noise-dominated and hence unusable.
| Quadrant | # 1 sec bins | Bins with >0 counts | Bins with >2000 counts | High rate bins dominated by noise | Noise dominated (total time) | Noise dominated (detector-on time) | Marked lightcurve |
|---|---|---|---|---|---|---|---|
| A | 7312 | 6118 | 8 | 8 | 0.11% | 0.13% | 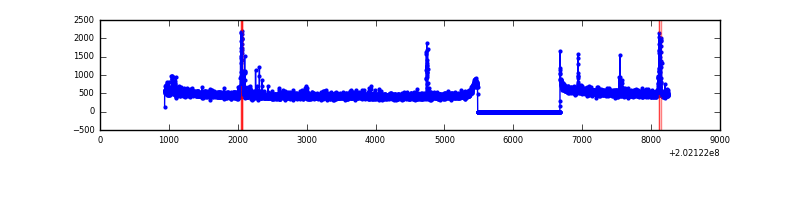 |
| B | 7312 | 6118 | 0 | 0 | 0.00% | 0.00% | 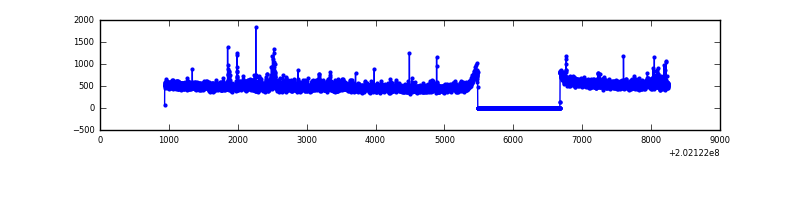 |
| C | 7312 | 6118 | 11 | 11 | 0.15% | 0.18% | 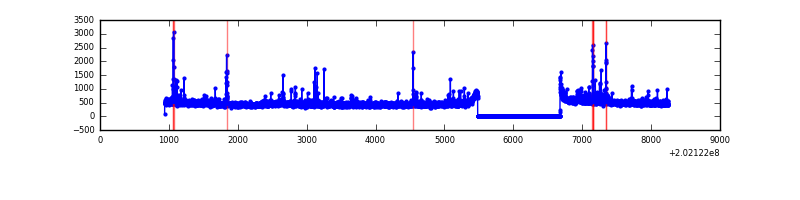 |
| D | 7312 | 6118 | 11 | 11 | 0.15% | 0.18% | 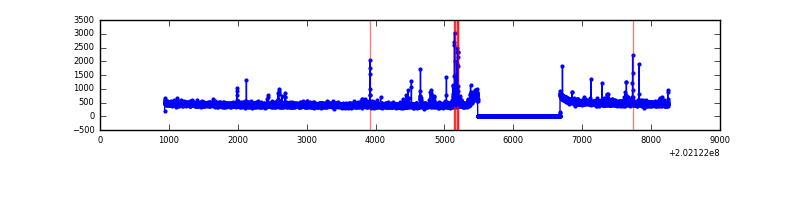 |
Top three noisy pixels from each quadrant. If the there are fewer than three noisy pixels in the level2.evt file, extra rows are filled as -1
| Pixel properties | Quadrant properties | ||||||
|---|---|---|---|---|---|---|---|
| Quadrant | DetID | PixID | Counts | Sigma | Mean | Median | Sigma |
| A | 0 | 50 | 76148 | 500.39 | 735 | 719 | 150.7 |
| A | 8 | 15 | 60585 | 397.14 | 735 | 719 | 150.7 |
| A | 8 | 4 | 24333 | 156.65 | 735 | 719 | 150.7 |
| B | 15 | 204 | 179516 | 1250.3 | 736 | 716 | 143.0 |
| B | 15 | 54 | 17954 | 120.54 | 736 | 716 | 143.0 |
| B | 0 | 219 | 16305 | 109.01 | 736 | 716 | 143.0 |
| C | 9 | 247 | 102492 | 625.22 | 704 | 708 | 162.8 |
| C | 2 | 53 | 98503 | 600.72 | 704 | 708 | 162.8 |
| C | 1 | 16 | 29819 | 178.82 | 704 | 708 | 162.8 |
| D | 13 | 223 | 71518 | 415.2 | 709 | 689 | 170.6 |
| D | 13 | 239 | 15120 | 84.59 | 709 | 689 | 170.6 |
| D | 2 | 206 | 12493 | 69.19 | 709 | 689 | 170.6 |
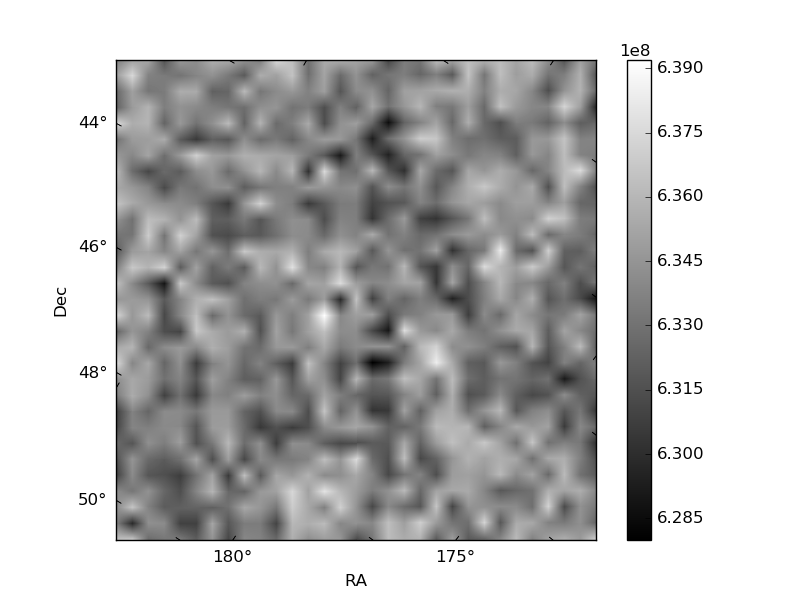
Histogram calculated using DETX and DETY for each event in the final _common_clean file
| Quadrant A |  |
 |
Quadrant B |
|---|---|---|---|
| Quadrant D |  |
 |
Quadrant C |
| Plot type | Count rate plots | Images |
|---|---|---|
| Comparison with Poisson distribution Blue bars denote a histogram of data divided into 1 sec bins. Red curve is a Poisson curve with rate = median count rate of data. |
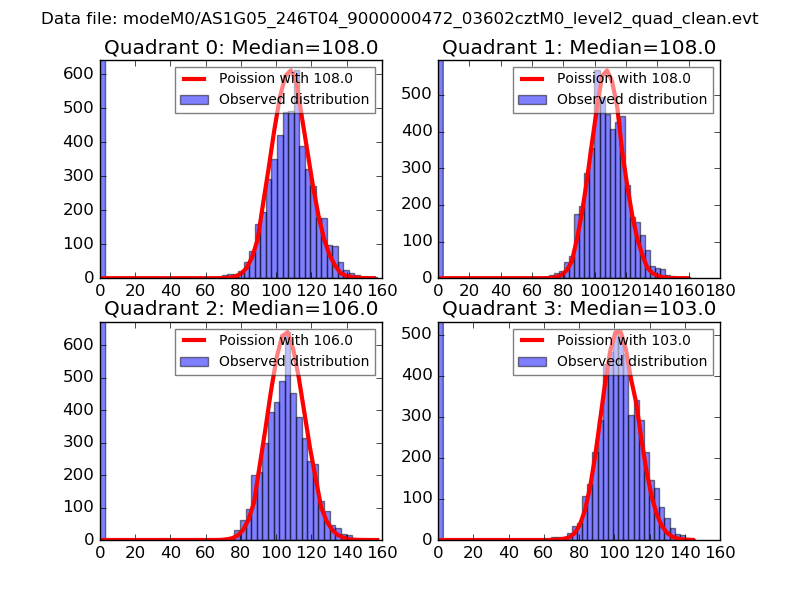 |
 |
| Quadrant-wise count rates Data is divided into 100 sec bins |
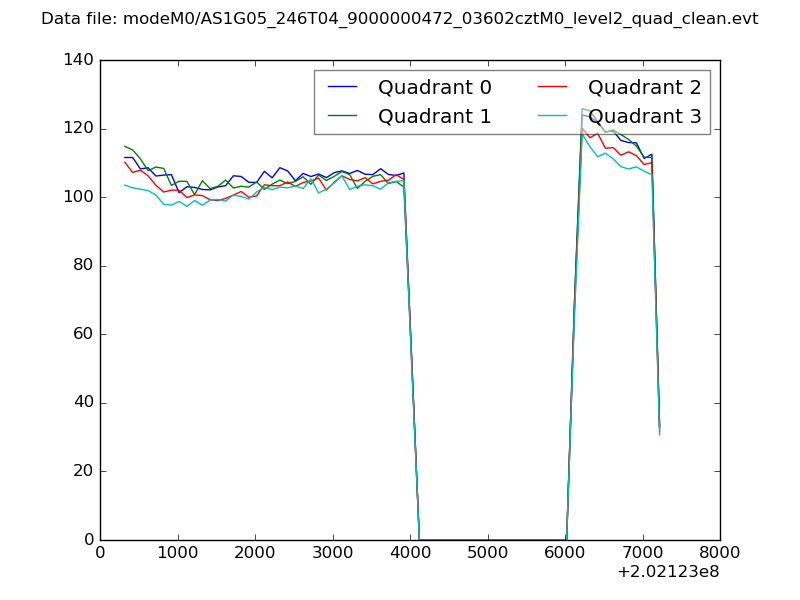 |
|
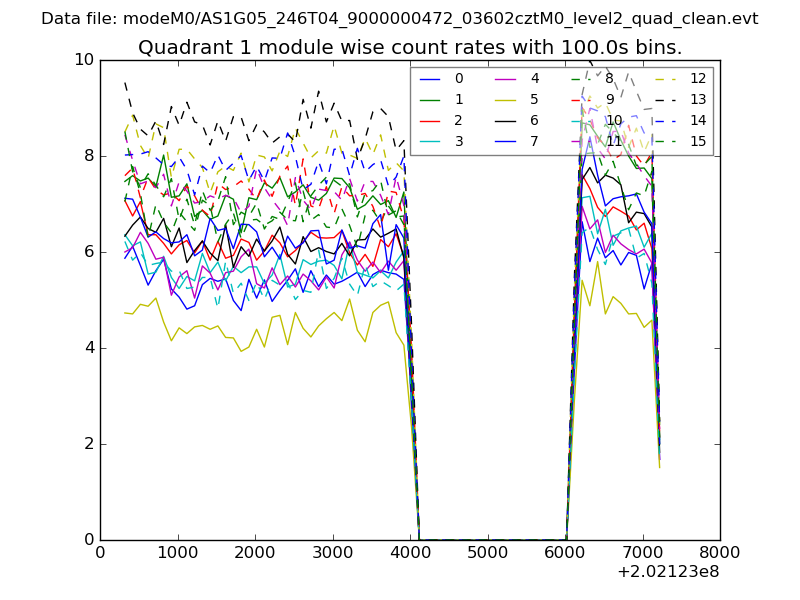
| Module-wise count rates for Quadrant A Data is divided into 100 sec bins |
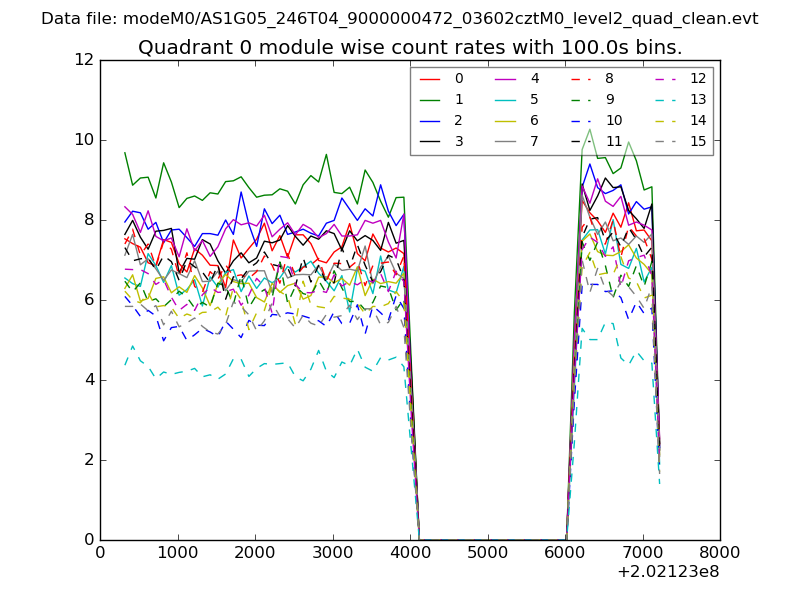 |
 |
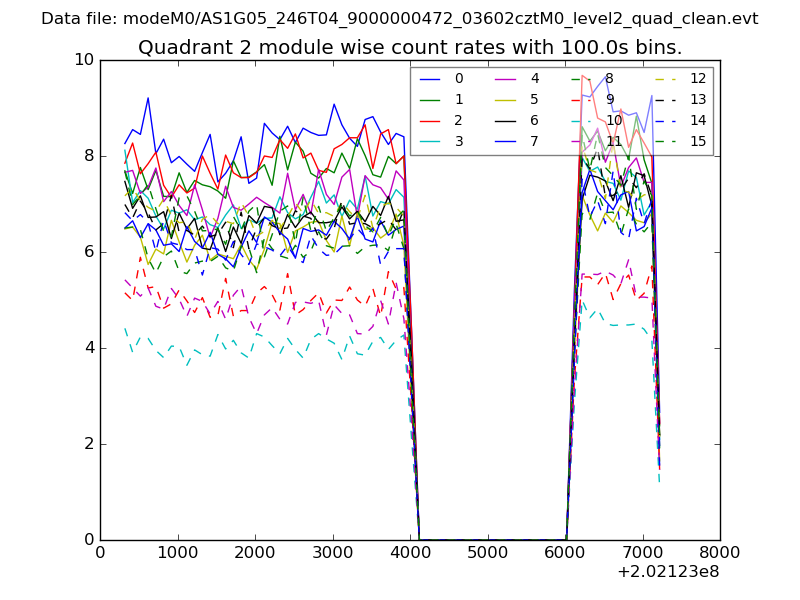
| Module-wise count rates for Quadrant B Data is divided into 100 sec bins |
 |
 |
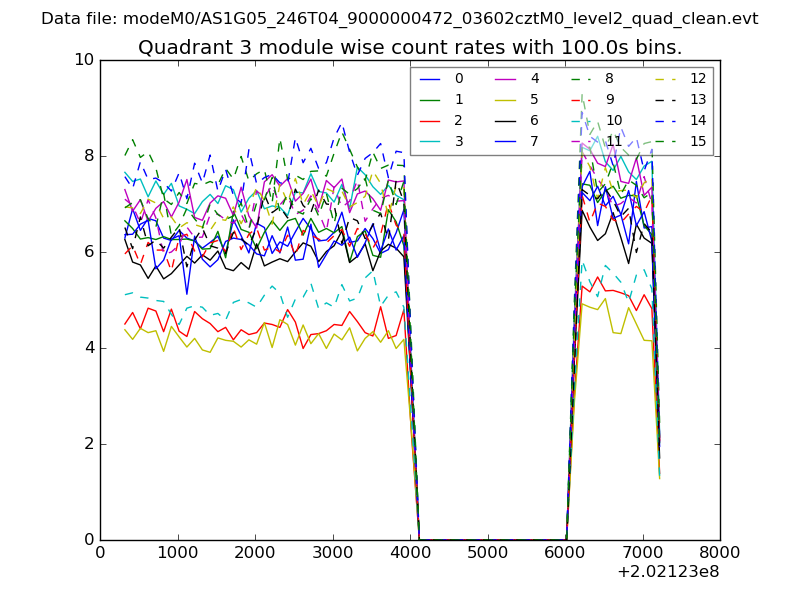
| Module-wise count rates for Quadrant C Data is divided into 100 sec bins |
 |
 |
| Module-wise count rates for Quadrant D Data is divided into 100 sec bins |
 |
 |
| Parameter | Plot |
|---|---|
| CZT HV Monitor | 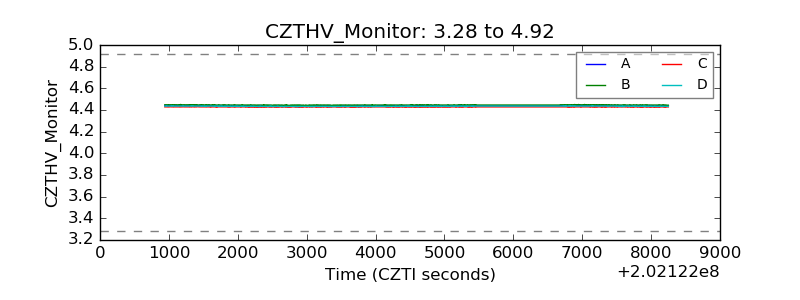 |
| D_VDD | 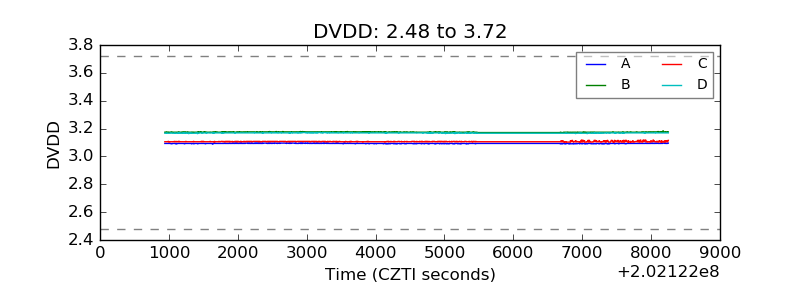 |
| Temperature 1 | 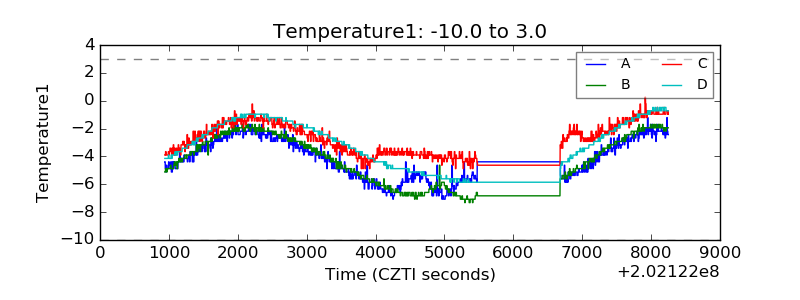 |
| Veto HV Monitor | 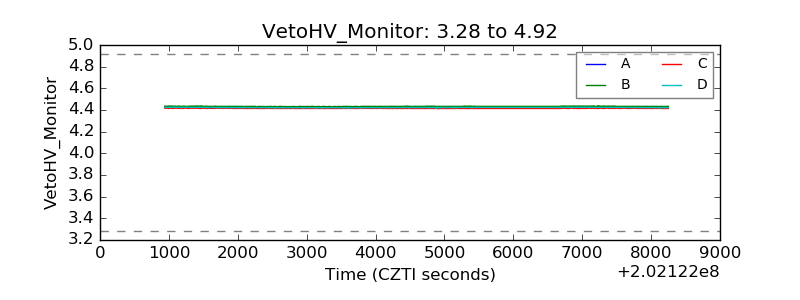 |
| Veto LLD | 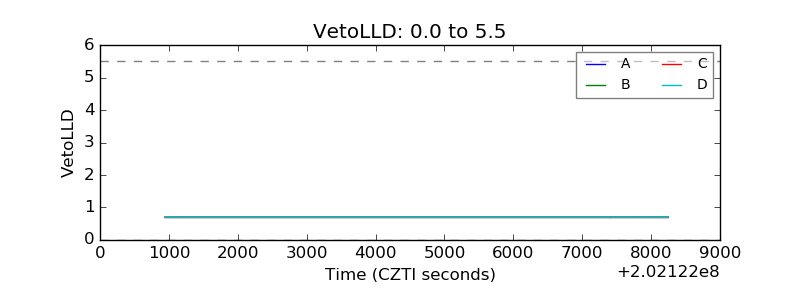 |
| Alpha Counter | 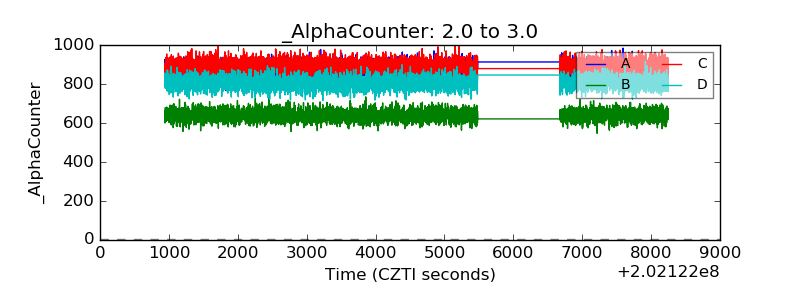 |
| _CPM_Rate | 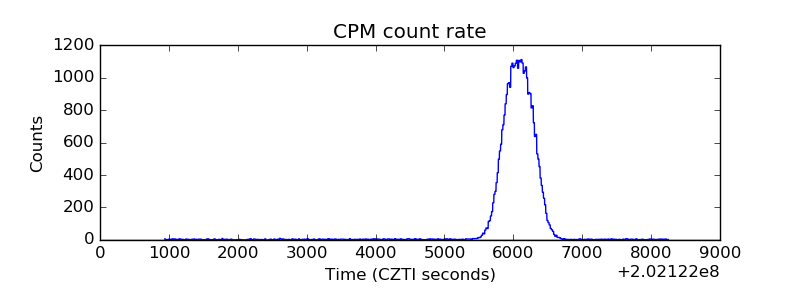 |
| CZT Counter |  |
| +2.5 Volts monitor |  |
| +5 Volts monitor |  |
| Veto Counter | 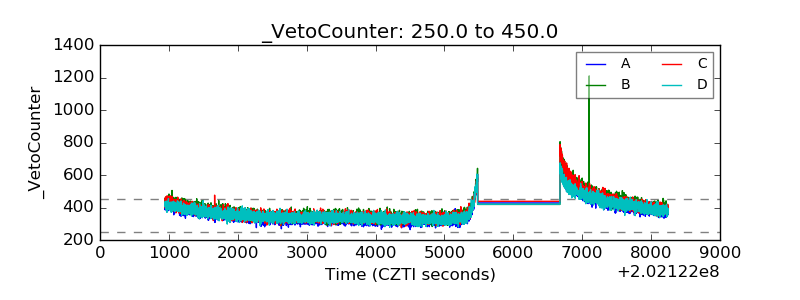 |