| Param | Original file | Final file |
|---|---|---|
| Filename | modeM0/AS1G05_246T04_9000000472_03603cztM0_level2.evt | modeM0/AS1G05_246T04_9000000472_03603cztM0_level2_quad_clean.evt |
| Size (bytes) | 412,228,800 | 88,274,880 |
| Size | 393.1 MB | 84.2 MB |
| Events in quadrant A | 2,873,228 | 577,673 |
| Events in quadrant B | 3,276,627 | 574,045 |
| Events in quadrant C | 3,117,892 | 559,064 |
| Events in quadrant D | 2,815,037 | 549,966 |
| Mode M0 | |||
|---|---|---|---|
| Quadrant | BADHDUFLAG | Total packets | Discarded packets |
| A | 0 | 12419 | 2 |
| B | 0 | 13484 | 1 |
| C | 0 | 13021 | 1 |
| D | 0 | 12476 | 1 |
| Mode SS | |||
|---|---|---|---|
| Quadrant | BADHDUFLAG | Total packets | Discarded packets |
| A | 0 | 120 | 0 |
| B | 0 | 120 | 0 |
| C | 0 | 120 | 0 |
| D | 0 | 120 | 0 |
| Mode M9 | |||
|---|---|---|---|
| Quadrant | BADHDUFLAG | Total packets | Discarded packets |
| A | 0 | 13 | 0 |
| B | 0 | 13 | 0 |
| C | 0 | 13 | 0 |
| D | 0 | 13 | 0 |
| Quadrant | Total seconds | Saturated seconds | Saturation percentage |
|---|---|---|---|
| A | 5905 | 92 | 1.558002% |
| B | 5905 | 87 | 1.473328% |
| C | 5905 | 137 | 2.320068% |
| D | 5905 | 85 | 1.439458% |
Noise dominated data is calculated using 1-second bins in cleaned event files. If a bin has >2000 counts, and if more than 50% of those come from <1% of pixels, then it is considered to be noise-dominated and hence unusable.
| Quadrant | # 1 sec bins | Bins with >0 counts | Bins with >2000 counts | High rate bins dominated by noise | Noise dominated (total time) | Noise dominated (detector-on time) | Marked lightcurve |
|---|---|---|---|---|---|---|---|
| A | 7140 | 5906 | 4 | 4 | 0.06% | 0.07% | 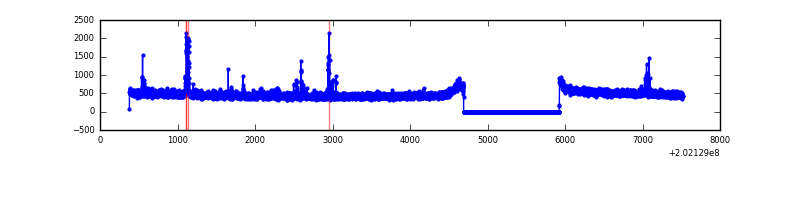 |
| B | 7140 | 5906 | 2 | 2 | 0.03% | 0.03% | 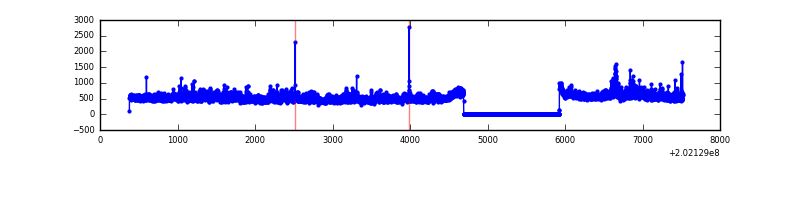 |
| C | 7140 | 5906 | 52 | 52 | 0.73% | 0.88% | 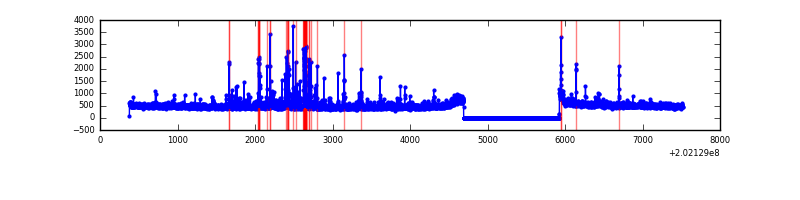 |
| D | 7140 | 5906 | 15 | 15 | 0.21% | 0.25% | 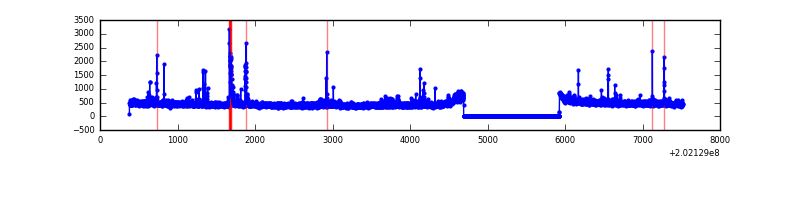 |
Top three noisy pixels from each quadrant. If the there are fewer than three noisy pixels in the level2.evt file, extra rows are filled as -1
| Pixel properties | Quadrant properties | ||||||
|---|---|---|---|---|---|---|---|
| Quadrant | DetID | PixID | Counts | Sigma | Mean | Median | Sigma |
| A | 0 | 50 | 72209 | 496.45 | 714 | 698 | 144.0 |
| A | 8 | 15 | 42706 | 291.63 | 714 | 698 | 144.0 |
| A | 12 | 194 | 7625 | 48.09 | 714 | 698 | 144.0 |
| B | 15 | 204 | 386116 | 2827.14 | 716 | 701 | 136.3 |
| B | 0 | 182 | 53975 | 390.78 | 716 | 701 | 136.3 |
| B | 15 | 54 | 15271 | 106.88 | 716 | 701 | 136.3 |
| C | 9 | 247 | 250704 | 1569.58 | 689 | 693 | 159.3 |
| C | 2 | 53 | 118051 | 736.78 | 689 | 693 | 159.3 |
| C | 1 | 16 | 22849 | 139.1 | 689 | 693 | 159.3 |
| D | 13 | 46 | 96034 | 569.74 | 696 | 672 | 167.4 |
| D | 13 | 223 | 43554 | 256.2 | 696 | 672 | 167.4 |
| D | 2 | 206 | 19467 | 112.29 | 696 | 672 | 167.4 |
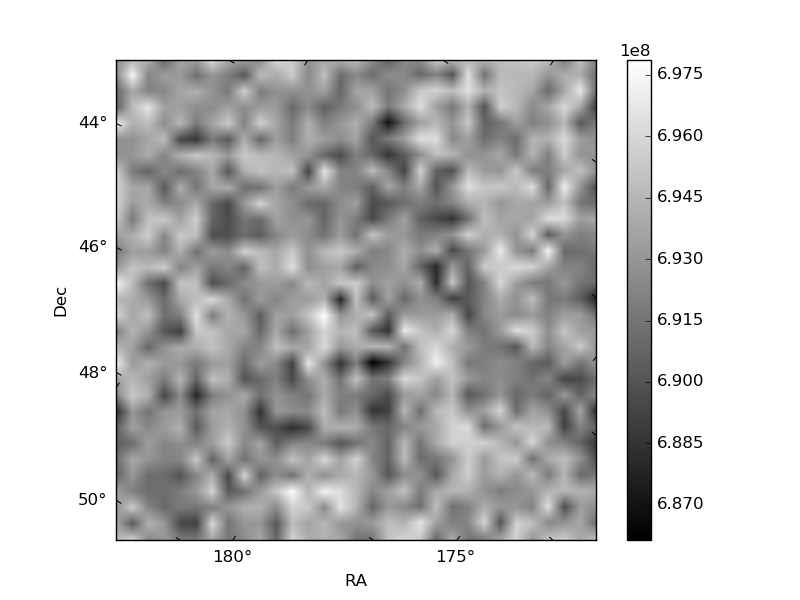
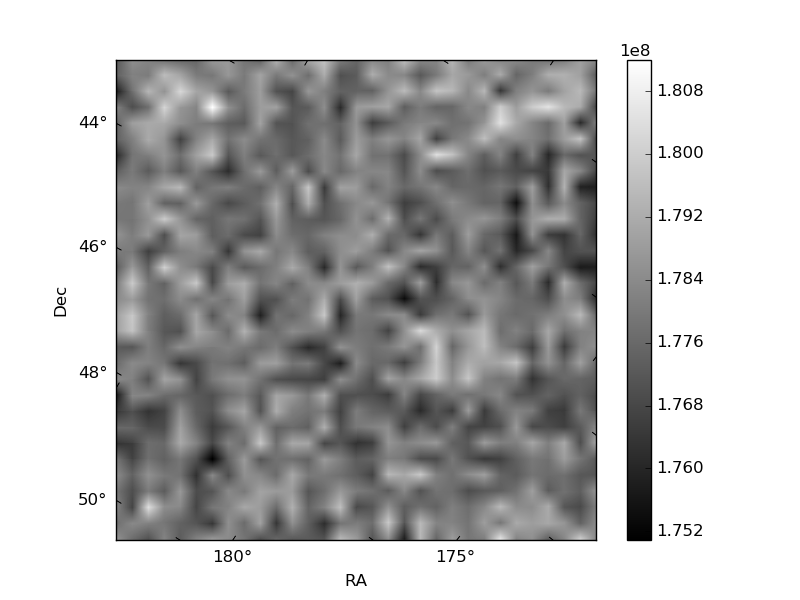
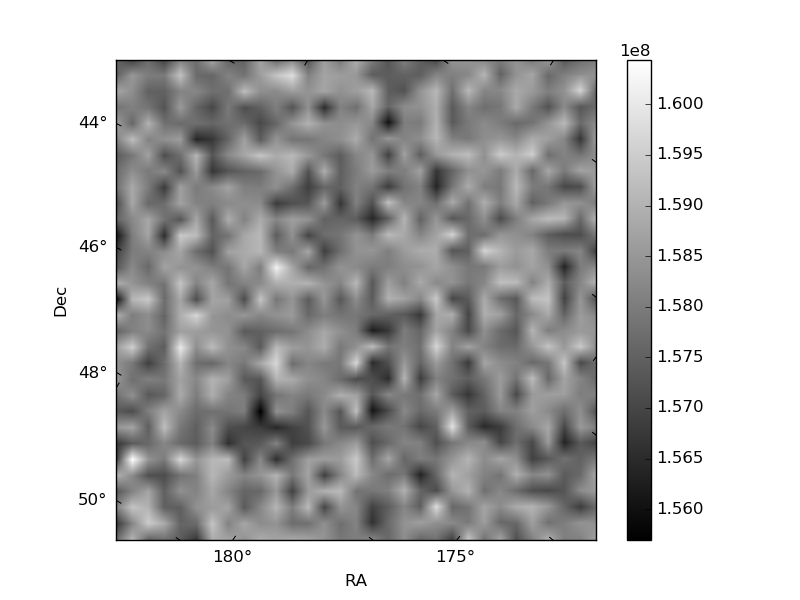
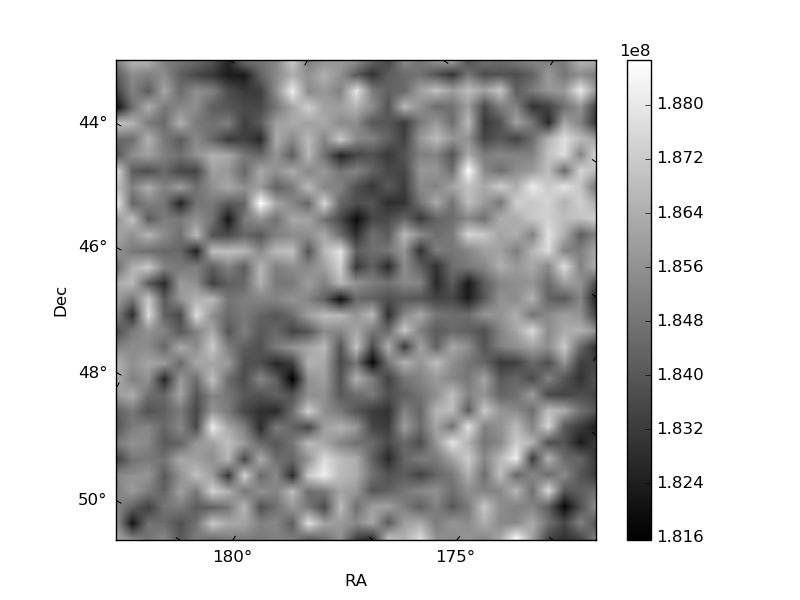
Histogram calculated using DETX and DETY for each event in the final _common_clean file
| Quadrant A | 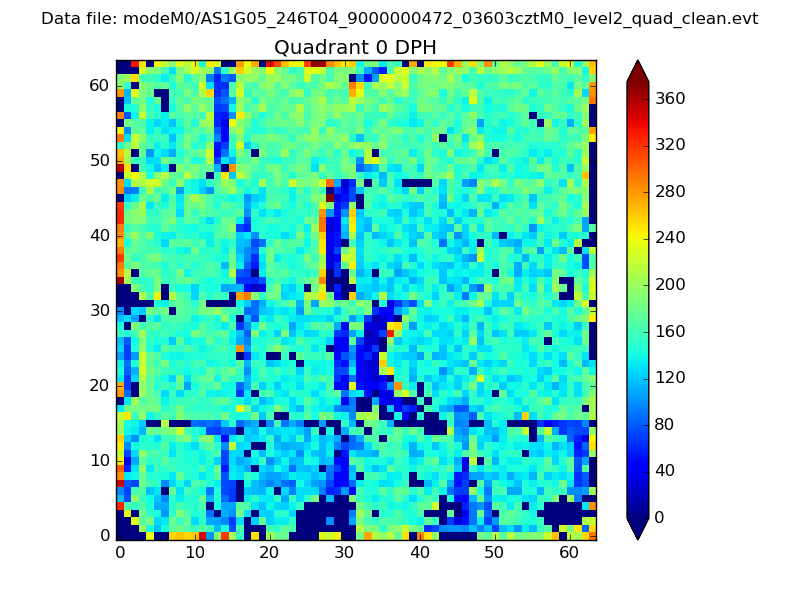 |
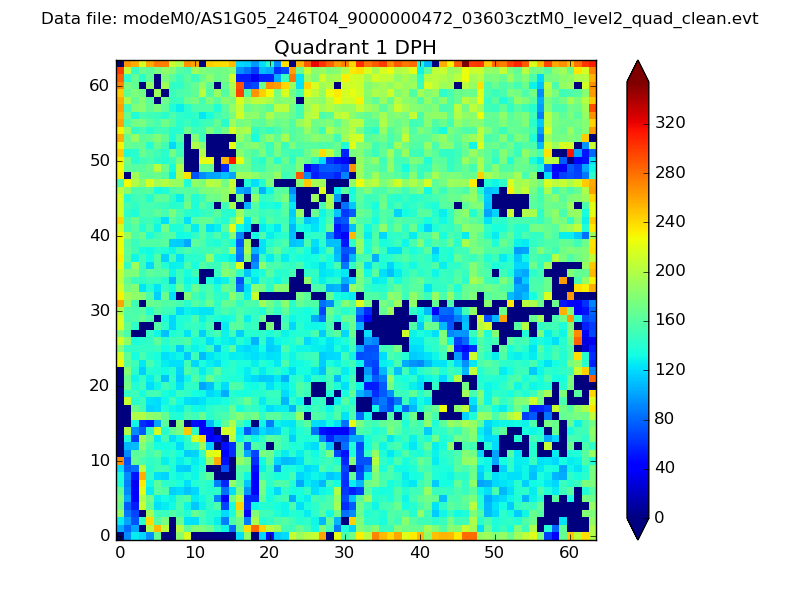 |
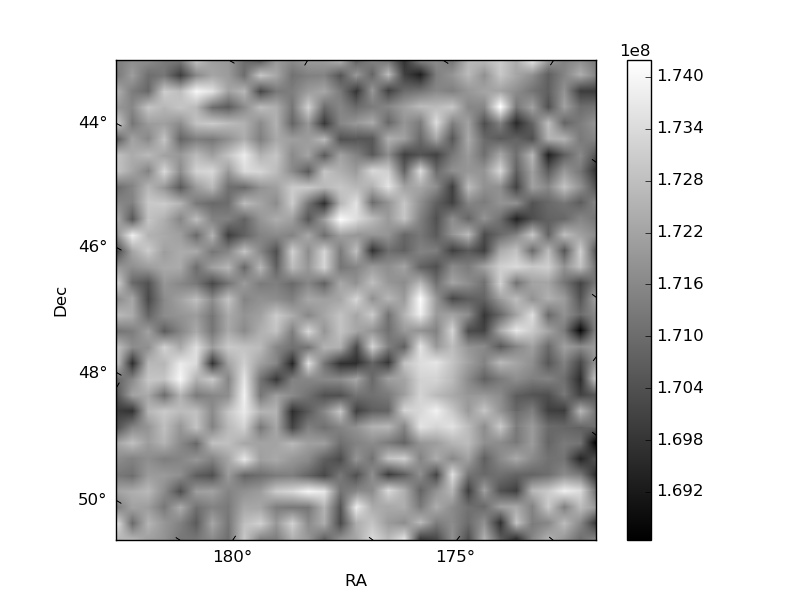
Quadrant B |
|---|---|---|---|
| Quadrant D | 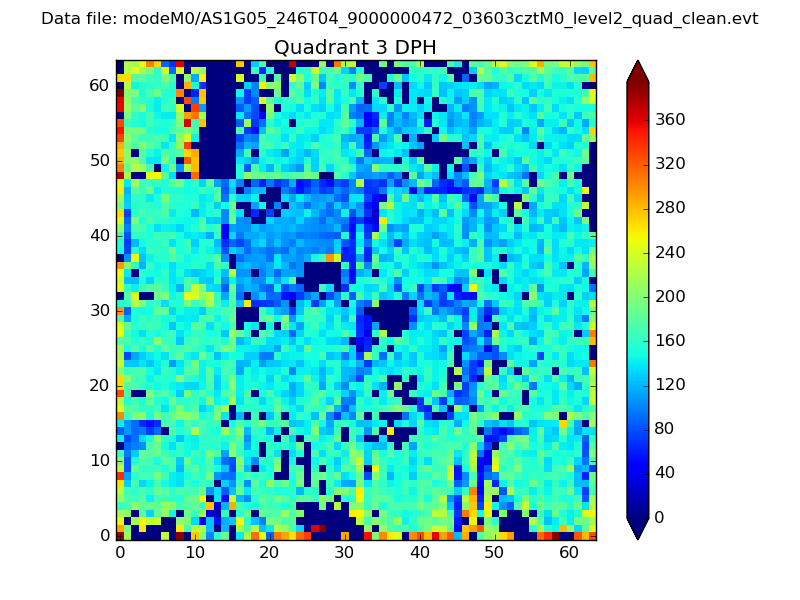 |
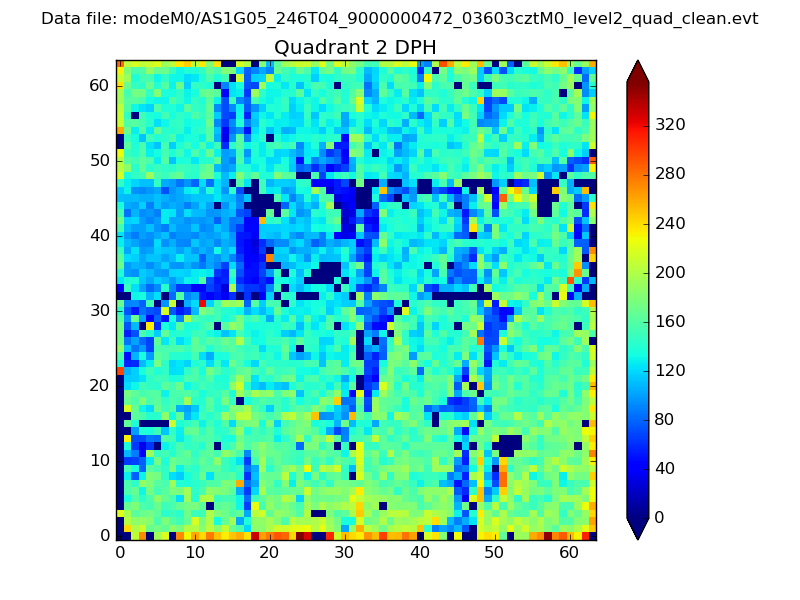 |
Quadrant C |
| Plot type | Count rate plots | Images |
|---|---|---|
| Comparison with Poisson distribution Blue bars denote a histogram of data divided into 1 sec bins. Red curve is a Poisson curve with rate = median count rate of data. |
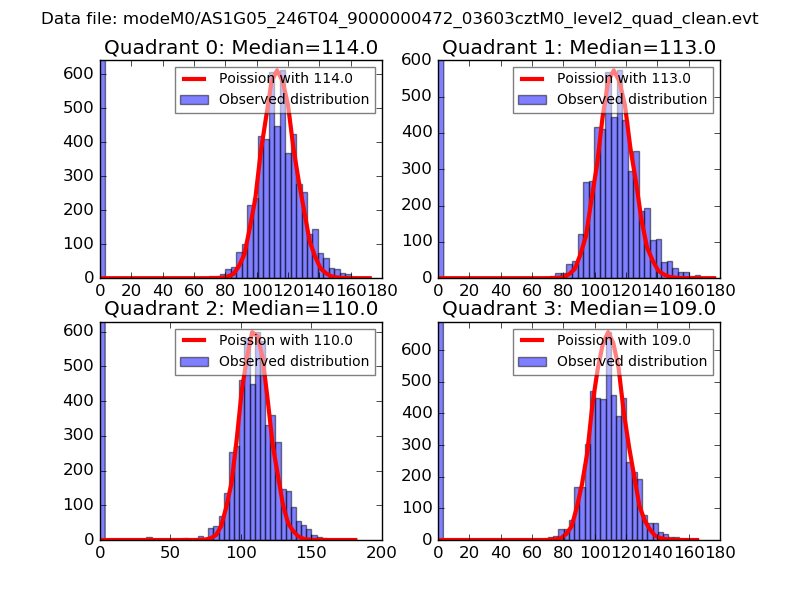 |
 |
| Quadrant-wise count rates Data is divided into 100 sec bins |
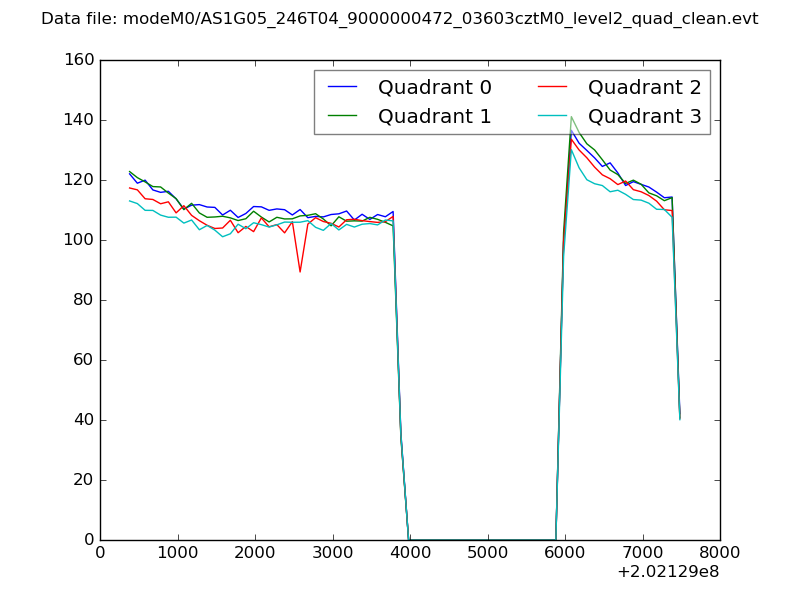 |
|
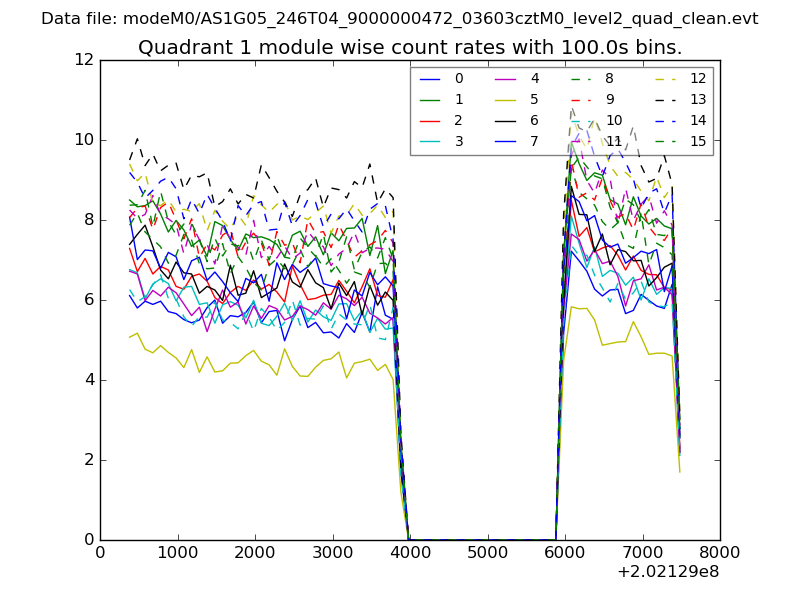
| Module-wise count rates for Quadrant A Data is divided into 100 sec bins |
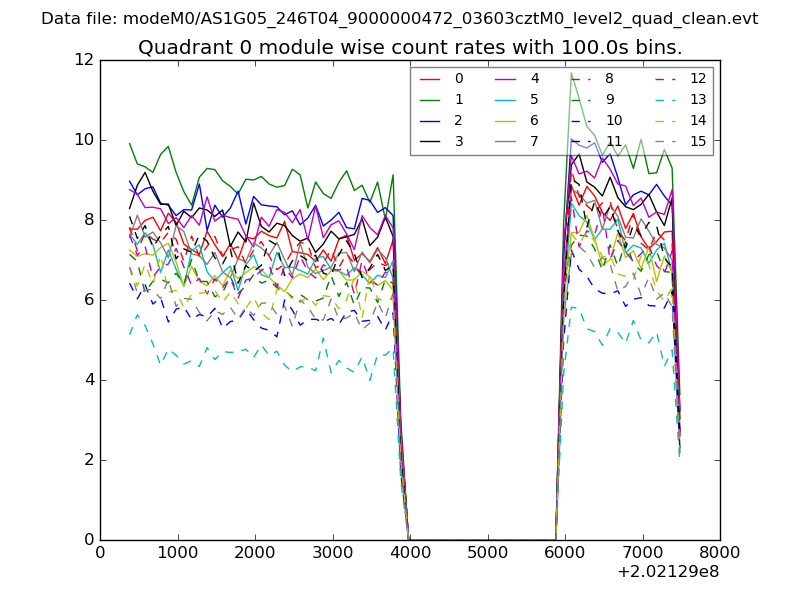 |
 |
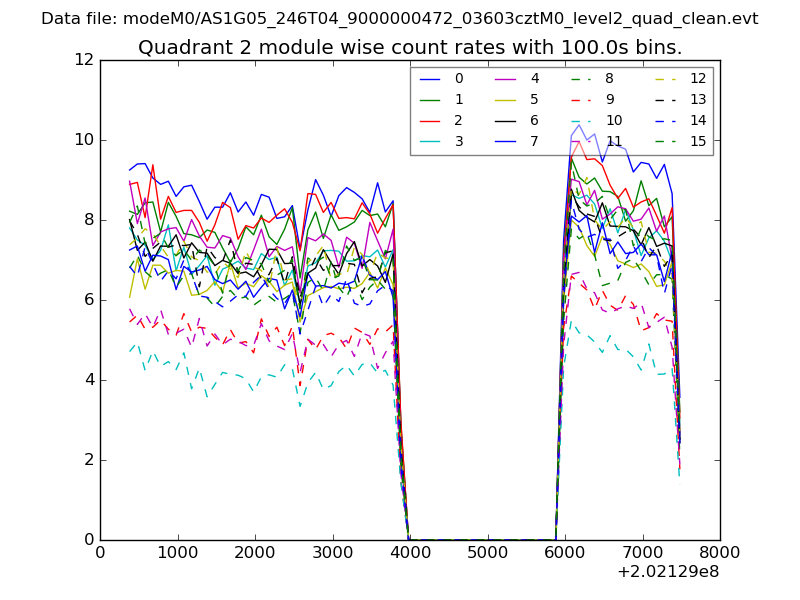
| Module-wise count rates for Quadrant B Data is divided into 100 sec bins |
 |
 |
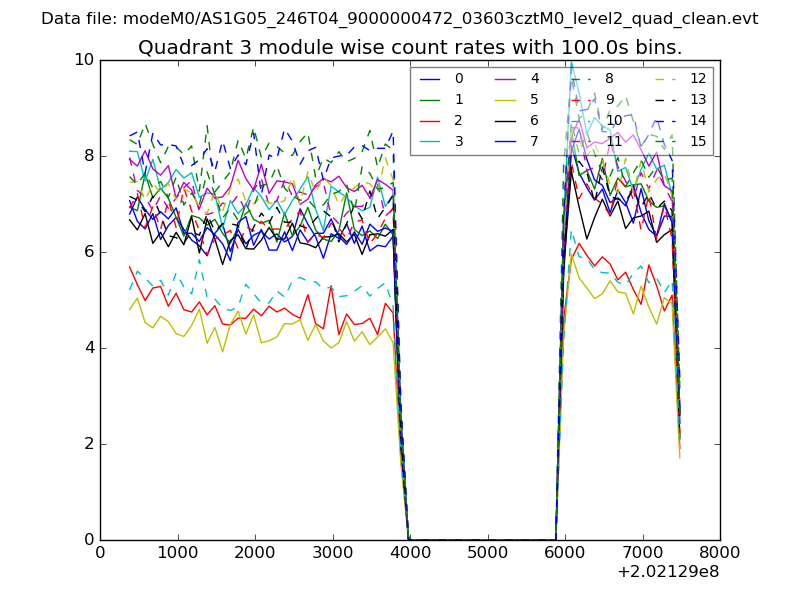
| Module-wise count rates for Quadrant C Data is divided into 100 sec bins |
 |
 |
| Module-wise count rates for Quadrant D Data is divided into 100 sec bins |
 |
 |
| Parameter | Plot |
|---|---|
| CZT HV Monitor | 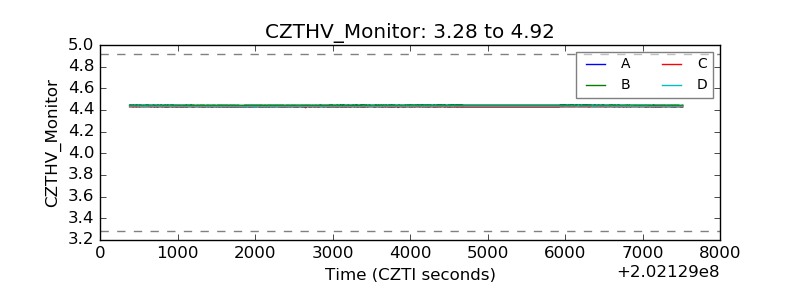 |
| D_VDD | 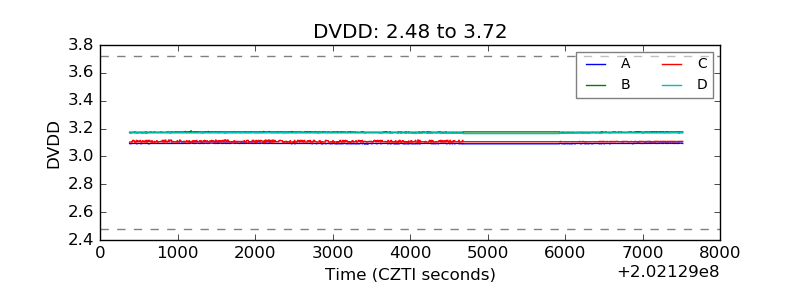 |
| Temperature 1 | 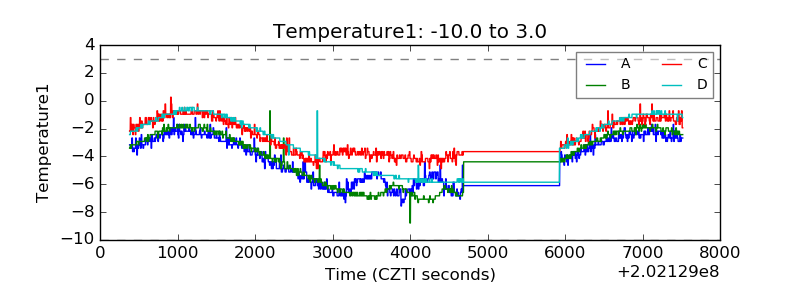 |
| Veto HV Monitor | 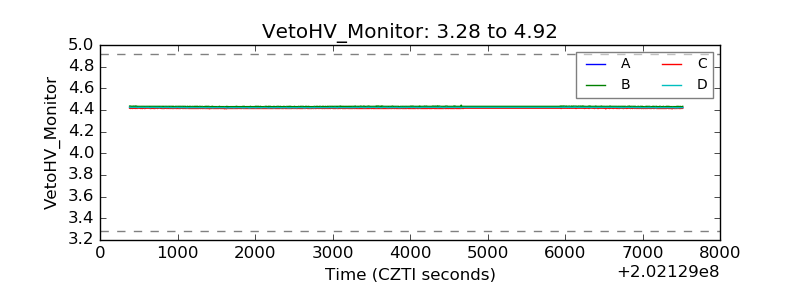 |
| Veto LLD | 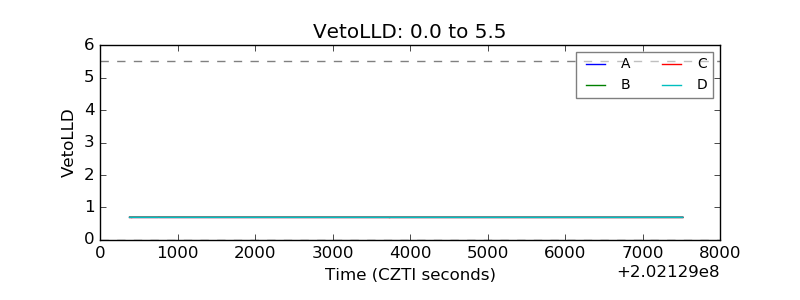 |
| Alpha Counter | 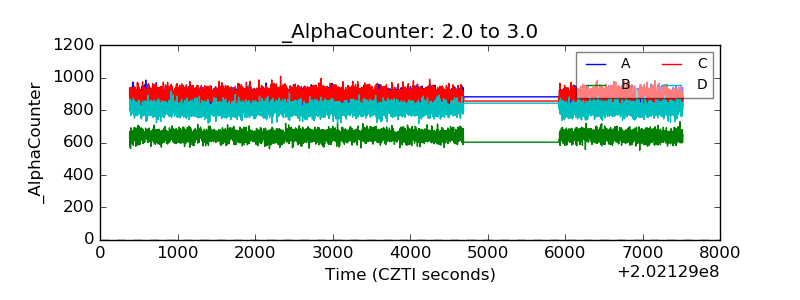 |
| _CPM_Rate | 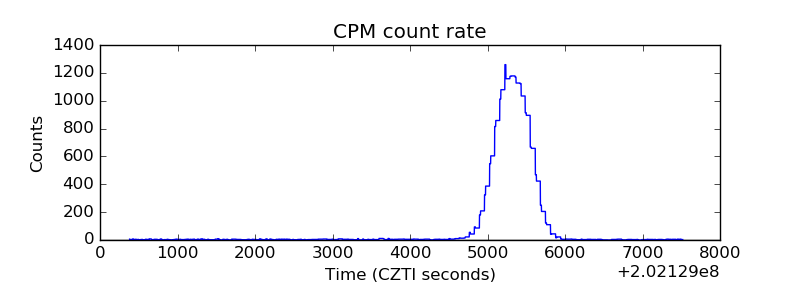 |
| CZT Counter | 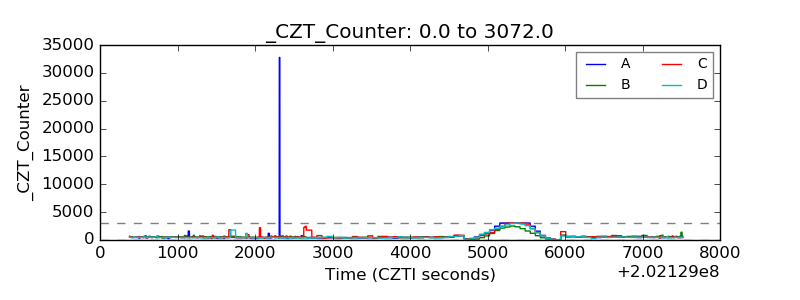 |
| +2.5 Volts monitor |  |
| +5 Volts monitor |  |
| Veto Counter | 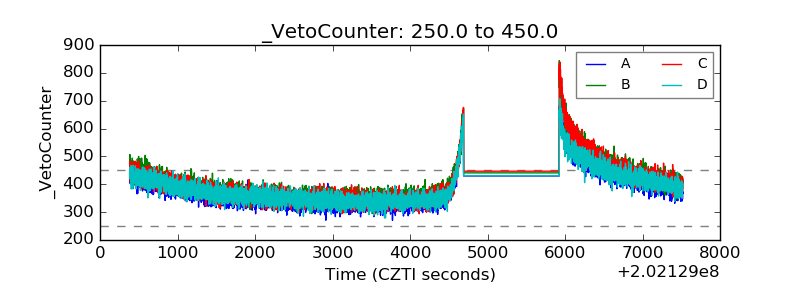 |