| Param | Original file | Final file |
|---|---|---|
| Filename | modeM0/AS1G05_246T04_9000000472_03604cztM0_level2.evt | modeM0/AS1G05_246T04_9000000472_03604cztM0_level2_quad_clean.evt |
| Size (bytes) | 408,755,520 | 84,404,160 |
| Size | 389.8 MB | 80.5 MB |
| Events in quadrant A | 2,803,346 | 544,869 |
| Events in quadrant B | 3,499,163 | 541,188 |
| Events in quadrant C | 2,888,144 | 533,777 |
| Events in quadrant D | 2,785,960 | 522,568 |
| Mode M0 | |||
|---|---|---|---|
| Quadrant | BADHDUFLAG | Total packets | Discarded packets |
| A | 0 | 12300 | 2 |
| B | 0 | 14427 | 1 |
| C | 0 | 12453 | 1 |
| D | 0 | 12486 | 1 |
| Mode SS | |||
|---|---|---|---|
| Quadrant | BADHDUFLAG | Total packets | Discarded packets |
| A | 0 | 122 | 0 |
| B | 0 | 122 | 0 |
| C | 0 | 122 | 0 |
| D | 0 | 122 | 0 |
| Mode M9 | |||
|---|---|---|---|
| Quadrant | BADHDUFLAG | Total packets | Discarded packets |
| A | 0 | 12 | 0 |
| B | 0 | 12 | 0 |
| C | 0 | 12 | 0 |
| D | 0 | 12 | 0 |
| Quadrant | Total seconds | Saturated seconds | Saturation percentage |
|---|---|---|---|
| A | 5913 | 86 | 1.454422% |
| B | 5913 | 87 | 1.471334% |
| C | 5913 | 91 | 1.538982% |
| D | 5913 | 86 | 1.454422% |
Noise dominated data is calculated using 1-second bins in cleaned event files. If a bin has >2000 counts, and if more than 50% of those come from <1% of pixels, then it is considered to be noise-dominated and hence unusable.
| Quadrant | # 1 sec bins | Bins with >0 counts | Bins with >2000 counts | High rate bins dominated by noise | Noise dominated (total time) | Noise dominated (detector-on time) | Marked lightcurve |
|---|---|---|---|---|---|---|---|
| A | 7178 | 5914 | 5 | 5 | 0.07% | 0.08% |  |
| B | 7178 | 5914 | 11 | 11 | 0.15% | 0.19% |  |
| C | 7178 | 5914 | 8 | 8 | 0.11% | 0.14% | 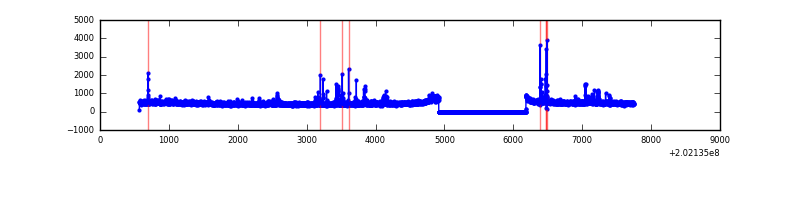 |
| D | 7178 | 5914 | 8 | 8 | 0.11% | 0.14% |  |
Top three noisy pixels from each quadrant. If the there are fewer than three noisy pixels in the level2.evt file, extra rows are filled as -1
| Pixel properties | Quadrant properties | ||||||
|---|---|---|---|---|---|---|---|
| Quadrant | DetID | PixID | Counts | Sigma | Mean | Median | Sigma |
| A | 0 | 50 | 34767 | 234.72 | 709 | 694 | 145.2 |
| A | 13 | 164 | 14414 | 94.51 | 709 | 694 | 145.2 |
| A | 8 | 15 | 12832 | 83.61 | 709 | 694 | 145.2 |
| B | 15 | 204 | 567816 | 4207.88 | 712 | 693 | 134.8 |
| B | 0 | 182 | 56318 | 412.72 | 712 | 693 | 134.8 |
| B | 4 | 200 | 49037 | 358.7 | 712 | 693 | 134.8 |
| C | 9 | 247 | 99613 | 618.6 | 690 | 695 | 159.9 |
| C | 2 | 53 | 79354 | 491.91 | 690 | 695 | 159.9 |
| C | 13 | 61 | 5813 | 32.01 | 690 | 695 | 159.9 |
| D | 13 | 223 | 55208 | 331.43 | 693 | 674 | 164.5 |
| D | 10 | 172 | 33319 | 198.4 | 693 | 674 | 164.5 |
| D | 13 | 239 | 28173 | 167.12 | 693 | 674 | 164.5 |
Histogram calculated using DETX and DETY for each event in the final _common_clean file
| Quadrant A | 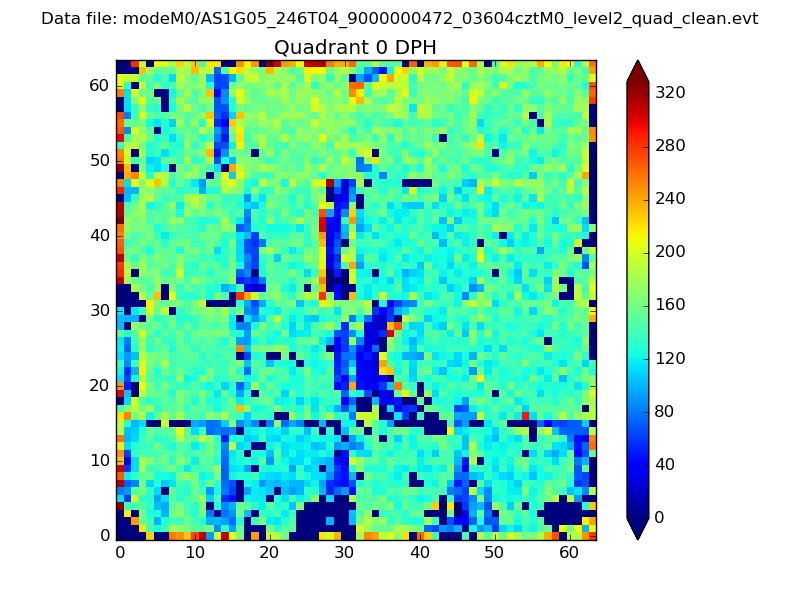 |
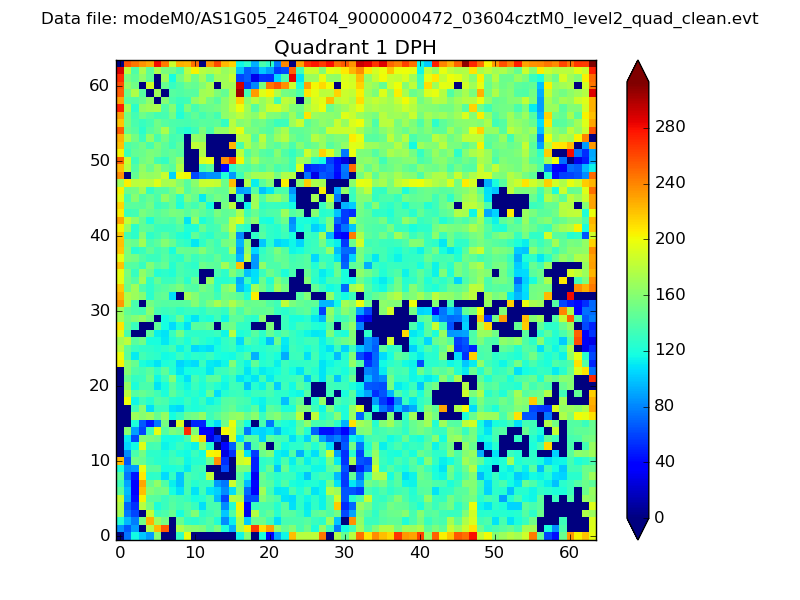 |
Quadrant B |
|---|---|---|---|
| Quadrant D | 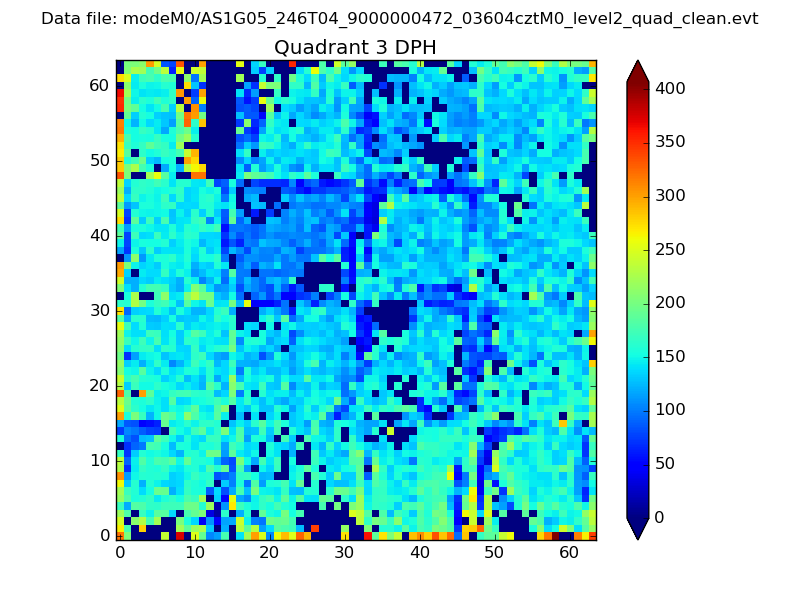 |
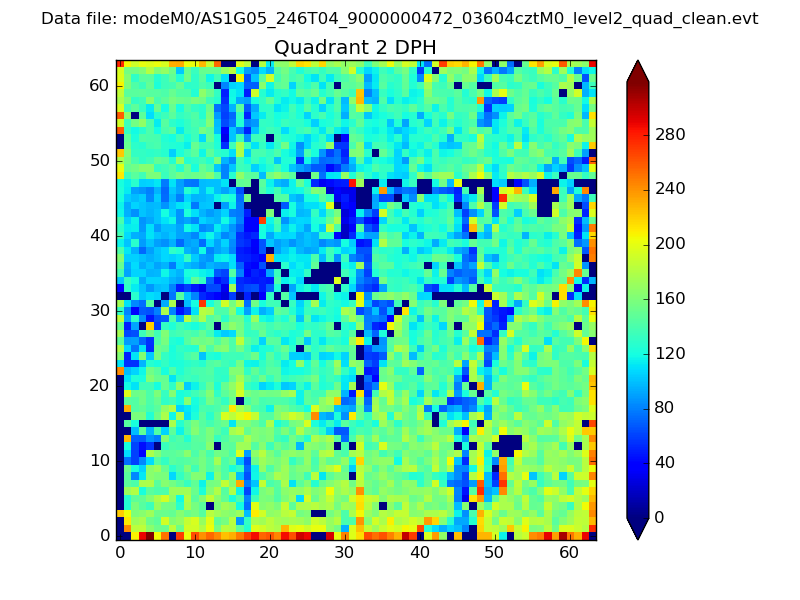 |
Quadrant C |
| Plot type | Count rate plots | Images |
|---|---|---|
| Comparison with Poisson distribution Blue bars denote a histogram of data divided into 1 sec bins. Red curve is a Poisson curve with rate = median count rate of data. |
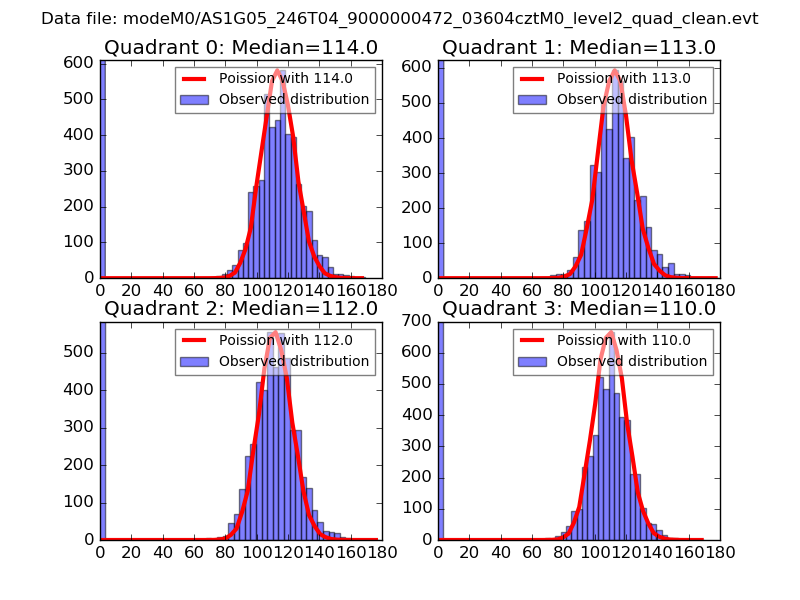 |
 |
| Quadrant-wise count rates Data is divided into 100 sec bins |
 |
|
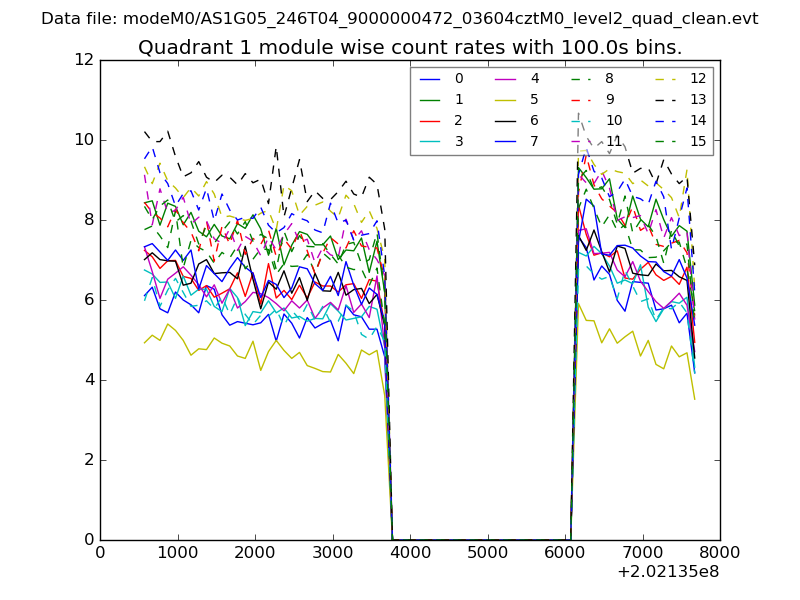
| Module-wise count rates for Quadrant A Data is divided into 100 sec bins |
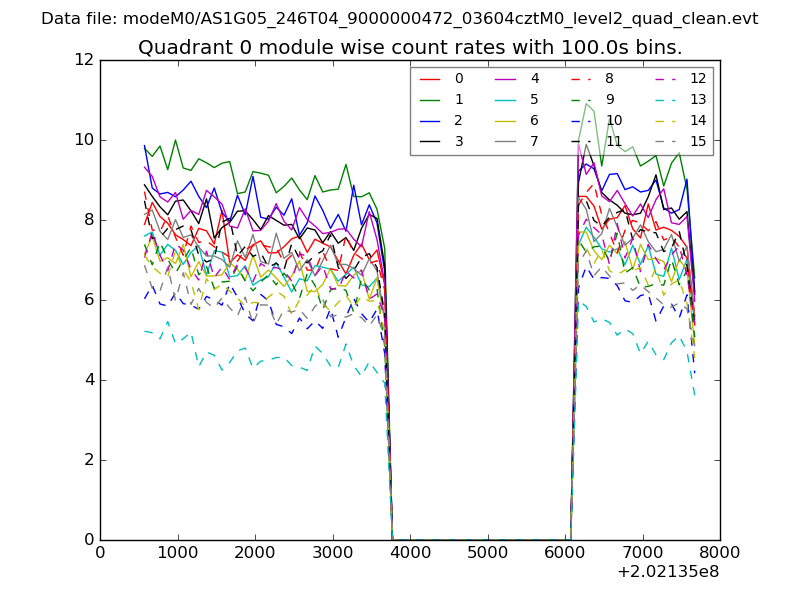 |
 |
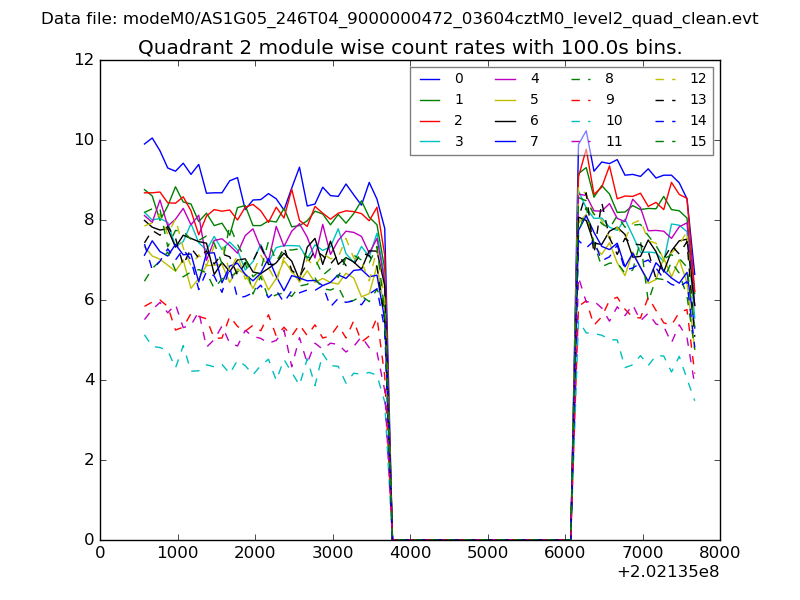
| Module-wise count rates for Quadrant B Data is divided into 100 sec bins |
 |
 |
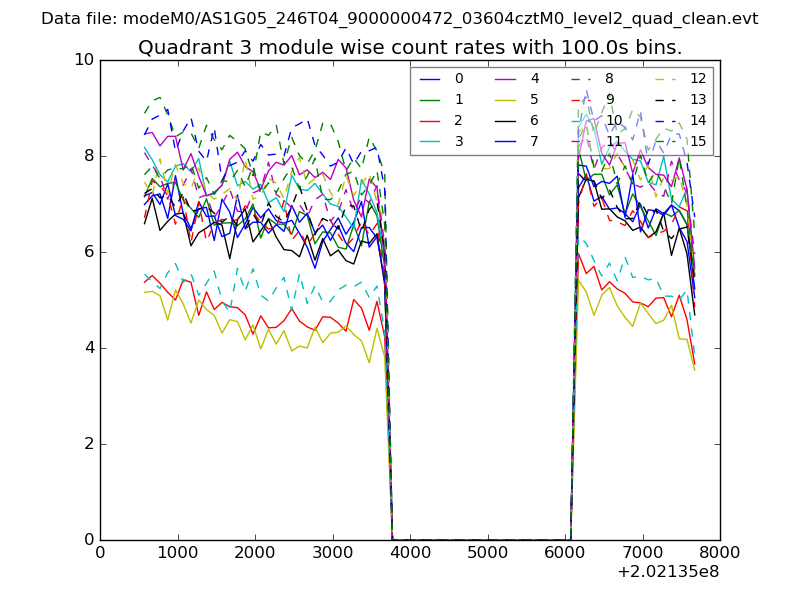
| Module-wise count rates for Quadrant C Data is divided into 100 sec bins |
 |
 |
| Module-wise count rates for Quadrant D Data is divided into 100 sec bins |
 |
 |
| Parameter | Plot |
|---|---|
| CZT HV Monitor |  |
| D_VDD | 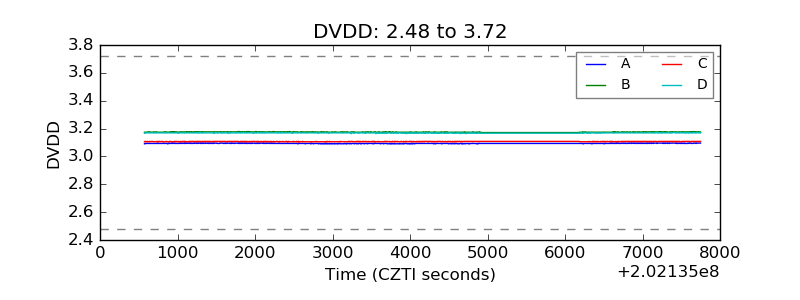 |
| Temperature 1 | 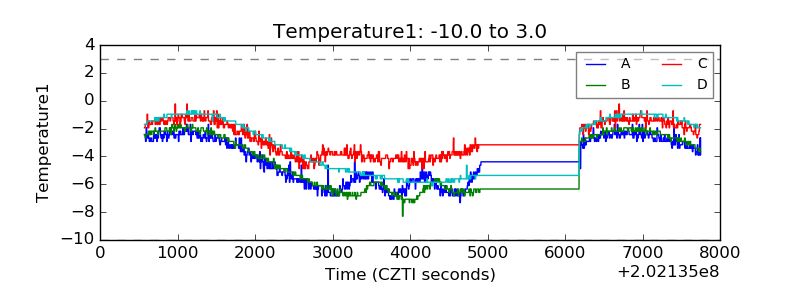 |
| Veto HV Monitor | 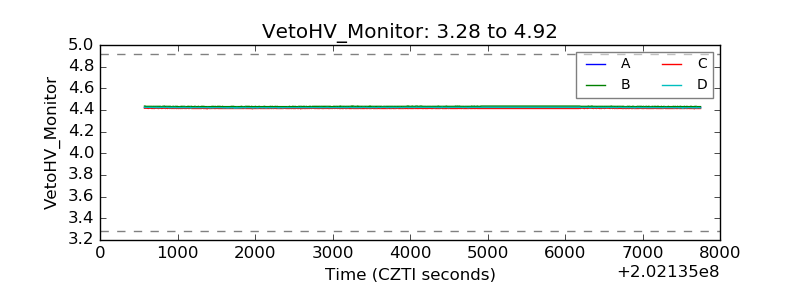 |
| Veto LLD | 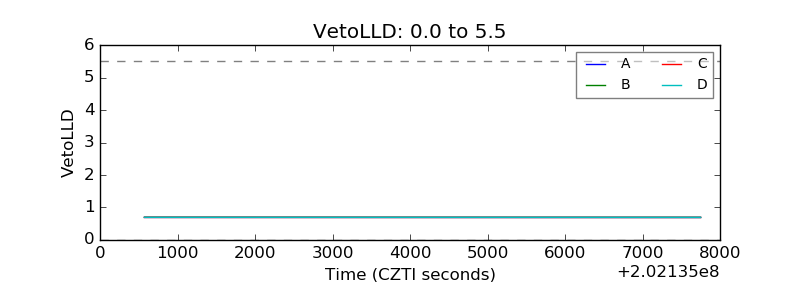 |
| Alpha Counter | 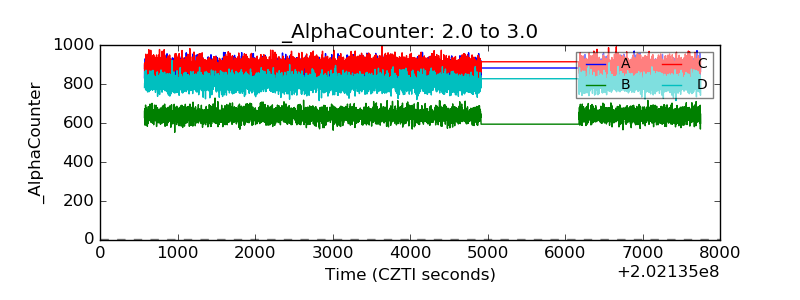 |
| _CPM_Rate | 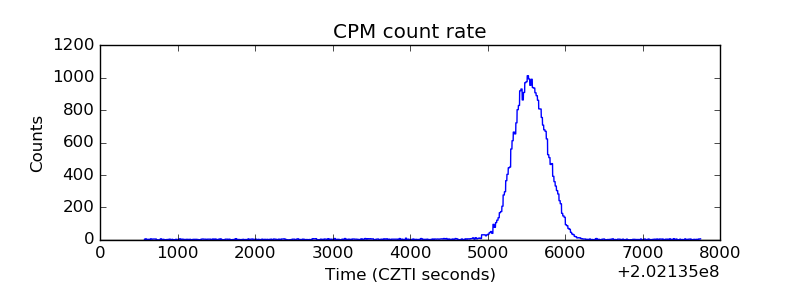 |
| CZT Counter | 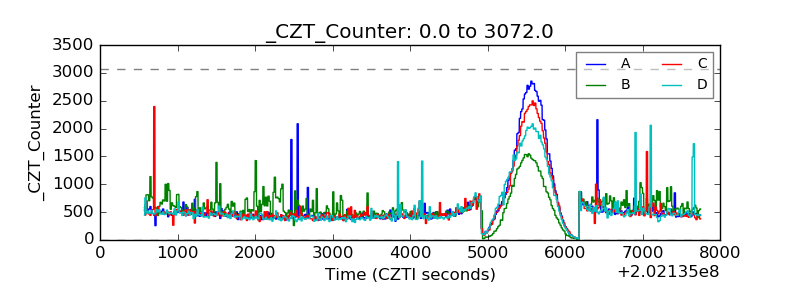 |
| +2.5 Volts monitor |  |
| +5 Volts monitor | 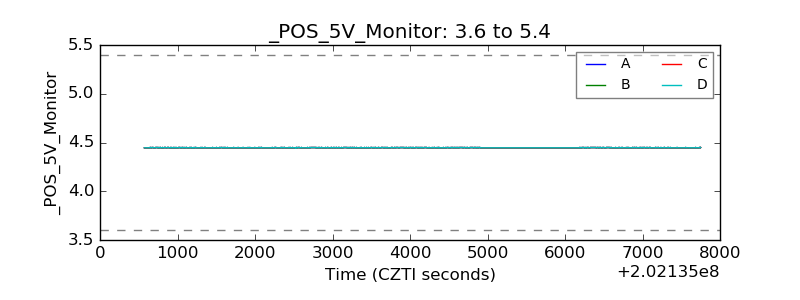 |
| Veto Counter | 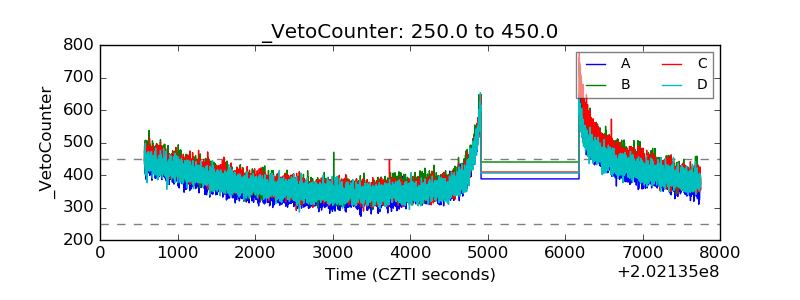 |