| Param | Original file | Final file |
|---|---|---|
| Filename | modeM0/AS1G05_246T04_9000000472_03605cztM0_level2.evt | modeM0/AS1G05_246T04_9000000472_03605cztM0_level2_quad_clean.evt |
| Size (bytes) | 406,848,960 | 76,688,640 |
| Size | 388.0 MB | 73.1 MB |
| Events in quadrant A | 2,692,996 | 485,146 |
| Events in quadrant B | 3,354,927 | 478,580 |
| Events in quadrant C | 2,947,482 | 477,401 |
| Events in quadrant D | 2,920,801 | 464,923 |
| Mode M0 | |||
|---|---|---|---|
| Quadrant | BADHDUFLAG | Total packets | Discarded packets |
| A | 0 | 12169 | 2 |
| B | 0 | 14023 | 1 |
| C | 0 | 12807 | 1 |
| D | 0 | 12953 | 1 |
| Mode SS | |||
|---|---|---|---|
| Quadrant | BADHDUFLAG | Total packets | Discarded packets |
| A | 0 | 122 | 0 |
| B | 0 | 122 | 0 |
| C | 0 | 122 | 0 |
| D | 0 | 122 | 0 |
| Mode M9 | |||
|---|---|---|---|
| Quadrant | BADHDUFLAG | Total packets | Discarded packets |
| A | 0 | 13 | 0 |
| B | 0 | 13 | 0 |
| C | 0 | 13 | 0 |
| D | 0 | 13 | 0 |
| Quadrant | Total seconds | Saturated seconds | Saturation percentage |
|---|---|---|---|
| A | 5961 | 52 | 0.872337% |
| B | 5961 | 41 | 0.687804% |
| C | 5961 | 60 | 1.006543% |
| D | 5961 | 104 | 1.744674% |
Noise dominated data is calculated using 1-second bins in cleaned event files. If a bin has >2000 counts, and if more than 50% of those come from <1% of pixels, then it is considered to be noise-dominated and hence unusable.
| Quadrant | # 1 sec bins | Bins with >0 counts | Bins with >2000 counts | High rate bins dominated by noise | Noise dominated (total time) | Noise dominated (detector-on time) | Marked lightcurve |
|---|---|---|---|---|---|---|---|
| A | 7221 | 5963 | 0 | 0 | 0.00% | 0.00% | 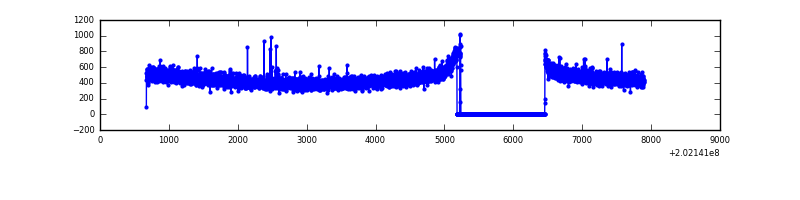 |
| B | 7221 | 5963 | 0 | 0 | 0.00% | 0.00% | 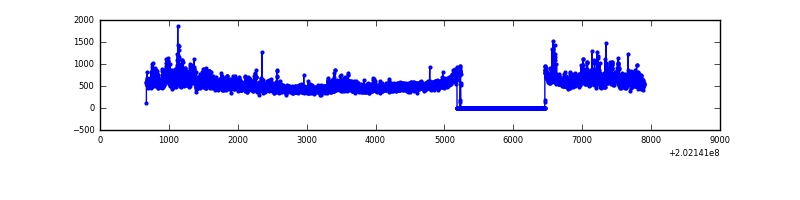 |
| C | 7221 | 5963 | 22 | 22 | 0.30% | 0.37% | 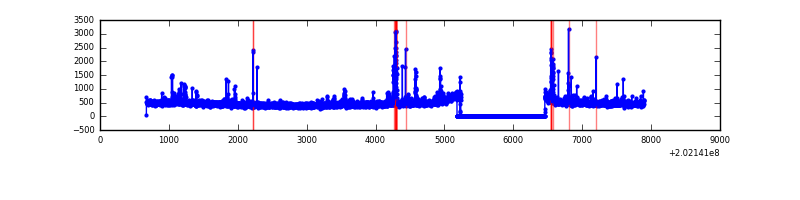 |
| D | 7221 | 5963 | 46 | 46 | 0.64% | 0.77% | 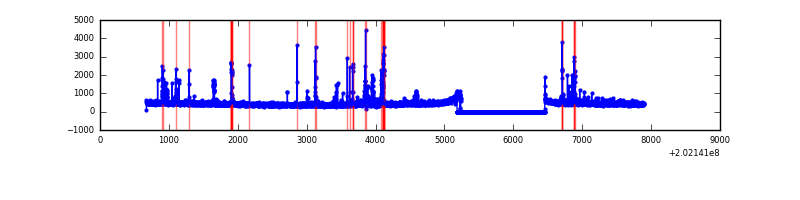 |
Top three noisy pixels from each quadrant. If the there are fewer than three noisy pixels in the level2.evt file, extra rows are filled as -1
| Pixel properties | Quadrant properties | ||||||
|---|---|---|---|---|---|---|---|
| Quadrant | DetID | PixID | Counts | Sigma | Mean | Median | Sigma |
| A | 0 | 226 | 7380 | 47.39 | 694 | 679 | 141.4 |
| A | 12 | 194 | 7346 | 47.15 | 694 | 679 | 141.4 |
| A | 3 | 1 | 4840 | 29.43 | 694 | 679 | 141.4 |
| B | 15 | 204 | 509279 | 3815.41 | 700 | 682 | 133.3 |
| B | 0 | 182 | 74529 | 553.99 | 700 | 682 | 133.3 |
| B | 7 | 252 | 14798 | 105.9 | 700 | 682 | 133.3 |
| C | 9 | 247 | 123374 | 772.15 | 680 | 683 | 158.9 |
| C | 1 | 16 | 97650 | 610.26 | 680 | 683 | 158.9 |
| C | 2 | 53 | 62395 | 388.38 | 680 | 683 | 158.9 |
| D | 13 | 223 | 159134 | 972.94 | 678 | 657 | 162.9 |
| D | 13 | 239 | 52594 | 318.86 | 678 | 657 | 162.9 |
| D | 10 | 172 | 44146 | 266.99 | 678 | 657 | 162.9 |
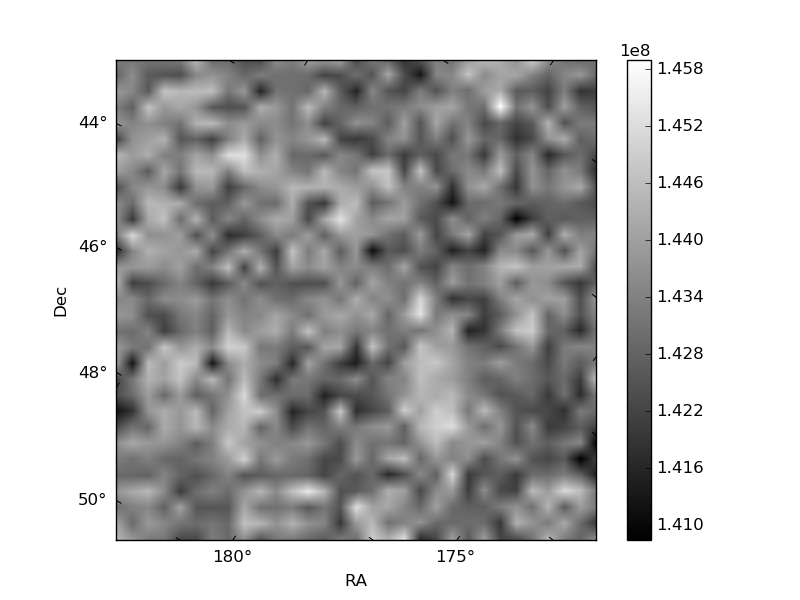
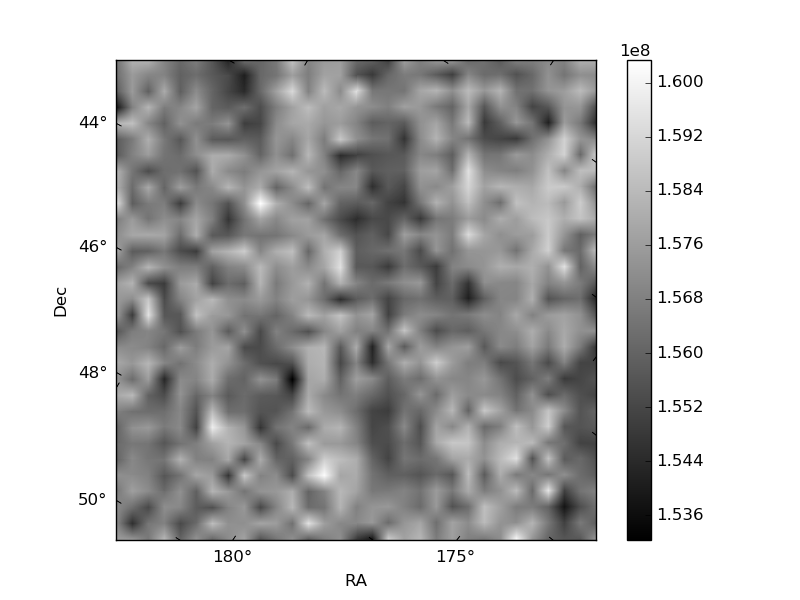
Histogram calculated using DETX and DETY for each event in the final _common_clean file
| Quadrant A | 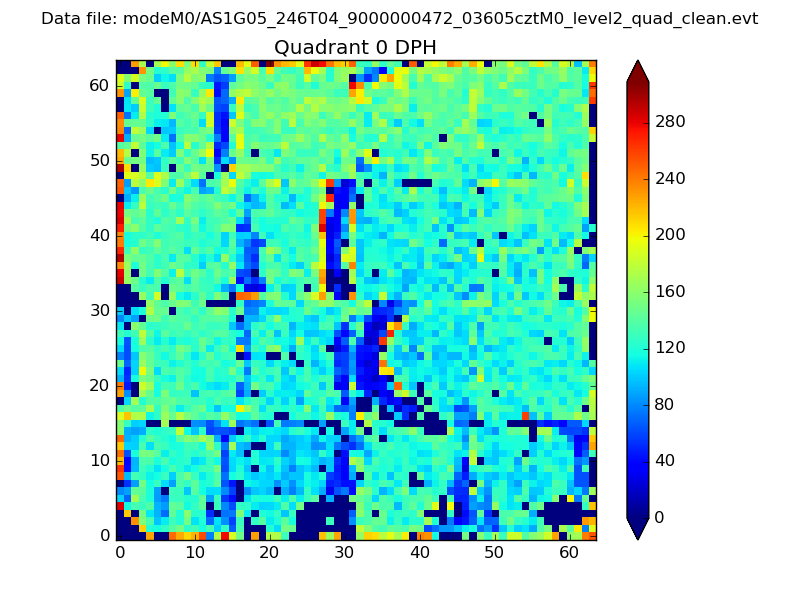 |
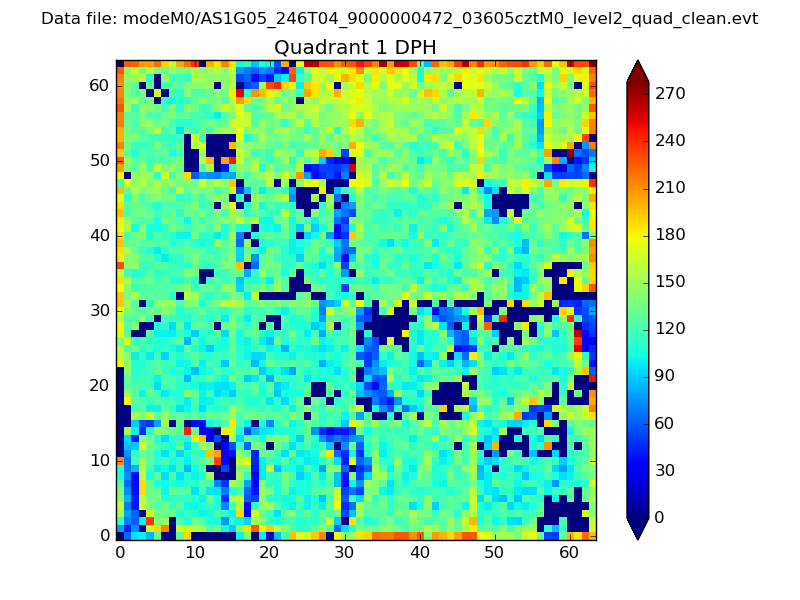 |
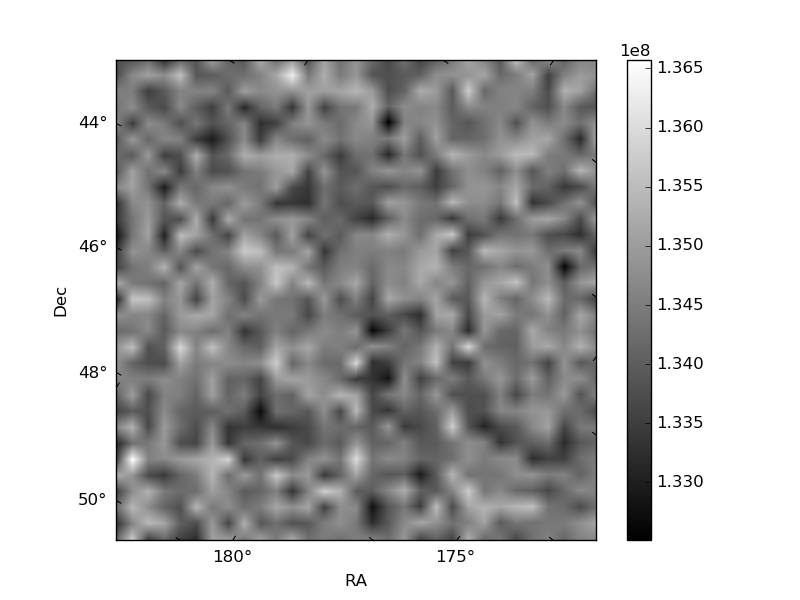
Quadrant B |
|---|---|---|---|
| Quadrant D | 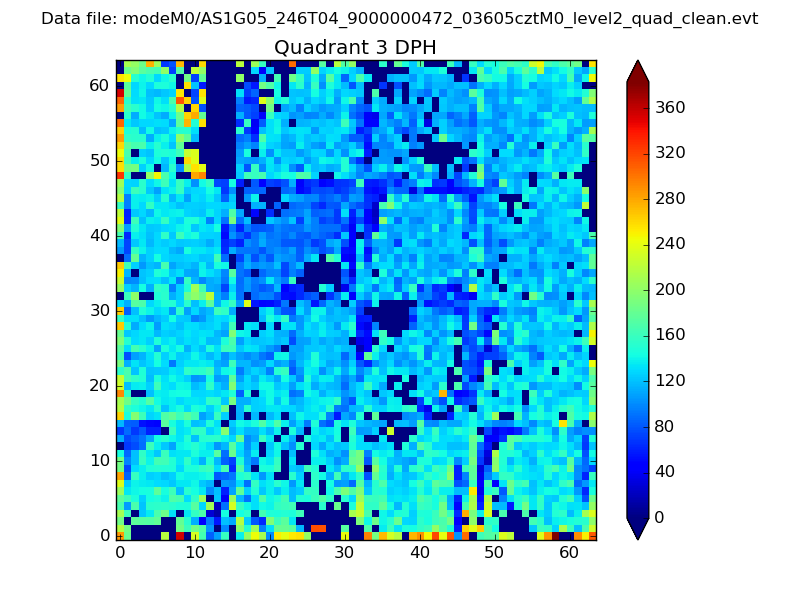 |
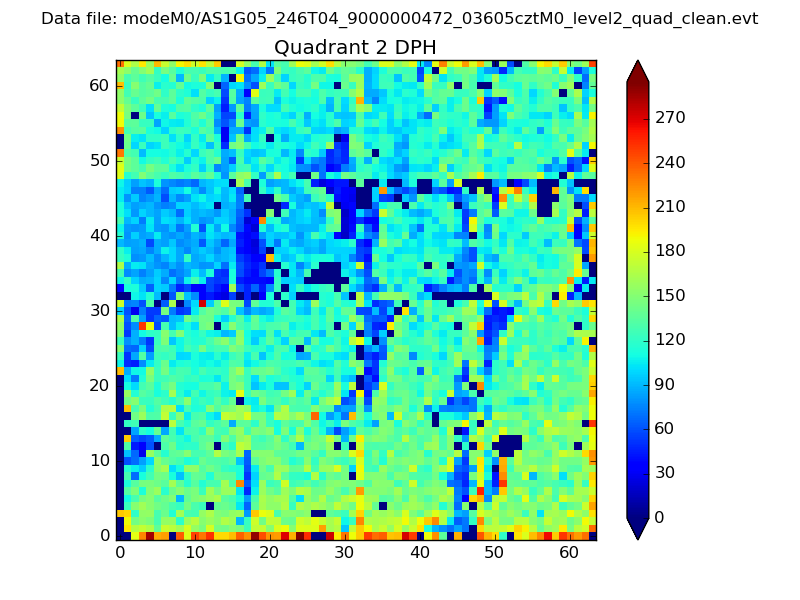 |
Quadrant C |
| Plot type | Count rate plots | Images |
|---|---|---|
| Comparison with Poisson distribution Blue bars denote a histogram of data divided into 1 sec bins. Red curve is a Poisson curve with rate = median count rate of data. |
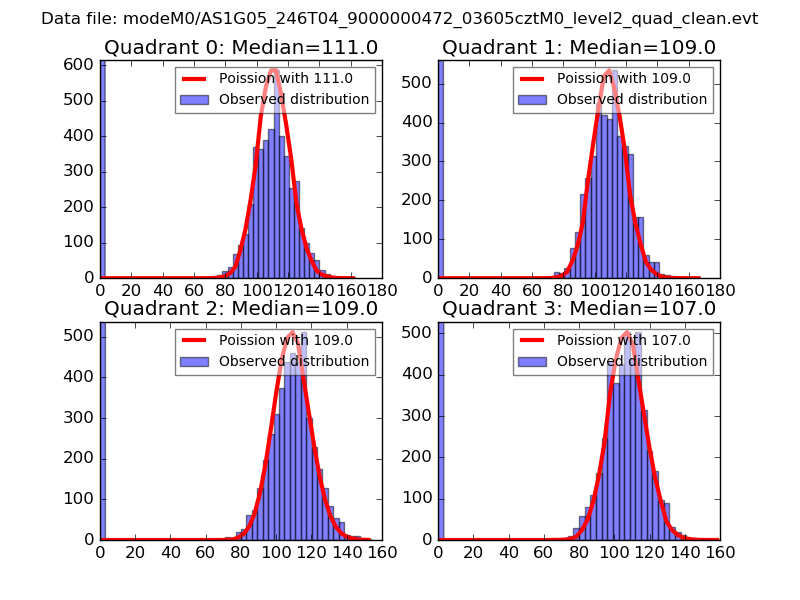 |
 |
| Quadrant-wise count rates Data is divided into 100 sec bins |
 |
|
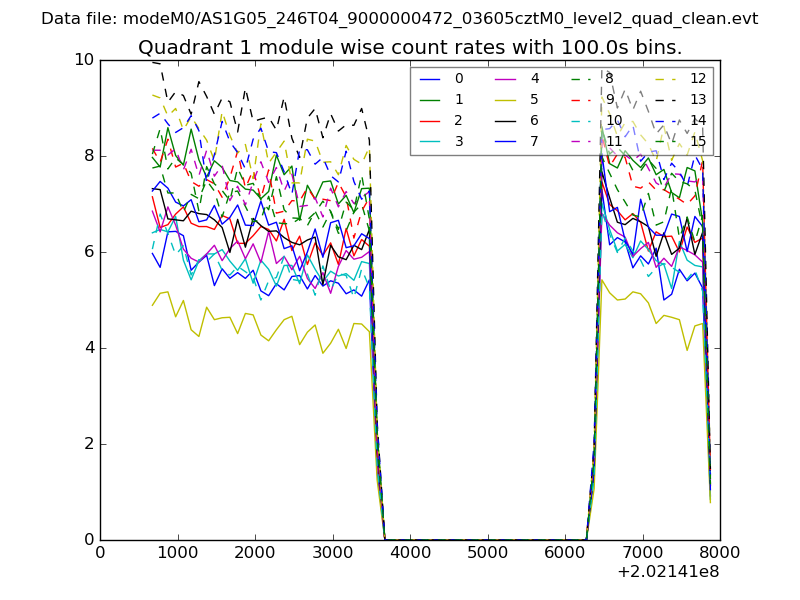
| Module-wise count rates for Quadrant A Data is divided into 100 sec bins |
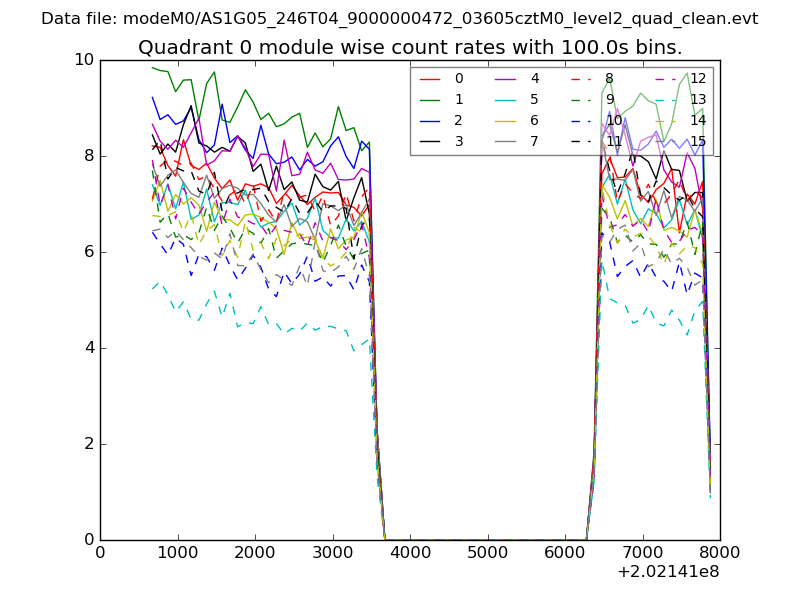 |
 |
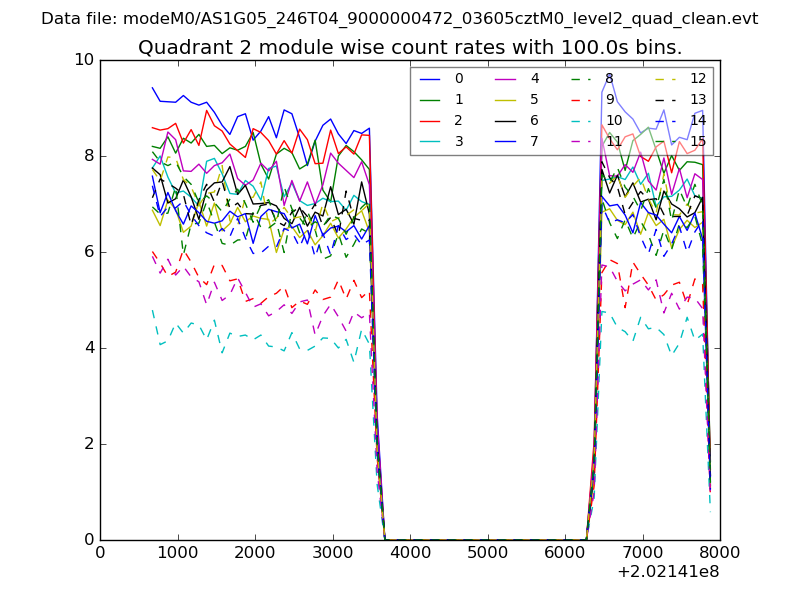
| Module-wise count rates for Quadrant B Data is divided into 100 sec bins |
 |
 |
| Module-wise count rates for Quadrant C Data is divided into 100 sec bins |
 |
 |
| Module-wise count rates for Quadrant D Data is divided into 100 sec bins |
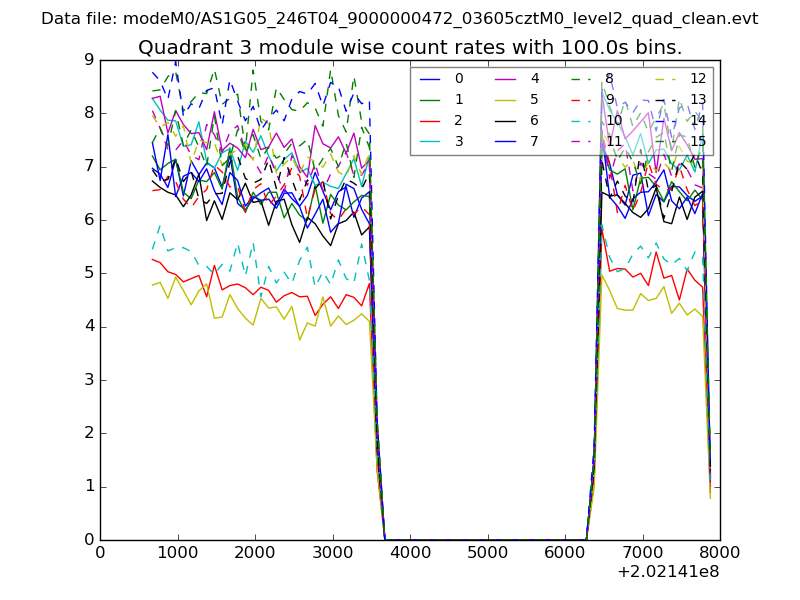 |
 |
| Parameter | Plot |
|---|---|
| CZT HV Monitor | 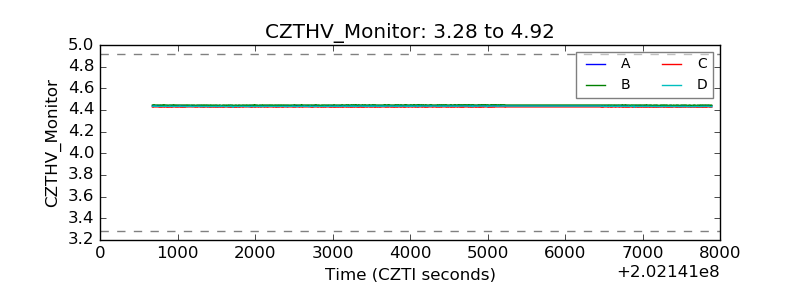 |
| D_VDD | 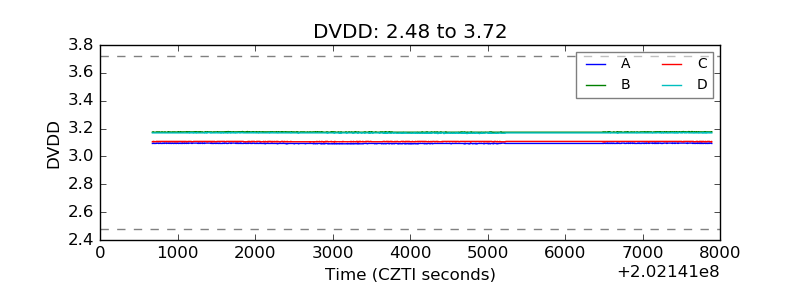 |
| Temperature 1 | 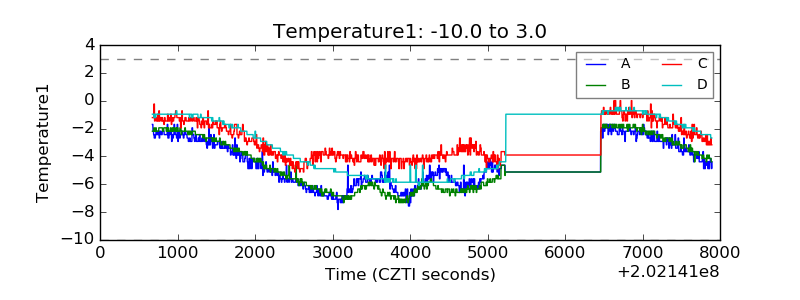 |
| Veto HV Monitor | 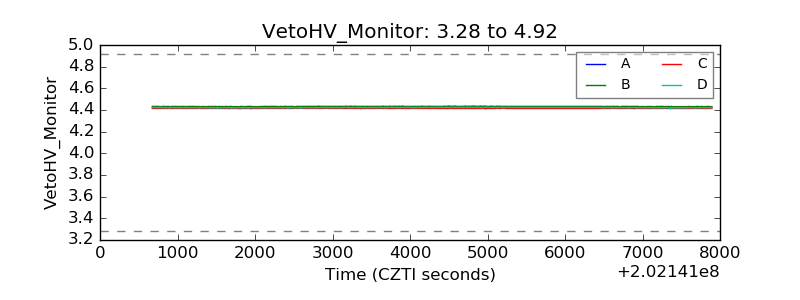 |
| Veto LLD | 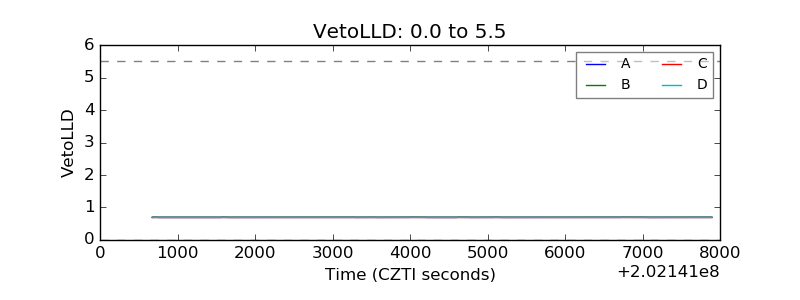 |
| Alpha Counter | 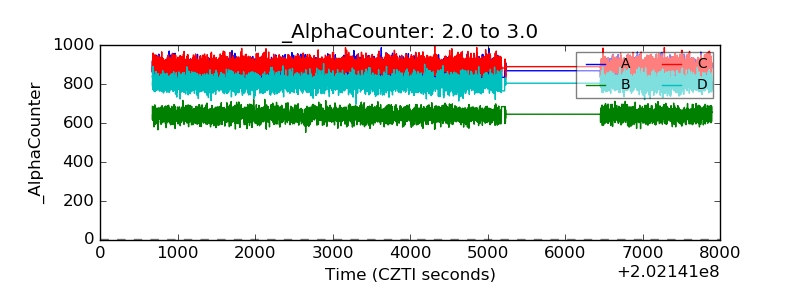 |
| _CPM_Rate | 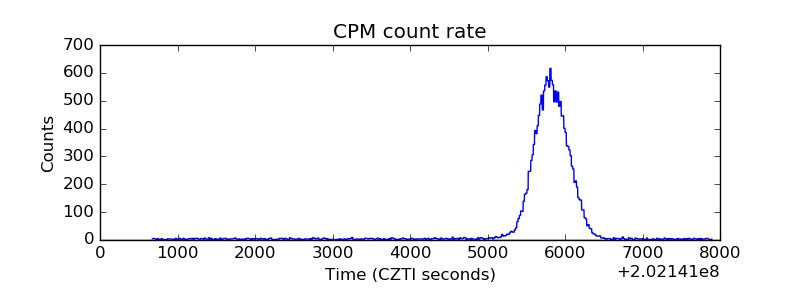 |
| CZT Counter | 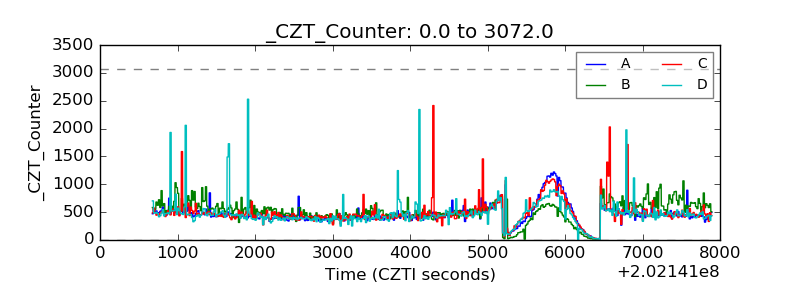 |
| +2.5 Volts monitor |  |
| +5 Volts monitor |  |
| Veto Counter | 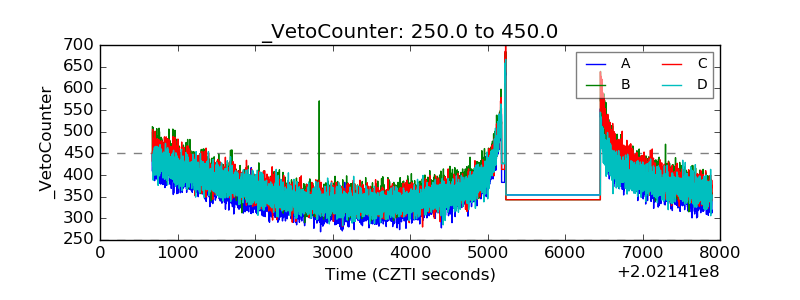 |