| Param | Original file | Final file |
|---|---|---|
| Filename | modeM0/AS1G05_246T04_9000000472_03606cztM0_level2.evt | modeM0/AS1G05_246T04_9000000472_03606cztM0_level2_quad_clean.evt |
| Size (bytes) | 132,431,040 | 32,402,880 |
| Size | 126.3 MB | 30.9 MB |
| Events in quadrant A | 860,411 | 211,744 |
| Events in quadrant B | 1,211,030 | 209,129 |
| Events in quadrant C | 928,478 | 209,455 |
| Events in quadrant D | 872,603 | 205,526 |
| Mode M0 | |||
|---|---|---|---|
| Quadrant | BADHDUFLAG | Total packets | Discarded packets |
| A | 0 | 4027 | 0 |
| B | 0 | 5015 | 0 |
| C | 0 | 4171 | 0 |
| D | 0 | 4089 | 0 |
| Mode SS | |||
|---|---|---|---|
| Quadrant | BADHDUFLAG | Total packets | Discarded packets |
| A | 0 | 40 | 0 |
| B | 0 | 40 | 0 |
| C | 0 | 40 | 0 |
| D | 0 | 40 | 0 |
| Quadrant | Total seconds | Saturated seconds | Saturation percentage |
|---|---|---|---|
| A | 1992 | 2 | 0.100402% |
| B | 1992 | 12 | 0.602410% |
| C | 1992 | 13 | 0.652610% |
| D | 1992 | 9 | 0.451807% |
Noise dominated data is calculated using 1-second bins in cleaned event files. If a bin has >2000 counts, and if more than 50% of those come from <1% of pixels, then it is considered to be noise-dominated and hence unusable.
| Quadrant | # 1 sec bins | Bins with >0 counts | Bins with >2000 counts | High rate bins dominated by noise | Noise dominated (total time) | Noise dominated (detector-on time) | Marked lightcurve |
|---|---|---|---|---|---|---|---|
| A | 1992 | 1992 | 2 | 2 | 0.10% | 0.10% | 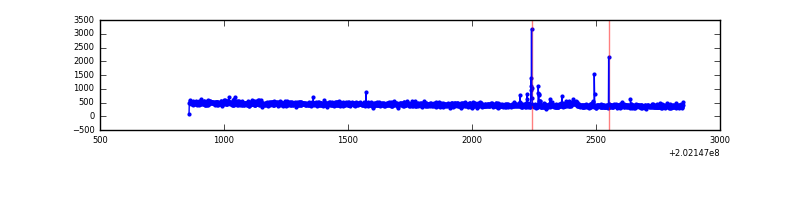 |
| B | 1992 | 1992 | 10 | 10 | 0.50% | 0.50% | 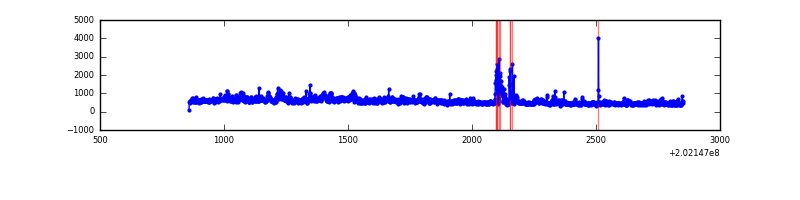 |
| C | 1992 | 1992 | 10 | 10 | 0.50% | 0.50% | 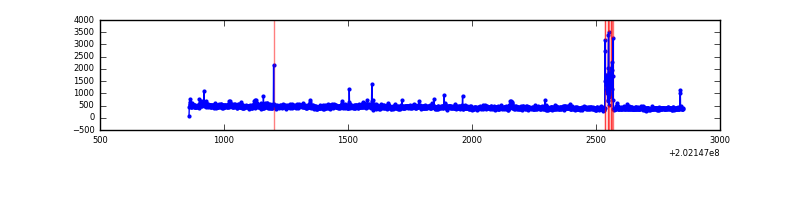 |
| D | 1992 | 1992 | 4 | 4 | 0.20% | 0.20% | 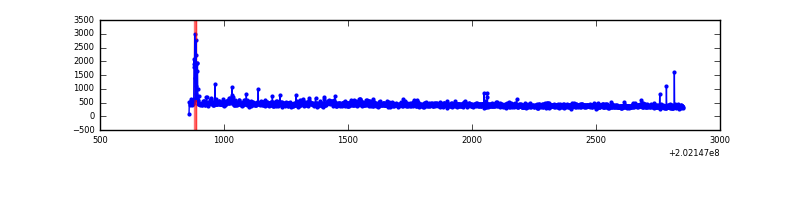 |
Top three noisy pixels from each quadrant. If the there are fewer than three noisy pixels in the level2.evt file, extra rows are filled as -1
| Pixel properties | Quadrant properties | ||||||
|---|---|---|---|---|---|---|---|
| Quadrant | DetID | PixID | Counts | Sigma | Mean | Median | Sigma |
| A | 0 | 50 | 15456 | 330.09 | 216 | 212 | 46.2 |
| A | 7 | 16 | 7179 | 150.86 | 216 | 212 | 46.2 |
| A | 12 | 194 | 2320 | 45.65 | 216 | 212 | 46.2 |
| B | 15 | 204 | 250971 | 5758.49 | 218 | 213 | 43.5 |
| B | 2 | 249 | 34876 | 796.01 | 218 | 213 | 43.5 |
| B | 4 | 81 | 25344 | 577.12 | 218 | 213 | 43.5 |
| C | 9 | 247 | 50608 | 983.52 | 214 | 216 | 51.2 |
| C | 2 | 53 | 19433 | 375.07 | 214 | 216 | 51.2 |
| C | 1 | 16 | 11291 | 216.16 | 214 | 216 | 51.2 |
| D | 13 | 223 | 21178 | 389.66 | 215 | 209 | 53.8 |
| D | 5 | 233 | 11114 | 202.65 | 215 | 209 | 53.8 |
| D | 10 | 34 | 11065 | 201.73 | 215 | 209 | 53.8 |
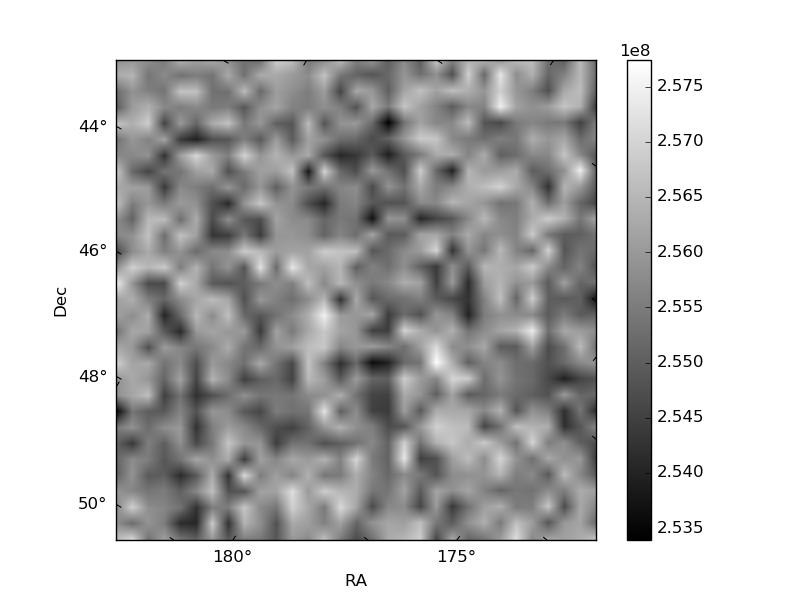
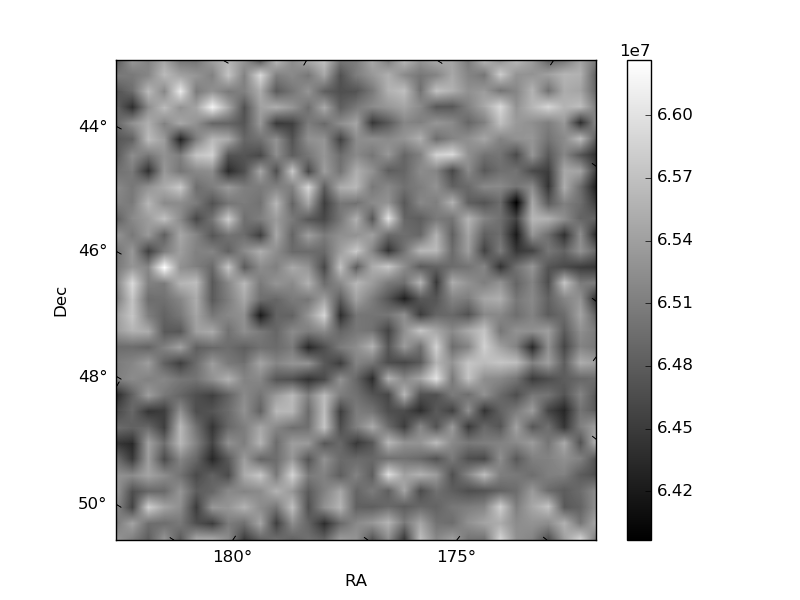
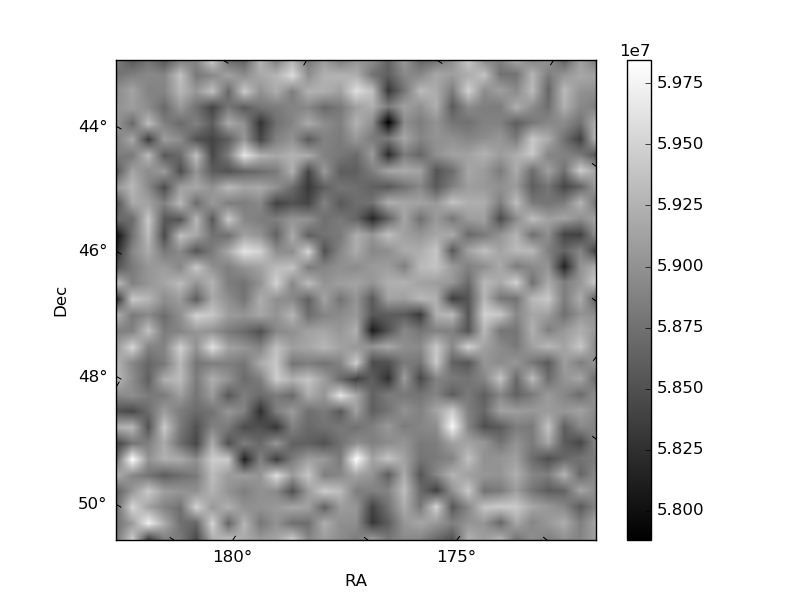
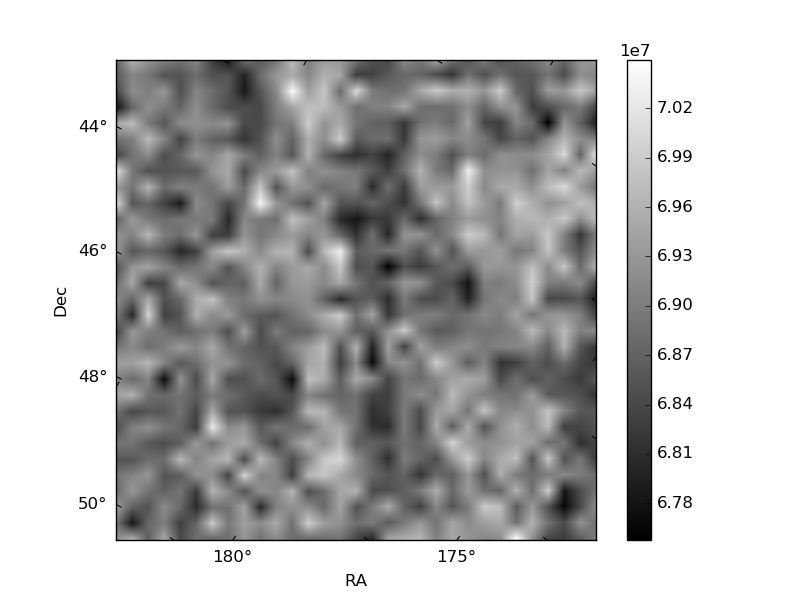
Histogram calculated using DETX and DETY for each event in the final _common_clean file
| Quadrant A | 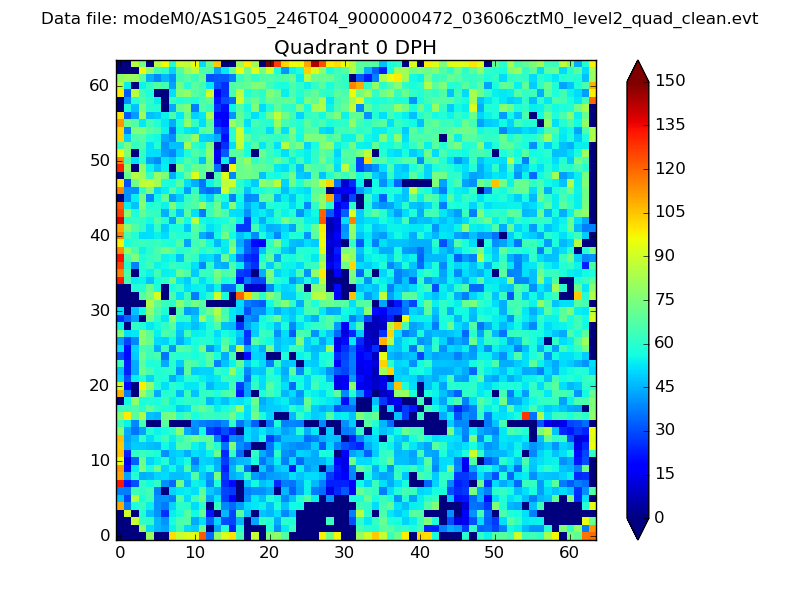 |
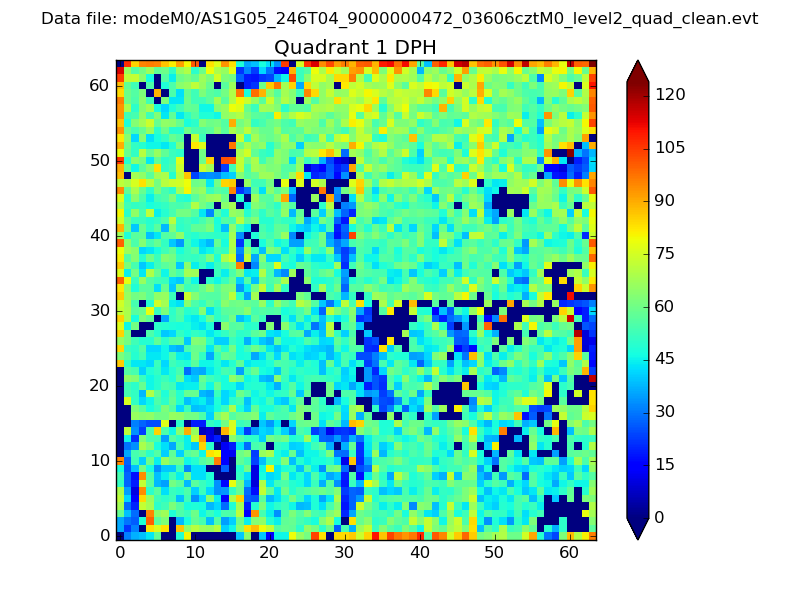 |
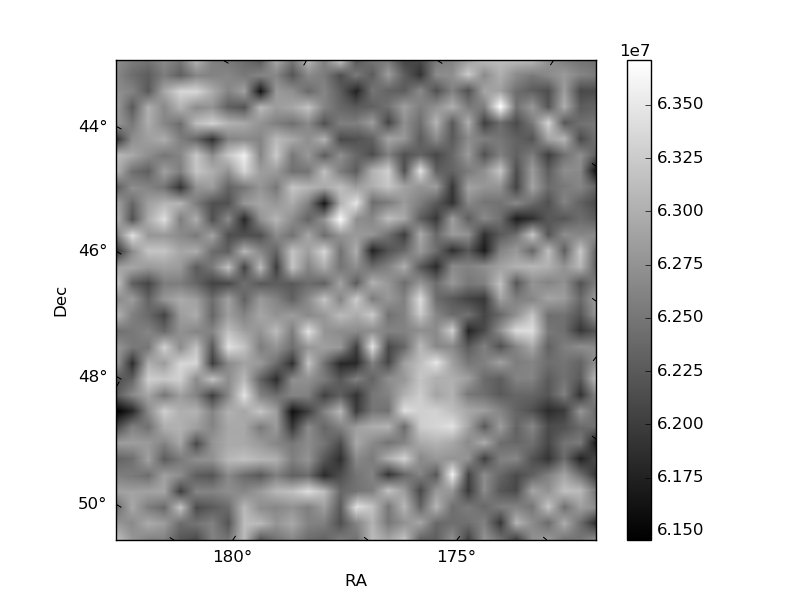
Quadrant B |
|---|---|---|---|
| Quadrant D | 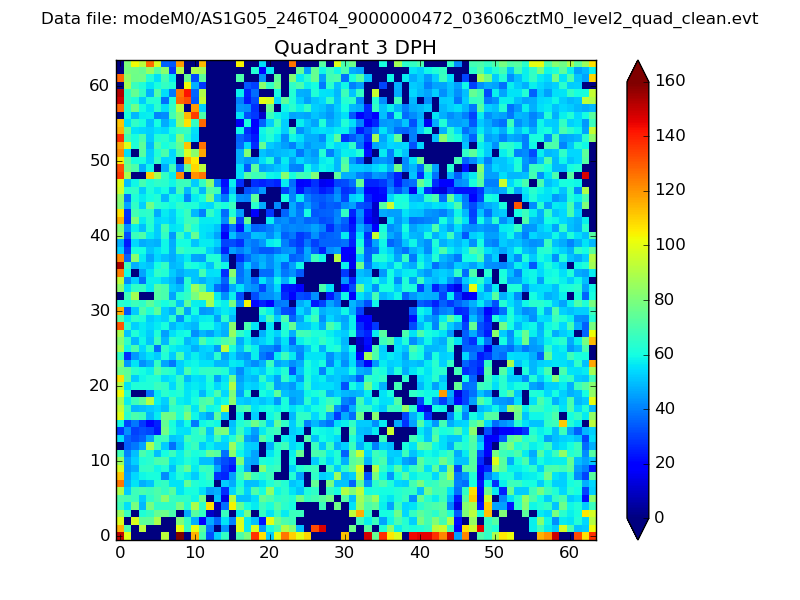 |
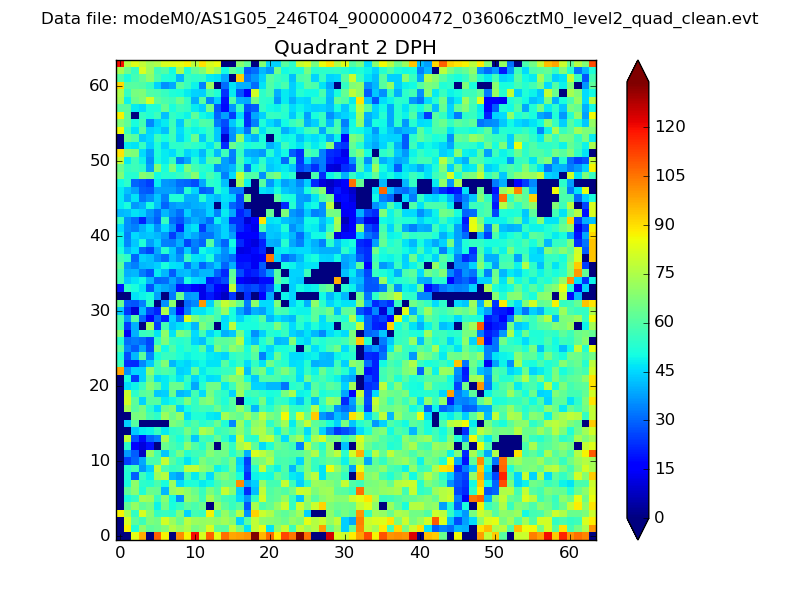 |
Quadrant C |
| Plot type | Count rate plots | Images |
|---|---|---|
| Comparison with Poisson distribution Blue bars denote a histogram of data divided into 1 sec bins. Red curve is a Poisson curve with rate = median count rate of data. |
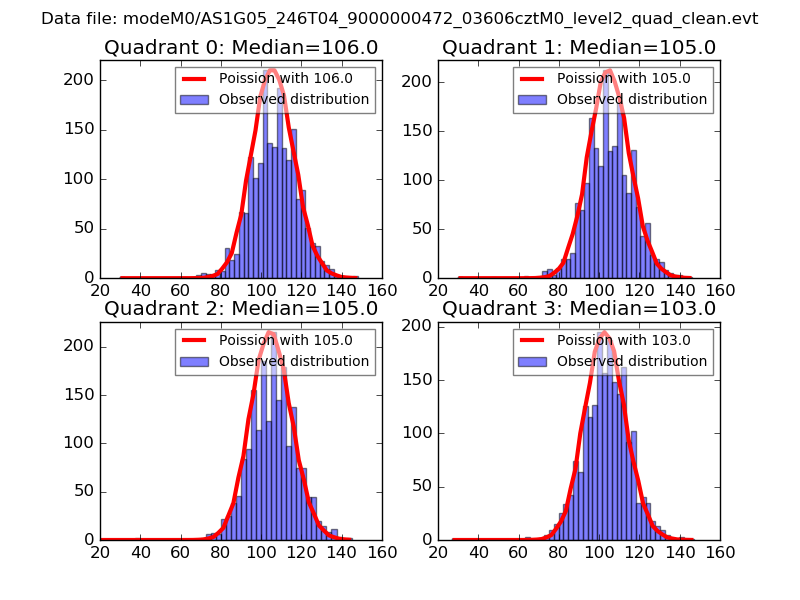 |
 |
| Quadrant-wise count rates Data is divided into 100 sec bins |
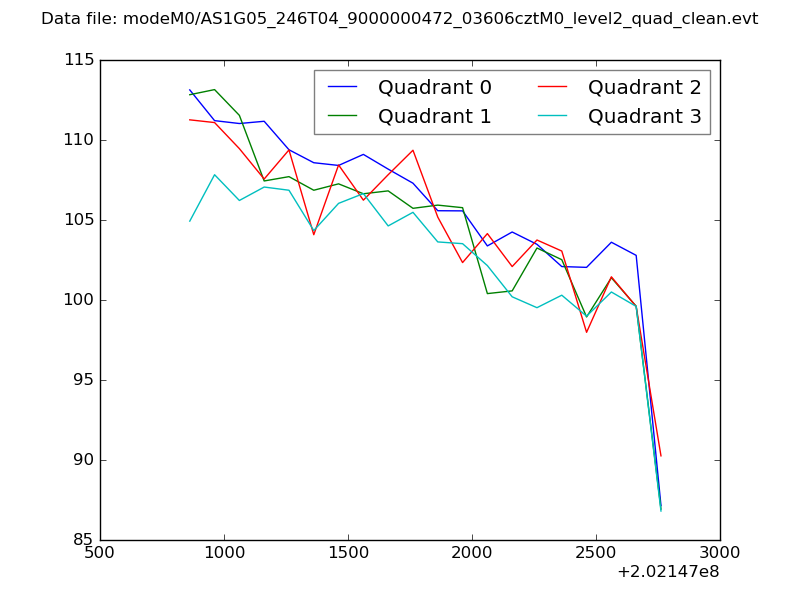 |
|
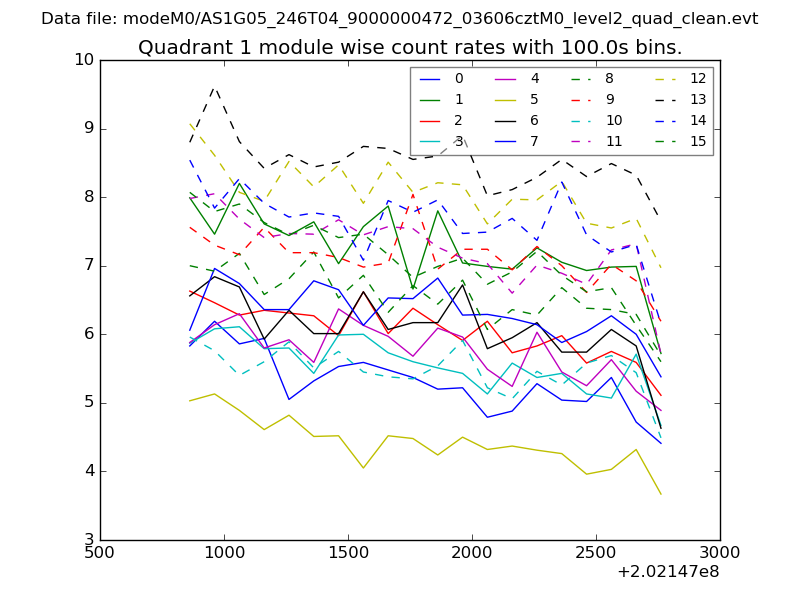
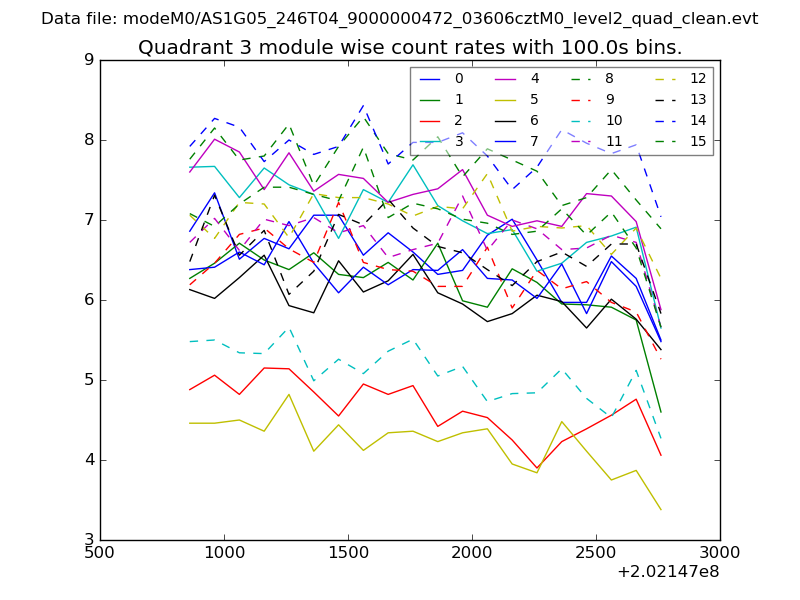
| Module-wise count rates for Quadrant A Data is divided into 100 sec bins |
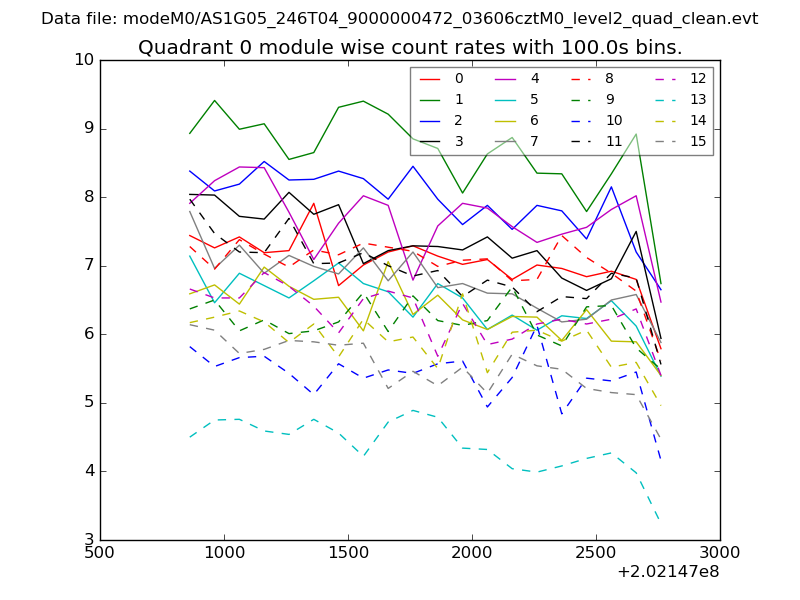 |
 |
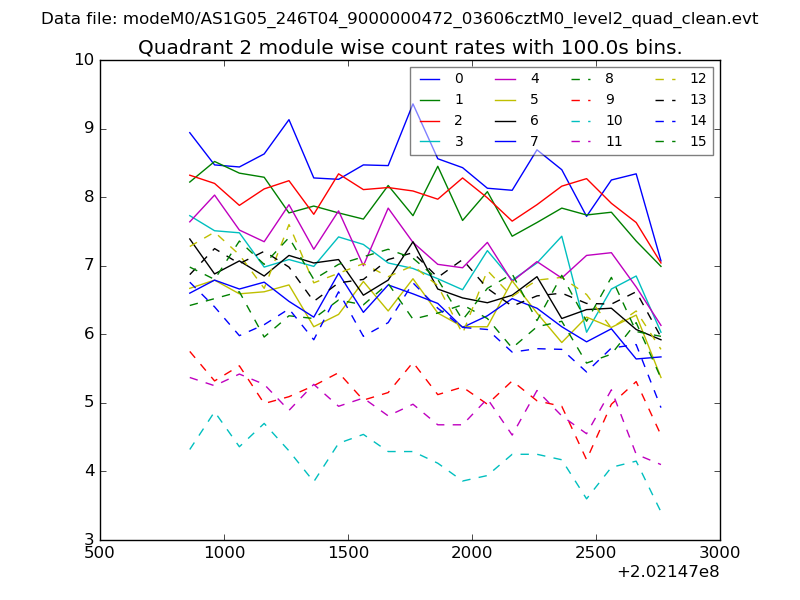
| Module-wise count rates for Quadrant B Data is divided into 100 sec bins |
 |
 |
| Module-wise count rates for Quadrant C Data is divided into 100 sec bins |
 |
 |
| Module-wise count rates for Quadrant D Data is divided into 100 sec bins |
 |
 |
| Parameter | Plot |
|---|---|
| CZT HV Monitor | 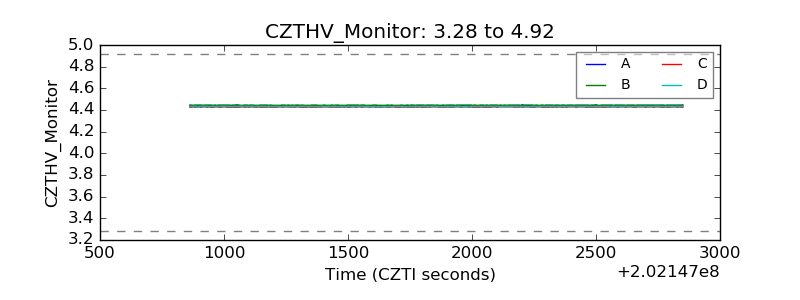 |
| D_VDD | 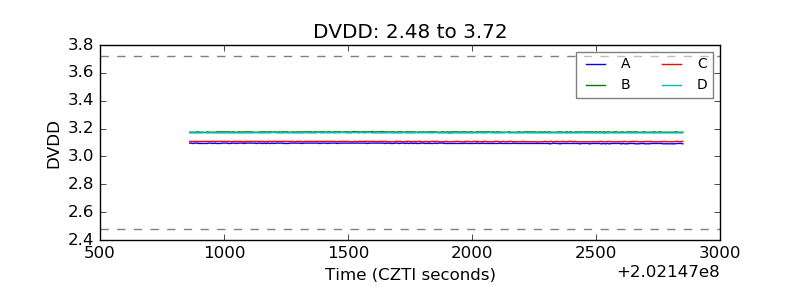 |
| Temperature 1 | 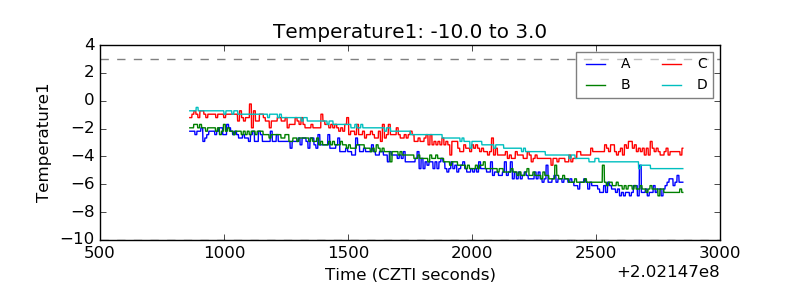 |
| Veto HV Monitor | 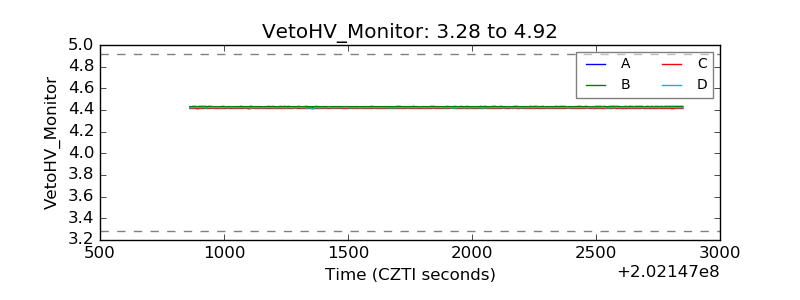 |
| Veto LLD | 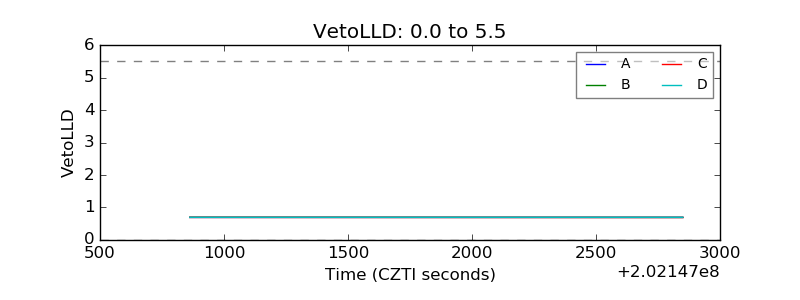 |
| Alpha Counter | 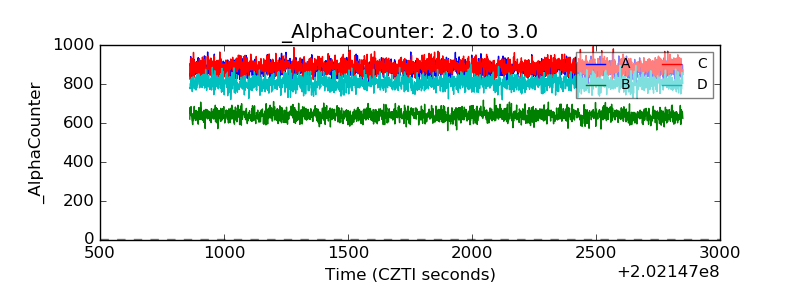 |
| _CPM_Rate | 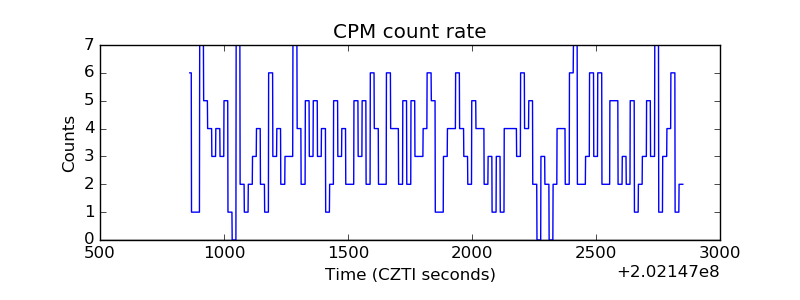 |
| CZT Counter | 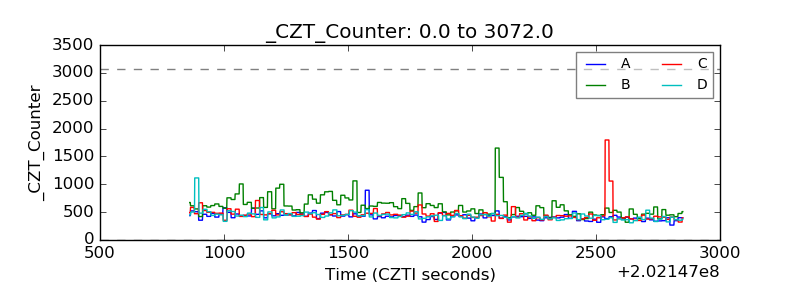 |
| +2.5 Volts monitor |  |
| +5 Volts monitor | 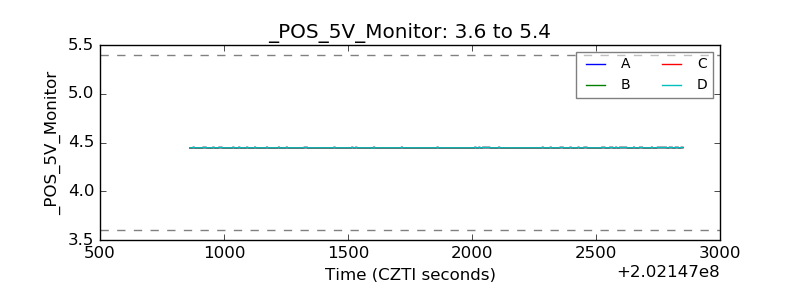 |
| Veto Counter | 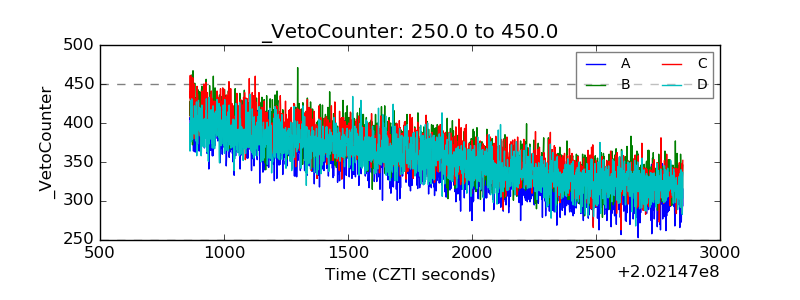 |