| Param | Original file | Final file |
|---|---|---|
| Filename | modeM0/AS1G05_234T02_9000000474cztM0_level2.fits | modeM0/AS1G05_234T02_9000000474cztM0_level2_quad_clean.evt |
| Size (bytes) | 89,565,120 | 103,896,000 |
| Size | 85.4 MB | 99.1 MB |
| Events in quadrant A | 547,334 | 659,152 |
| Events in quadrant B | 517,412 | 635,646 |
| Events in quadrant C | 529,234 | 620,487 |
| Events in quadrant D | 466,156 | 578,330 |
| Mode M9 | |||
|---|---|---|---|
| Quadrant | BADHDUFLAG | Total packets | Discarded packets |
| A | 0 | 12 | 0 |
| B | 0 | 12 | 0 |
| C | 0 | 12 | 0 |
| D | 0 | 12 | 0 |
| Mode SS | |||
|---|---|---|---|
| Quadrant | BADHDUFLAG | Total packets | Discarded packets |
| A | 0 | 190 | 0 |
| B | 0 | 190 | 0 |
| C | 0 | 190 | 0 |
| D | 0 | 190 | 0 |
| Mode M0 | |||
|---|---|---|---|
| Quadrant | BADHDUFLAG | Total packets | Discarded packets |
| A | 0 | 20485 | 0 |
| B | 0 | 23142 | 0 |
| C | 0 | 19142 | 0 |
| D | 0 | 19891 | 0 |
| Quadrant | Total seconds | Saturated seconds | Saturation percentage |
|---|---|---|---|
| A | 9410 | 149 | 1.583422% |
| B | 9410 | 254 | 2.699256% |
| C | 9410 | 68 | 0.722635% |
| D | 9411 | 101 | 1.073212% |
Noise dominated data is calculated using 1-second bins in cleaned event files. If a bin has >2000 counts, and if more than 50% of those come from <1% of pixels, then it is considered to be noise-dominated and hence unusable.
| Quadrant | # 1 sec bins | Bins with >0 counts | Bins with >2000 counts | High rate bins dominated by noise | Noise dominated (total time) | Noise dominated (detector-on time) | Marked lightcurve |
|---|---|---|---|---|---|---|---|
| A | 10590 | 9410 | 0 | 0 | 0.00% | 0.00% |  |
| B | 10590 | 9410 | 0 | 0 | 0.00% | 0.00% |  |
| C | 10590 | 9410 | 0 | 0 | 0.00% | 0.00% | 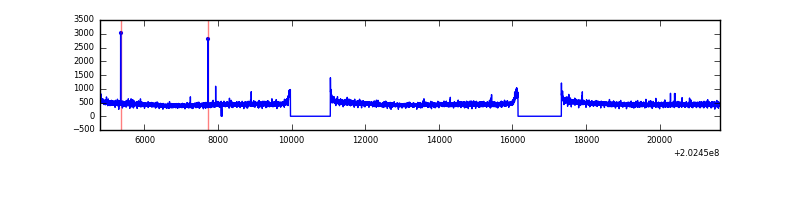 |
| D | 10590 | 9410 | 0 | 0 | 0.00% | 0.00% |  |
Top three noisy pixels from each quadrant. If the there are fewer than three noisy pixels in the level2.evt file, extra rows are filled as -1
| Pixel properties | Quadrant properties | ||||||
|---|---|---|---|---|---|---|---|
| Quadrant | DetID | PixID | Counts | Sigma | Mean | Median | Sigma |
| A | 0 | 29 | 523 | 10.15 | 142 | 134 | 38.3 |
| A | 14 | 188 | 522 | 10.12 | 142 | 134 | 38.3 |
| A | 14 | 204 | 480 | 9.03 | 142 | 134 | 38.3 |
| B | 2 | 9 | 413 | 9.4 | 137 | 131 | 30.0 |
| B | 12 | 226 | 405 | 9.13 | 137 | 131 | 30.0 |
| B | 5 | 128 | 363 | 7.73 | 137 | 131 | 30.0 |
| C | 1 | 81 | 400 | 6.97 | 139 | 130 | 38.8 |
| C | 1 | 80 | 396 | 6.86 | 139 | 130 | 38.8 |
| C | 9 | 188 | 373 | 6.27 | 139 | 130 | 38.8 |
| D | 11 | 82 | 398 | 7.44 | 133 | 121 | 37.2 |
| D | 3 | 14 | 363 | 6.5 | 133 | 121 | 37.2 |
| D | 7 | 5 | 329 | 5.59 | 133 | 121 | 37.2 |
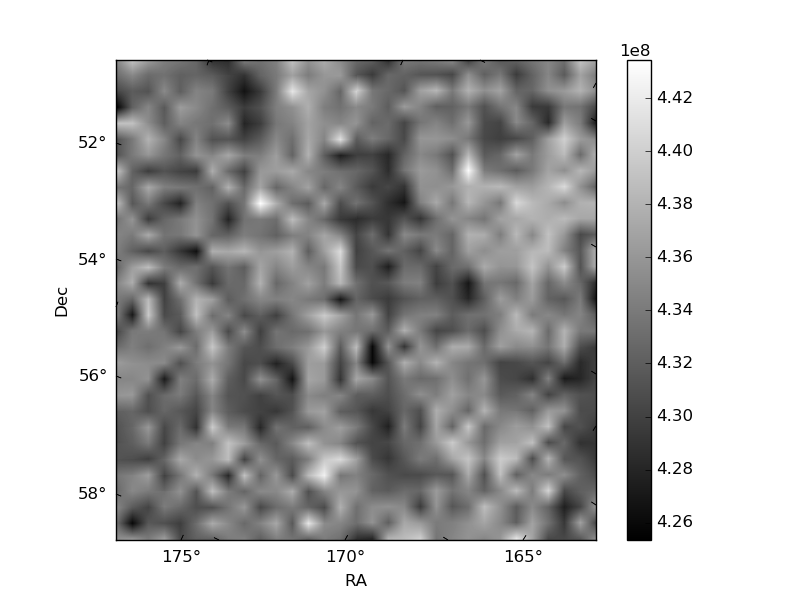
Histogram calculated using DETX and DETY for each event in the final _common_clean file
| Quadrant A |  |
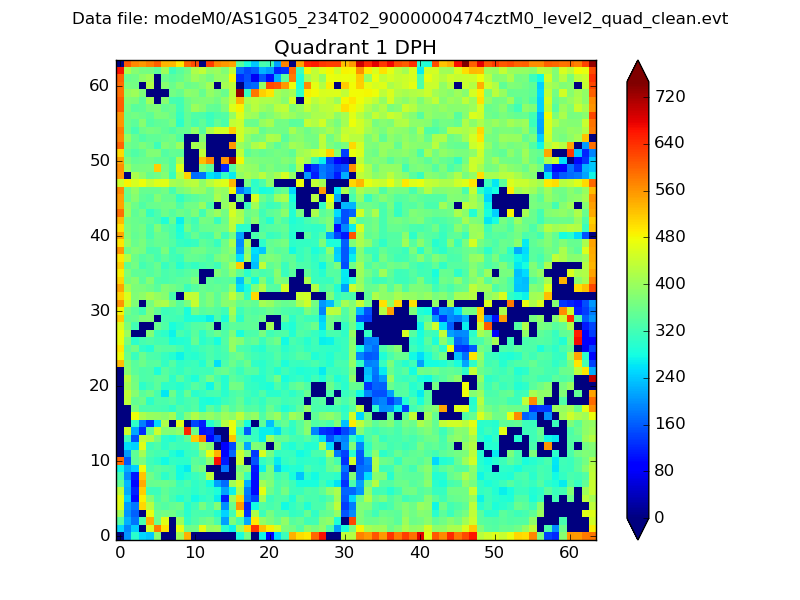 |
Quadrant B |
|---|---|---|---|
| Quadrant D |  |
 |
Quadrant C |
| Plot type | Count rate plots | Images |
|---|---|---|
| Comparison with Poisson distribution Blue bars denote a histogram of data divided into 1 sec bins. Red curve is a Poisson curve with rate = median count rate of data. |
 |
 |
| Quadrant-wise count rates Data is divided into 100 sec bins |
 |
|
| Module-wise count rates for Quadrant A Data is divided into 100 sec bins |
 |
 |
| Module-wise count rates for Quadrant B Data is divided into 100 sec bins |
 |
 |
| Module-wise count rates for Quadrant C Data is divided into 100 sec bins |
 |
 |
| Module-wise count rates for Quadrant D Data is divided into 100 sec bins |
 |
 |
| Parameter | Plot |
|---|---|
| CZT HV Monitor | 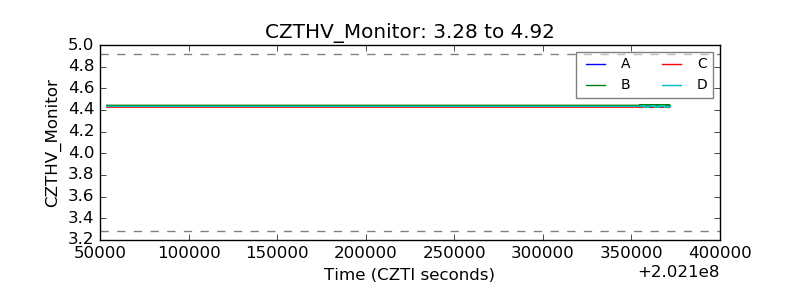 |
| D_VDD | 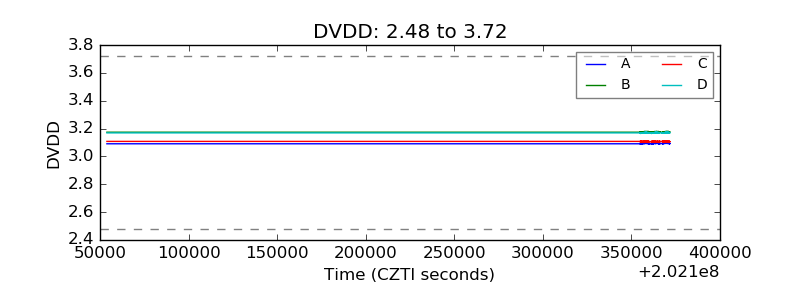 |
| Temperature 1 | 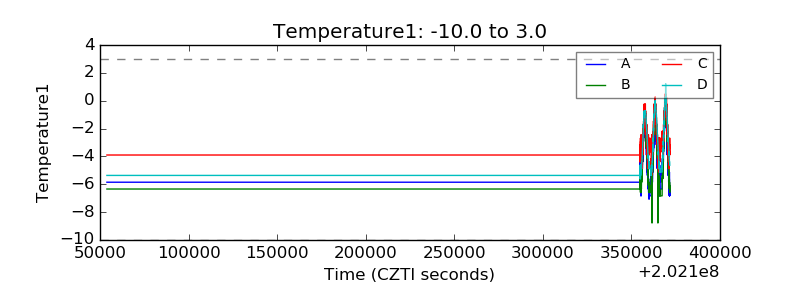 |
| Veto HV Monitor | 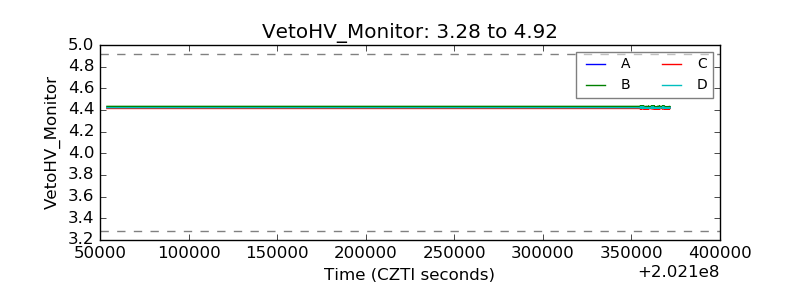 |
| Veto LLD | 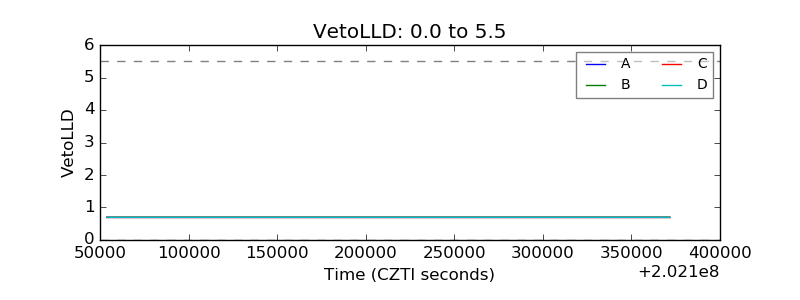 |
| Alpha Counter |  |
| _CPM_Rate |  |
| CZT Counter |  |
| +2.5 Volts monitor |  |
| +5 Volts monitor |  |
| _ROLL_ROT |  |
| _Roll_DEC |  |
| _Roll_RA |  |
| Veto Counter |  |