| Param | Original file | Final file |
|---|---|---|
| Filename | modeM0/AS1G05_234T02_9000000474_03607cztM0_level2.evt | modeM0/AS1G05_234T02_9000000474_03607cztM0_level2_quad_clean.evt |
| Size (bytes) | 469,535,040 | 83,220,480 |
| Size | 447.8 MB | 79.4 MB |
| Events in quadrant A | 3,103,705 | 518,248 |
| Events in quadrant B | 4,027,600 | 510,154 |
| Events in quadrant C | 3,490,189 | 508,122 |
| Events in quadrant D | 3,130,562 | 503,867 |
| Mode M9 | |||
|---|---|---|---|
| Quadrant | BADHDUFLAG | Total packets | Discarded packets |
| A | 0 | 6 | 0 |
| B | 0 | 6 | 0 |
| C | 0 | 6 | 0 |
| D | 0 | 6 | 0 |
| Mode SS | |||
|---|---|---|---|
| Quadrant | BADHDUFLAG | Total packets | Discarded packets |
| A | 0 | 140 | 0 |
| B | 0 | 140 | 0 |
| C | 0 | 140 | 0 |
| D | 0 | 140 | 0 |
| Mode M0 | |||
|---|---|---|---|
| Quadrant | BADHDUFLAG | Total packets | Discarded packets |
| A | 0 | 14308 | 2 |
| B | 0 | 16866 | 1 |
| C | 0 | 15223 | 1 |
| D | 0 | 14699 | 1 |
| Quadrant | Total seconds | Saturated seconds | Saturation percentage |
|---|---|---|---|
| A | 6882 | 33 | 0.479512% |
| B | 6882 | 121 | 1.758210% |
| C | 6882 | 133 | 1.932578% |
| D | 6882 | 63 | 0.915432% |
Noise dominated data is calculated using 1-second bins in cleaned event files. If a bin has >2000 counts, and if more than 50% of those come from <1% of pixels, then it is considered to be noise-dominated and hence unusable.
| Quadrant | # 1 sec bins | Bins with >0 counts | Bins with >2000 counts | High rate bins dominated by noise | Noise dominated (total time) | Noise dominated (detector-on time) | Marked lightcurve |
|---|---|---|---|---|---|---|---|
| A | 7472 | 6883 | 5 | 5 | 0.07% | 0.07% | 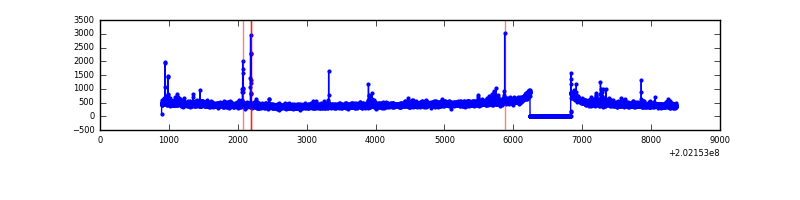 |
| B | 7472 | 6883 | 33 | 33 | 0.44% | 0.48% | 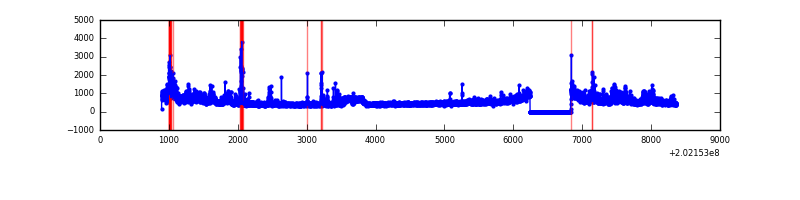 |
| C | 7472 | 6883 | 48 | 48 | 0.64% | 0.70% | 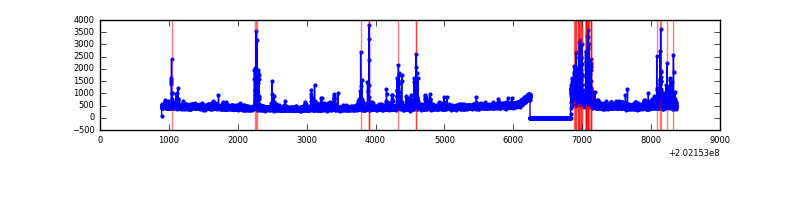 |
| D | 7472 | 6883 | 50 | 50 | 0.67% | 0.73% | 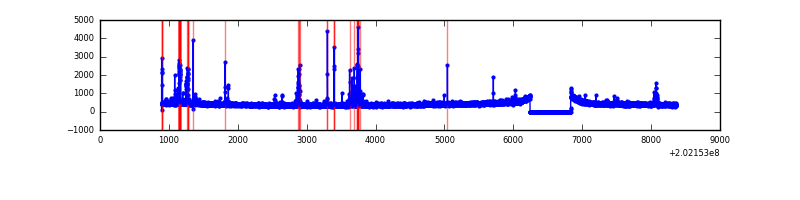 |
Top three noisy pixels from each quadrant. If the there are fewer than three noisy pixels in the level2.evt file, extra rows are filled as -1
| Pixel properties | Quadrant properties | ||||||
|---|---|---|---|---|---|---|---|
| Quadrant | DetID | PixID | Counts | Sigma | Mean | Median | Sigma |
| A | 14 | 238 | 29026 | 176.54 | 773 | 754 | 160.1 |
| A | 0 | 50 | 24111 | 145.85 | 773 | 754 | 160.1 |
| A | 7 | 16 | 22635 | 136.63 | 773 | 754 | 160.1 |
| B | 15 | 204 | 624914 | 4115.16 | 780 | 761 | 151.7 |
| B | 4 | 81 | 113101 | 740.68 | 780 | 761 | 151.7 |
| B | 12 | 16 | 83591 | 546.11 | 780 | 761 | 151.7 |
| C | 2 | 53 | 301630 | 1696.29 | 757 | 760 | 177.4 |
| C | 9 | 247 | 185827 | 1043.4 | 757 | 760 | 177.4 |
| C | 15 | 208 | 32356 | 178.14 | 757 | 760 | 177.4 |
| D | 13 | 46 | 110243 | 600.39 | 753 | 728 | 182.4 |
| D | 13 | 223 | 94713 | 515.25 | 753 | 728 | 182.4 |
| D | 13 | 239 | 23090 | 122.59 | 753 | 728 | 182.4 |
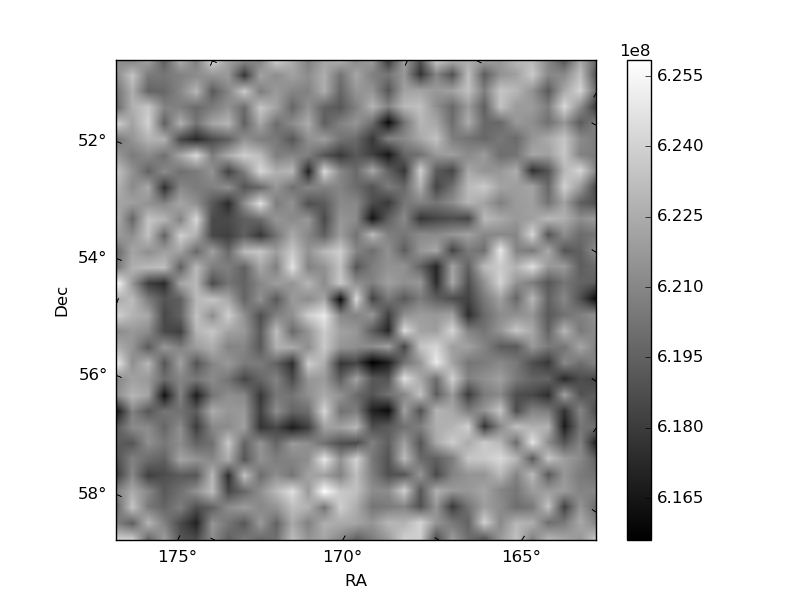
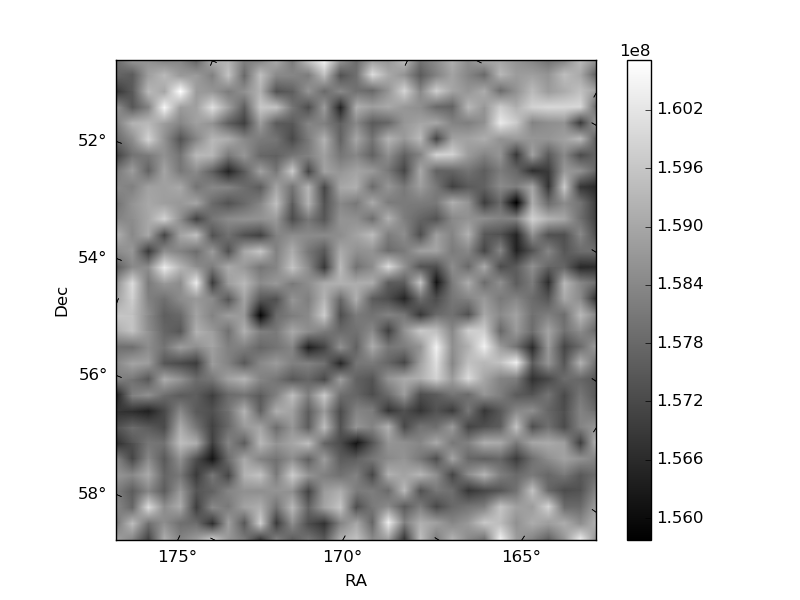
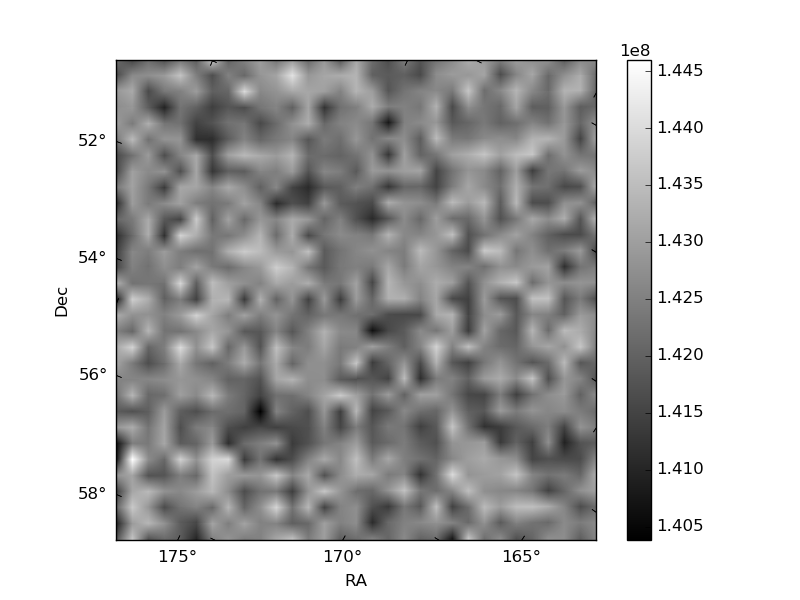
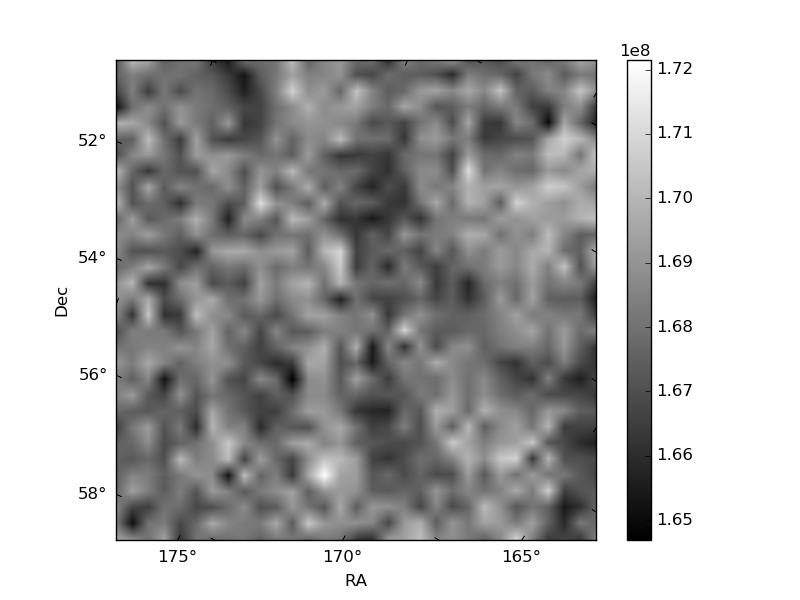
Histogram calculated using DETX and DETY for each event in the final _common_clean file
| Quadrant A | 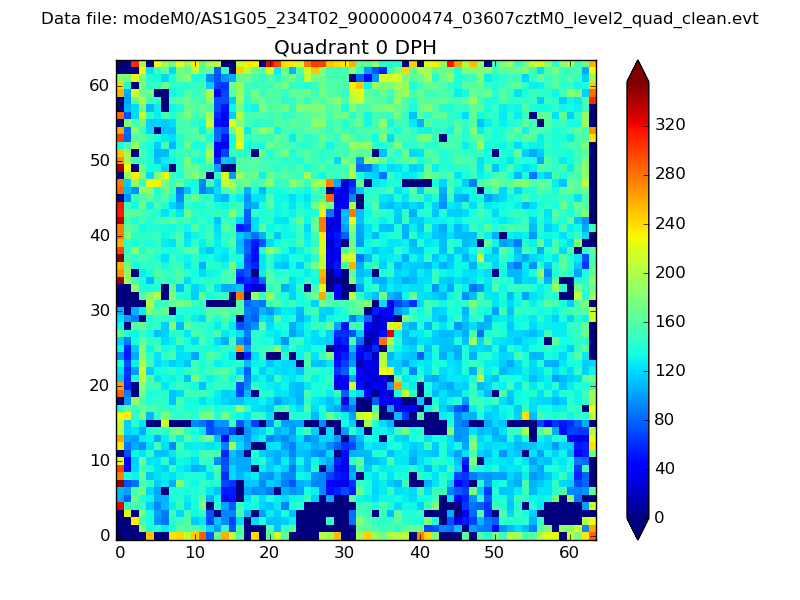 |
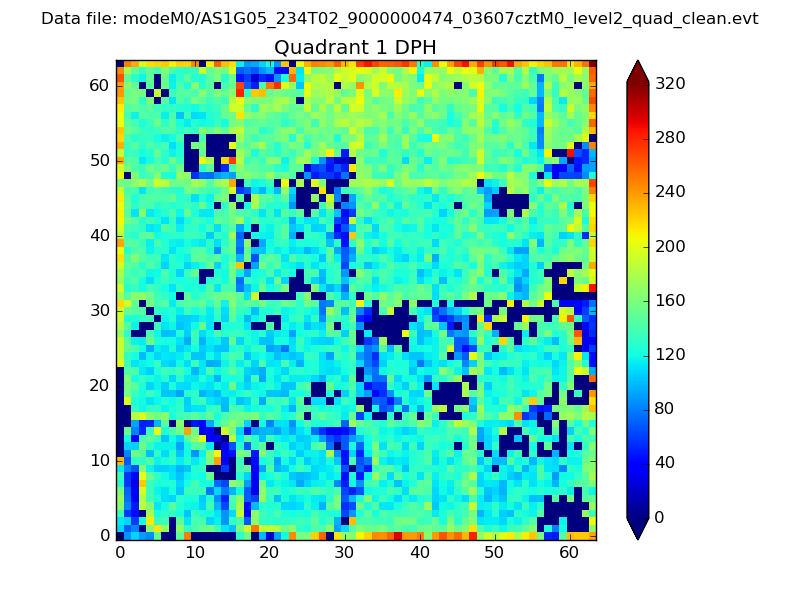 |
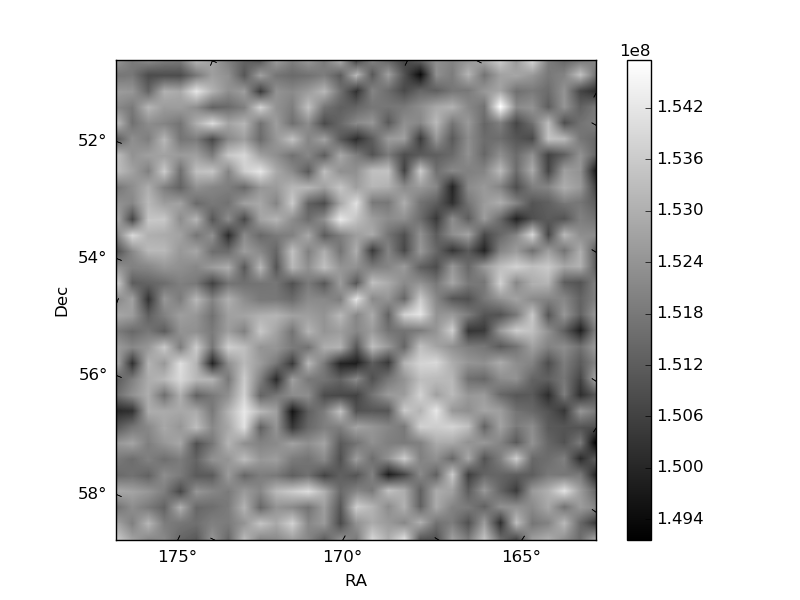
Quadrant B |
|---|---|---|---|
| Quadrant D | 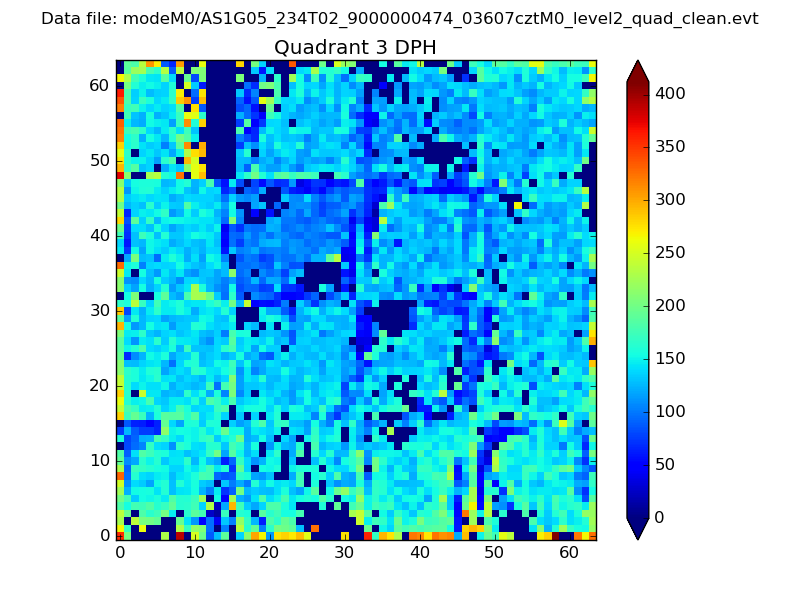 |
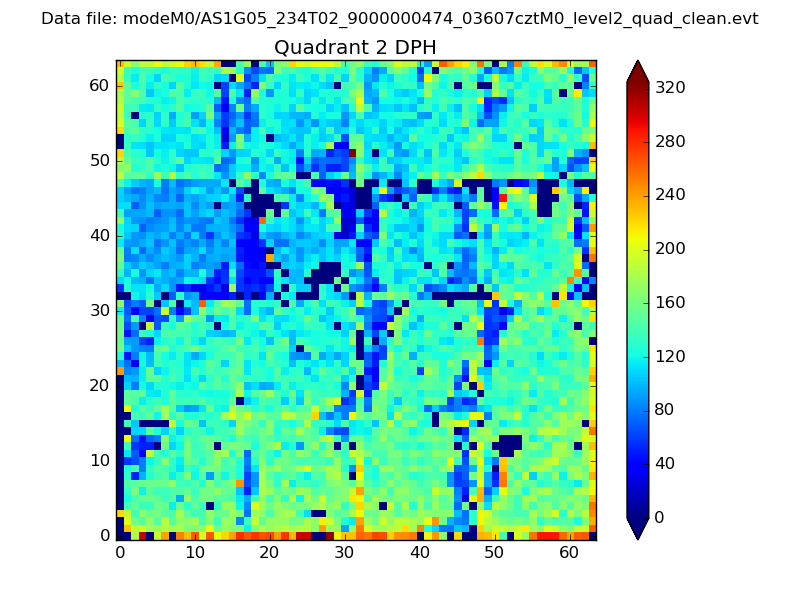 |
Quadrant C |
| Plot type | Count rate plots | Images |
|---|---|---|
| Comparison with Poisson distribution Blue bars denote a histogram of data divided into 1 sec bins. Red curve is a Poisson curve with rate = median count rate of data. |
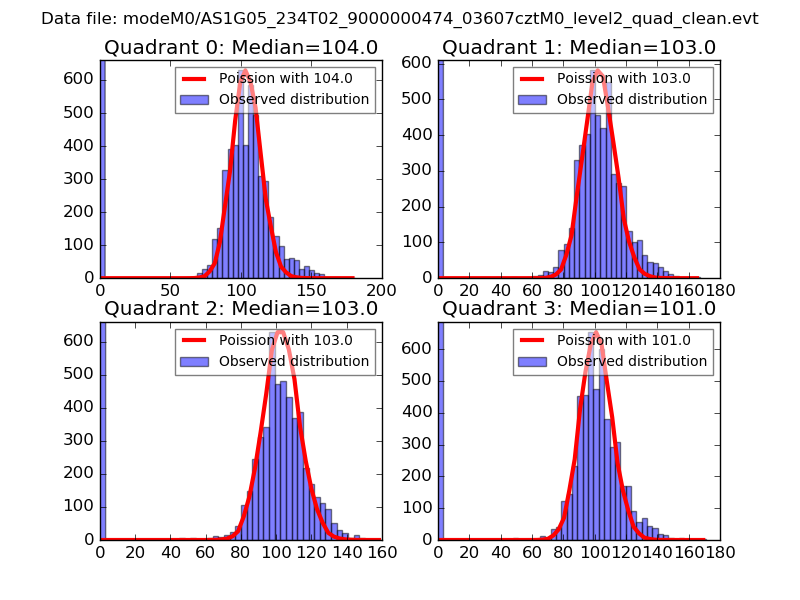 |
 |
| Quadrant-wise count rates Data is divided into 100 sec bins |
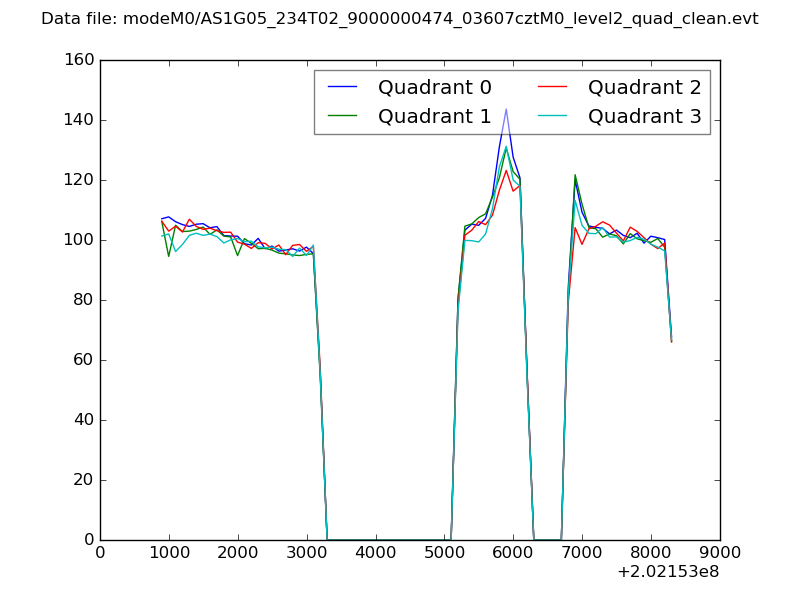 |
|
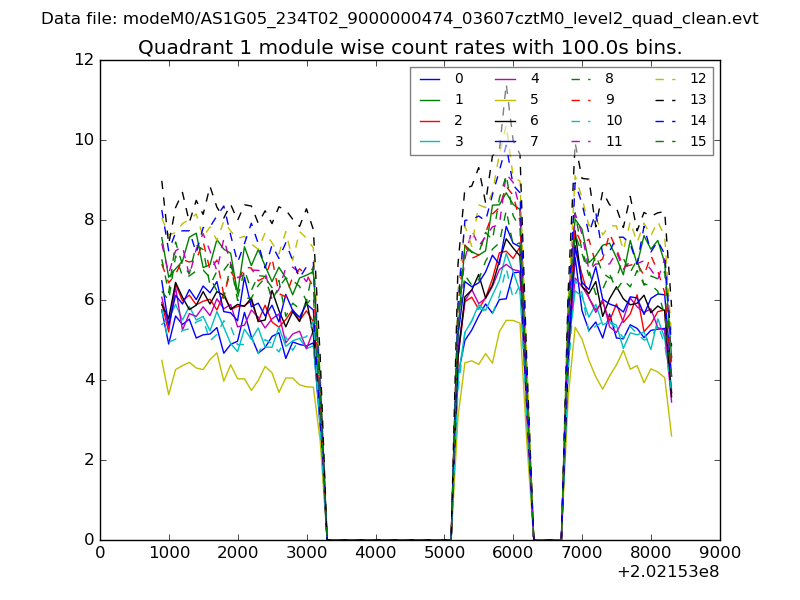
| Module-wise count rates for Quadrant A Data is divided into 100 sec bins |
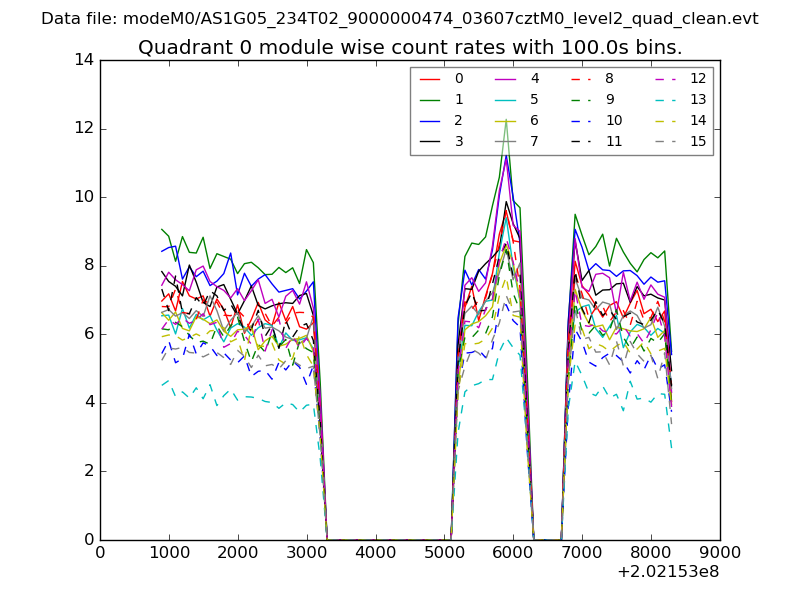 |
 |
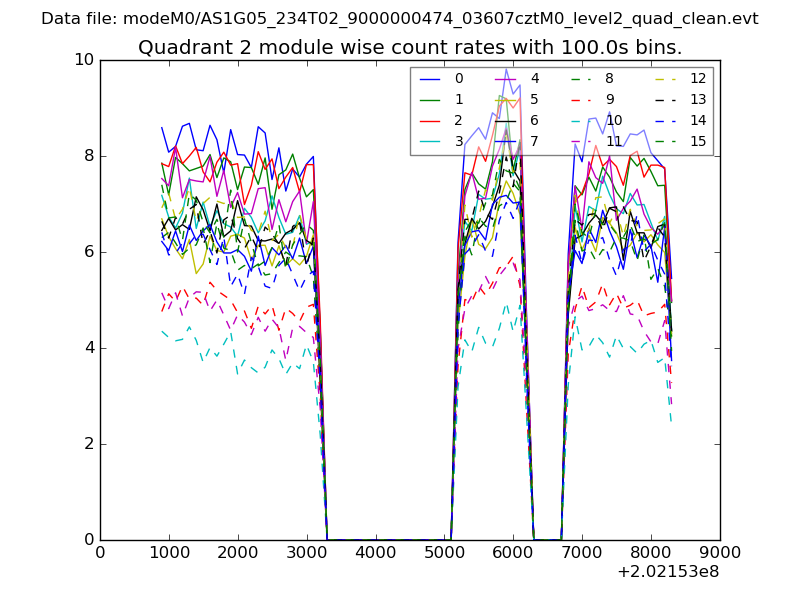
| Module-wise count rates for Quadrant B Data is divided into 100 sec bins |
 |
 |
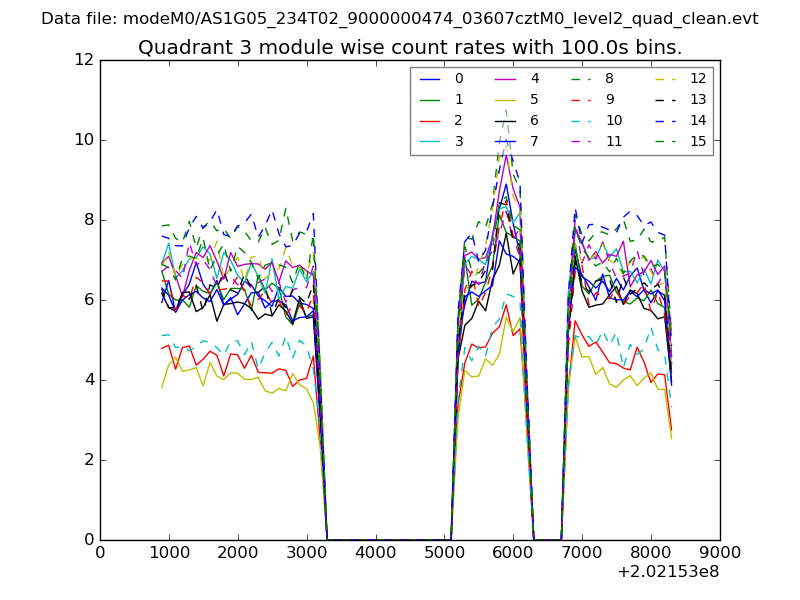
| Module-wise count rates for Quadrant C Data is divided into 100 sec bins |
 |
 |
| Module-wise count rates for Quadrant D Data is divided into 100 sec bins |
 |
 |
| Parameter | Plot |
|---|---|
| CZT HV Monitor | 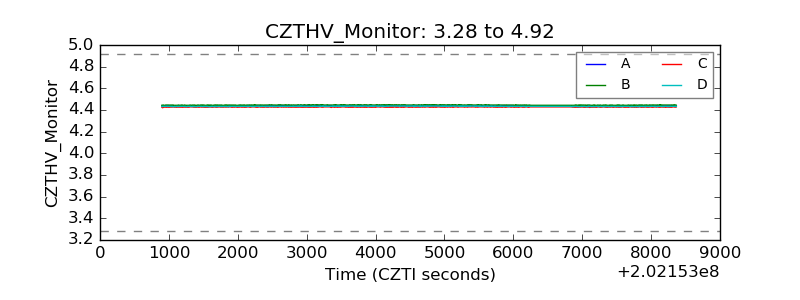 |
| D_VDD | 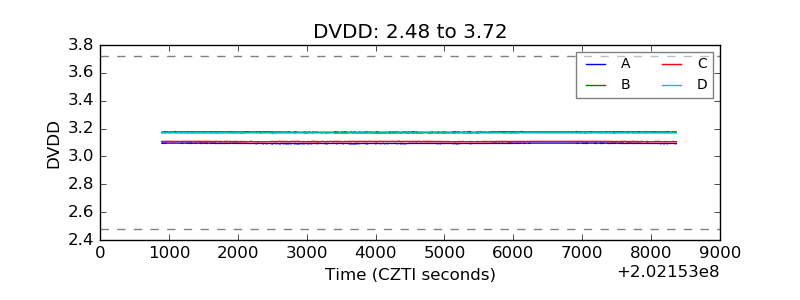 |
| Temperature 1 | 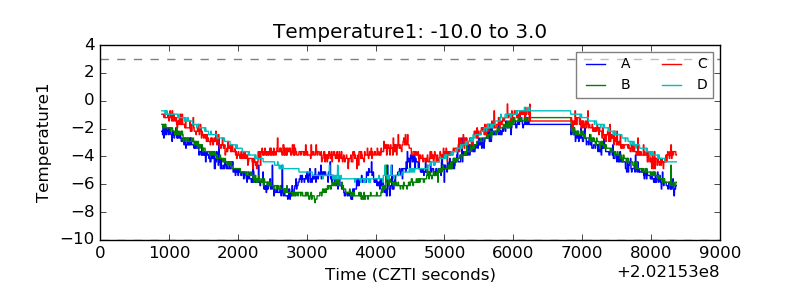 |
| Veto HV Monitor | 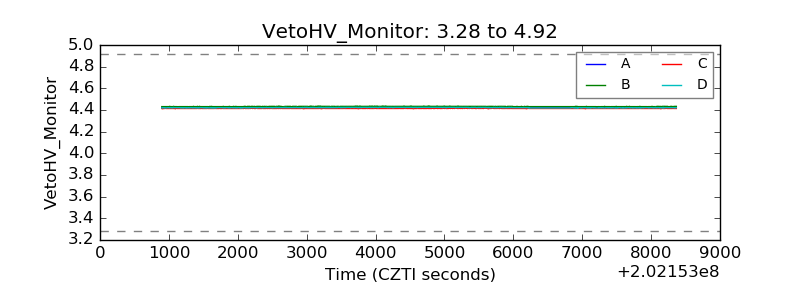 |
| Veto LLD | 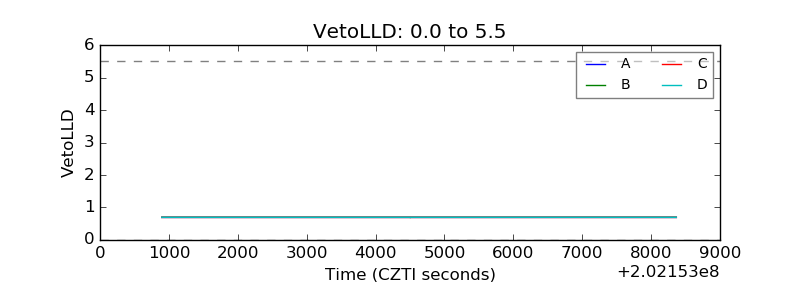 |
| Alpha Counter | 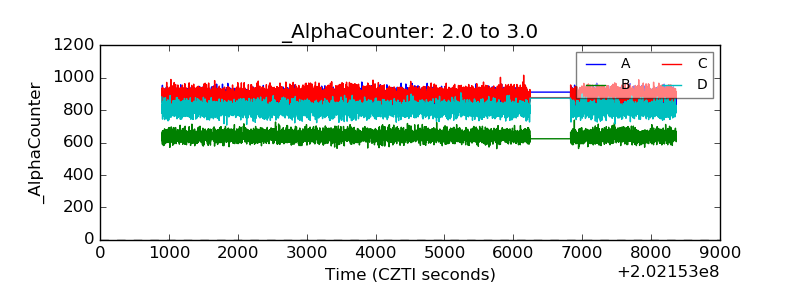 |
| _CPM_Rate | 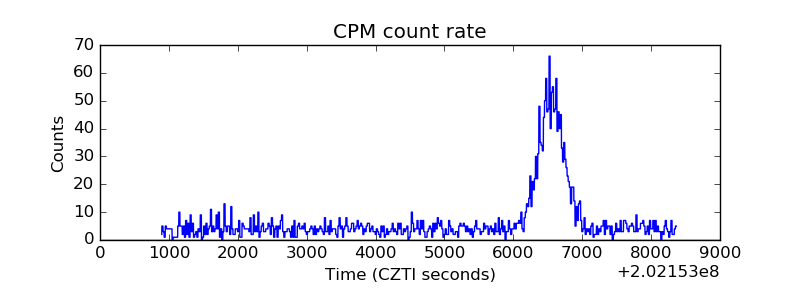 |
| CZT Counter | 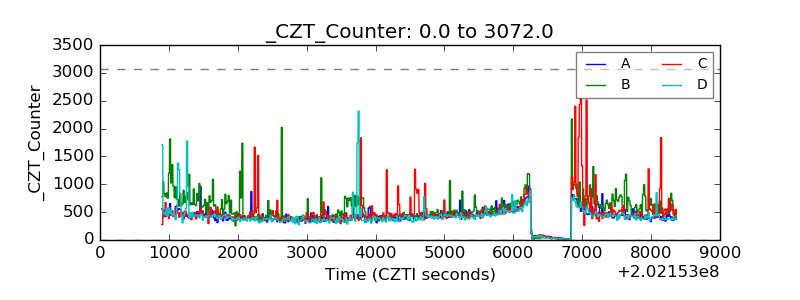 |
| +2.5 Volts monitor | 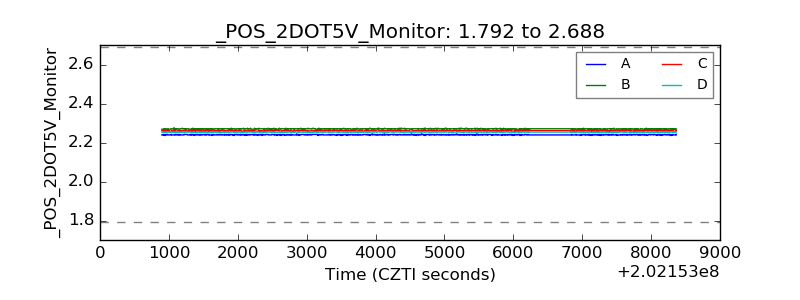 |
| +5 Volts monitor |  |
| Veto Counter | 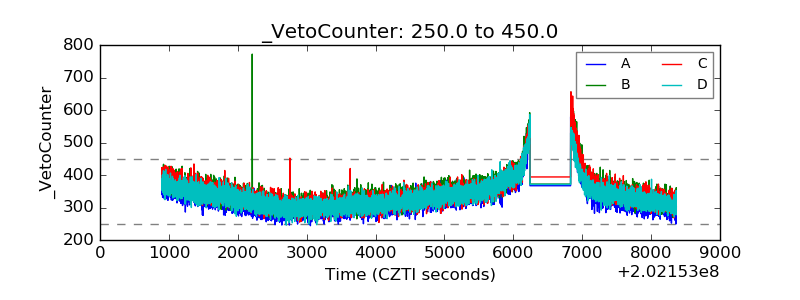 |