| Param | Original file | Final file |
|---|---|---|
| Filename | modeM0/AS1G05_234T02_9000000474_03608cztM0_level2.evt | modeM0/AS1G05_234T02_9000000474_03608cztM0_level2_quad_clean.evt |
| Size (bytes) | 570,576,960 | 92,088,000 |
| Size | 544.1 MB | 87.8 MB |
| Events in quadrant A | 3,363,706 | 571,748 |
| Events in quadrant B | 4,138,472 | 571,740 |
| Events in quadrant C | 5,939,348 | 565,315 |
| Events in quadrant D | 3,330,449 | 558,890 |
| Mode M9 | |||
|---|---|---|---|
| Quadrant | BADHDUFLAG | Total packets | Discarded packets |
| A | 0 | 2 | 0 |
| B | 0 | 2 | 0 |
| C | 0 | 2 | 0 |
| D | 0 | 3 | 0 |
| Mode SS | |||
|---|---|---|---|
| Quadrant | BADHDUFLAG | Total packets | Discarded packets |
| A | 0 | 152 | 0 |
| B | 0 | 152 | 0 |
| C | 0 | 152 | 0 |
| D | 0 | 152 | 0 |
| Mode M0 | |||
|---|---|---|---|
| Quadrant | BADHDUFLAG | Total packets | Discarded packets |
| A | 0 | 15575 | 3 |
| B | 0 | 17528 | 2 |
| C | 0 | 22737 | 2 |
| D | 0 | 15731 | 2 |
| Quadrant | Total seconds | Saturated seconds | Saturation percentage |
|---|---|---|---|
| A | 7485 | 39 | 0.521042% |
| B | 7485 | 120 | 1.603206% |
| C | 7485 | 706 | 9.432198% |
| D | 7485 | 38 | 0.507682% |
Noise dominated data is calculated using 1-second bins in cleaned event files. If a bin has >2000 counts, and if more than 50% of those come from <1% of pixels, then it is considered to be noise-dominated and hence unusable.
| Quadrant | # 1 sec bins | Bins with >0 counts | Bins with >2000 counts | High rate bins dominated by noise | Noise dominated (total time) | Noise dominated (detector-on time) | Marked lightcurve |
|---|---|---|---|---|---|---|---|
| A | 7750 | 7486 | 2 | 2 | 0.03% | 0.03% | 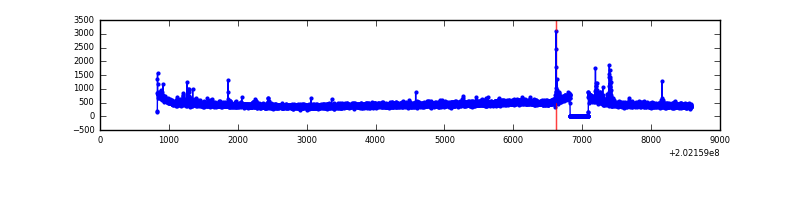 |
| B | 7750 | 7486 | 8 | 8 | 0.10% | 0.11% | 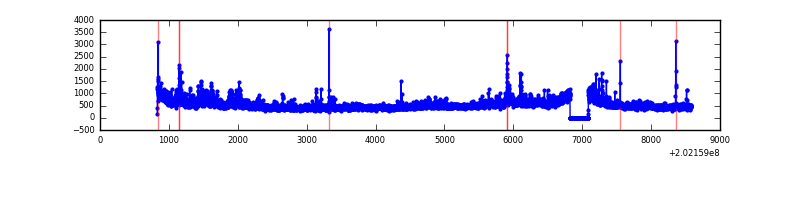 |
| C | 7750 | 7486 | 579 | 579 | 7.47% | 7.73% | 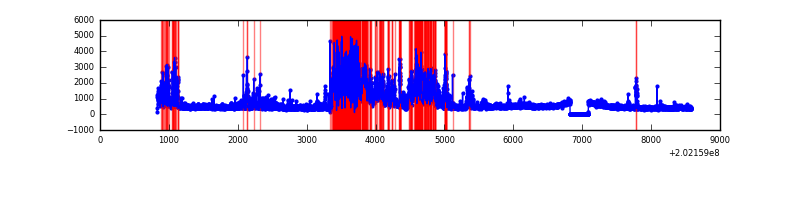 |
| D | 7750 | 7486 | 23 | 23 | 0.30% | 0.31% | 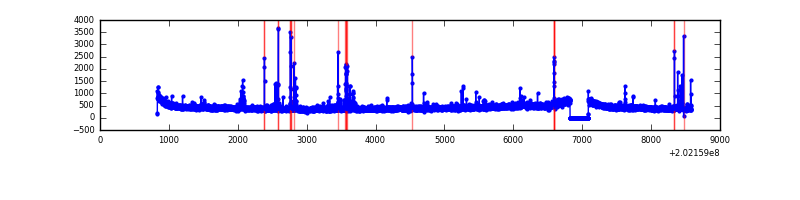 |
Top three noisy pixels from each quadrant. If the there are fewer than three noisy pixels in the level2.evt file, extra rows are filled as -1
| Pixel properties | Quadrant properties | ||||||
|---|---|---|---|---|---|---|---|
| Quadrant | DetID | PixID | Counts | Sigma | Mean | Median | Sigma |
| A | 0 | 31 | 49753 | 277.81 | 846 | 825 | 176.1 |
| A | 8 | 15 | 19526 | 106.18 | 846 | 825 | 176.1 |
| A | 7 | 16 | 17197 | 92.96 | 846 | 825 | 176.1 |
| B | 15 | 204 | 565444 | 3384.49 | 859 | 837 | 166.8 |
| B | 4 | 81 | 97663 | 580.42 | 859 | 837 | 166.8 |
| B | 15 | 54 | 57330 | 338.64 | 859 | 837 | 166.8 |
| C | 2 | 53 | 2624246 | 13946.66 | 805 | 807 | 188.1 |
| C | 9 | 247 | 105727 | 557.77 | 805 | 807 | 188.1 |
| C | 7 | 189 | 27918 | 144.13 | 805 | 807 | 188.1 |
| D | 13 | 223 | 71436 | 350.12 | 828 | 800 | 201.7 |
| D | 2 | 14 | 39594 | 192.29 | 828 | 800 | 201.7 |
| D | 5 | 233 | 26753 | 128.64 | 828 | 800 | 201.7 |
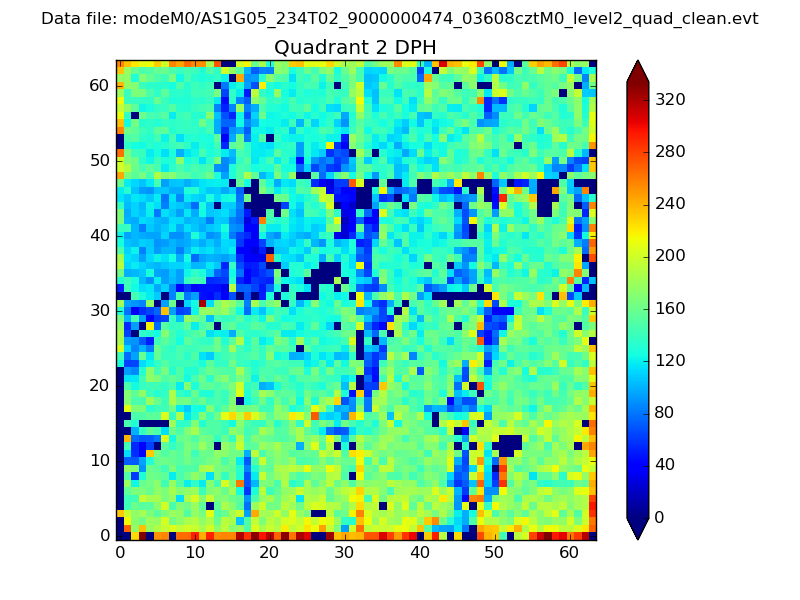
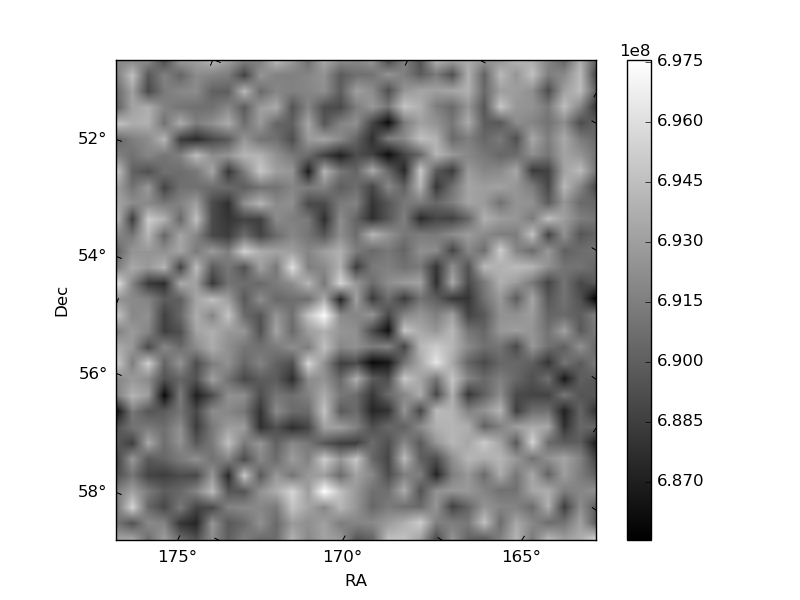
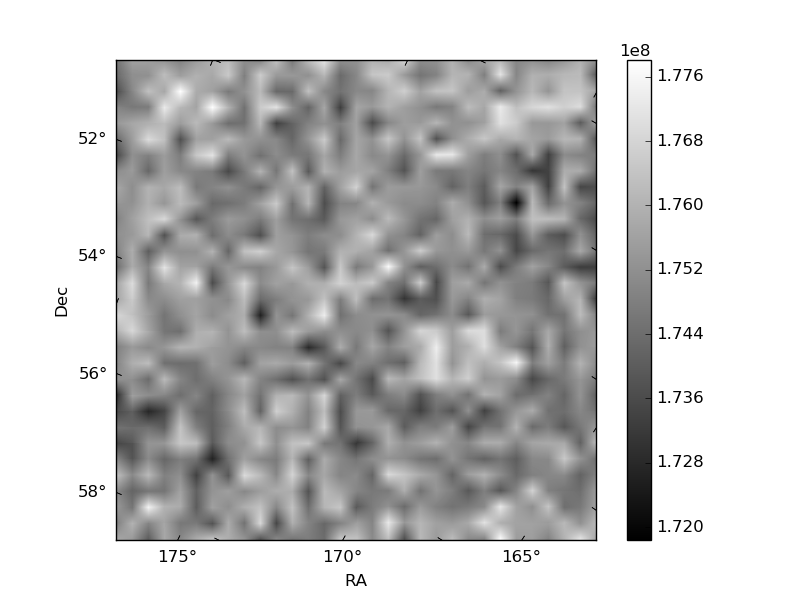
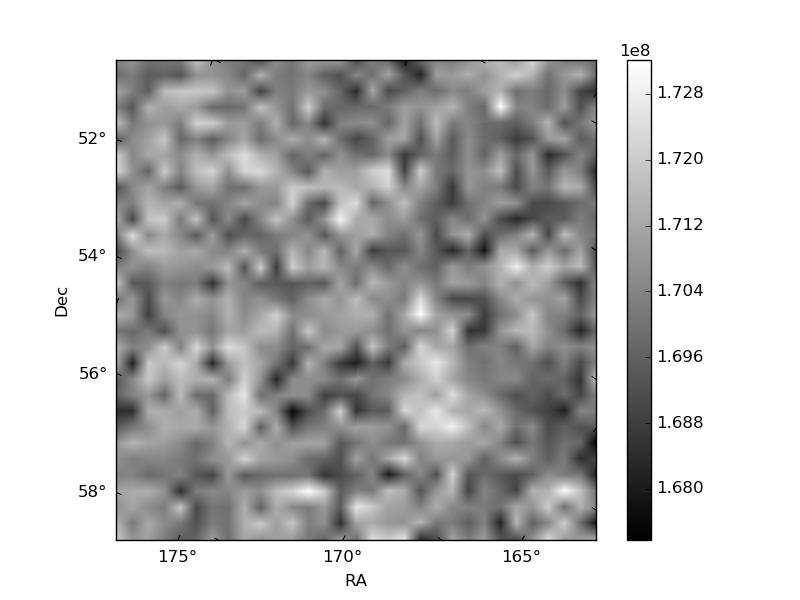
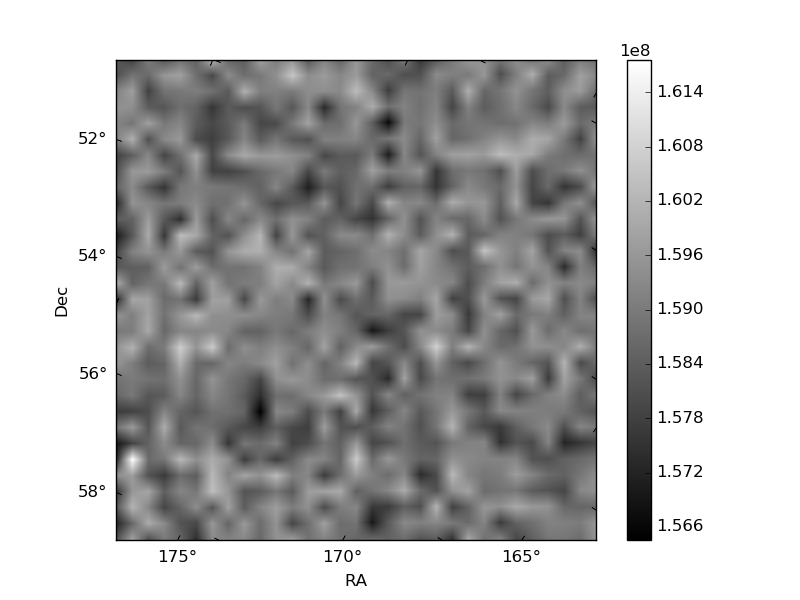
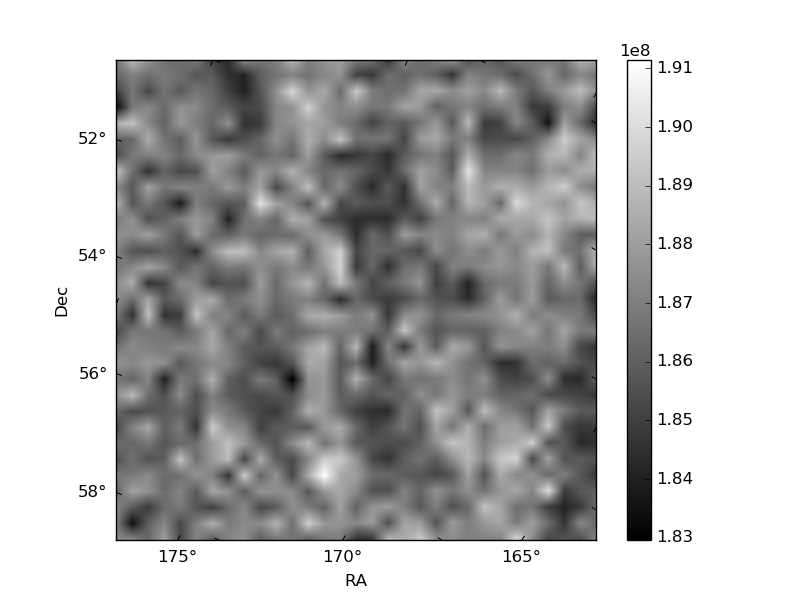
Histogram calculated using DETX and DETY for each event in the final _common_clean file
| Quadrant A | 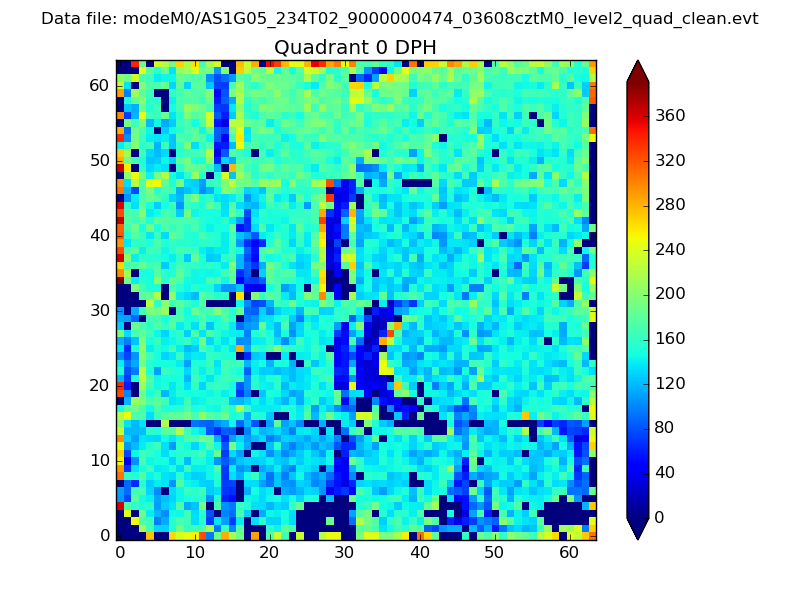 |
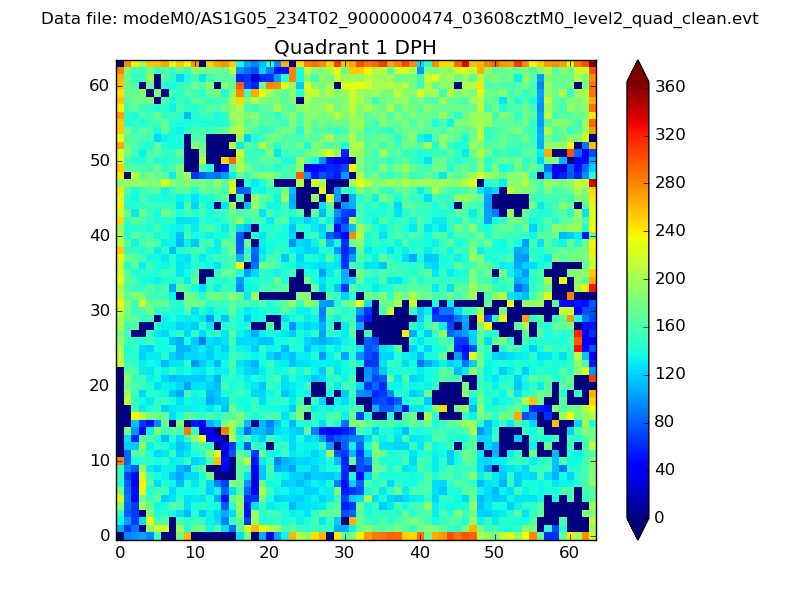 |
Quadrant B |
|---|---|---|---|
| Quadrant D | 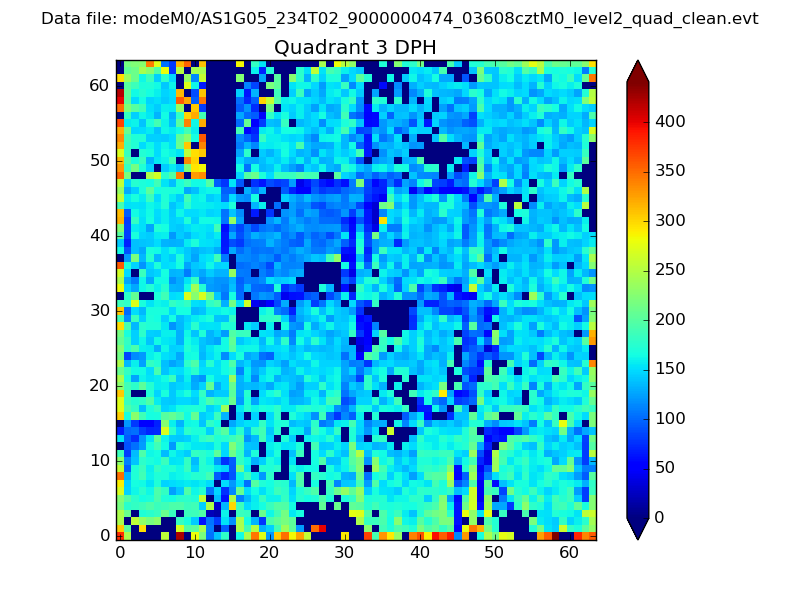 |
 |
Quadrant C |
| Plot type | Count rate plots | Images |
|---|---|---|
| Comparison with Poisson distribution Blue bars denote a histogram of data divided into 1 sec bins. Red curve is a Poisson curve with rate = median count rate of data. |
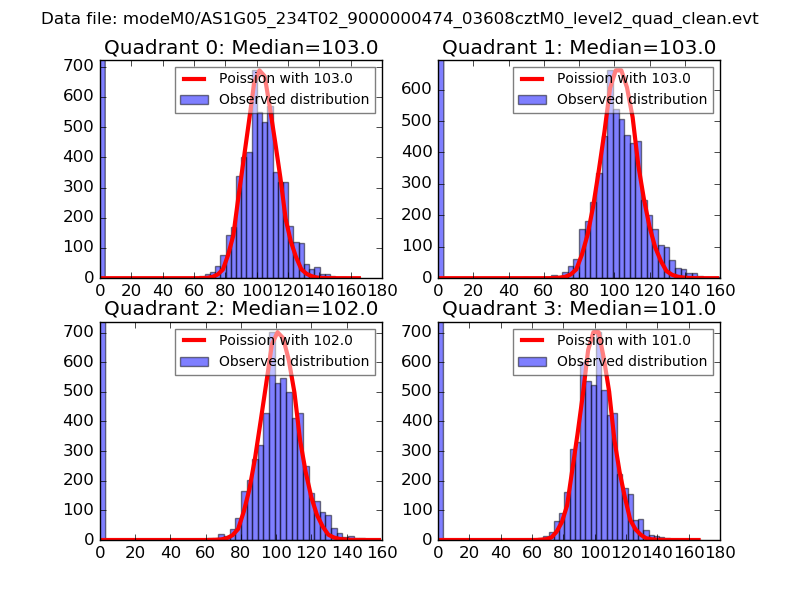 |
 |
| Quadrant-wise count rates Data is divided into 100 sec bins |
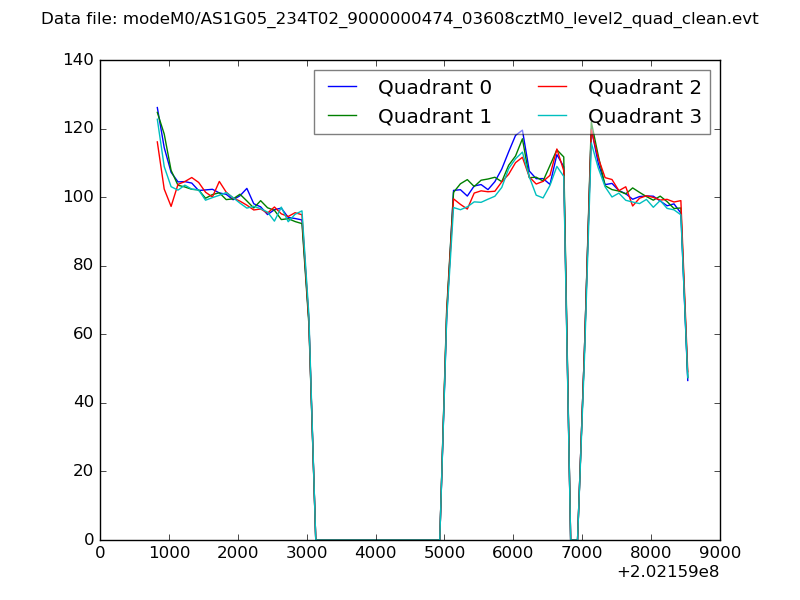 |
|
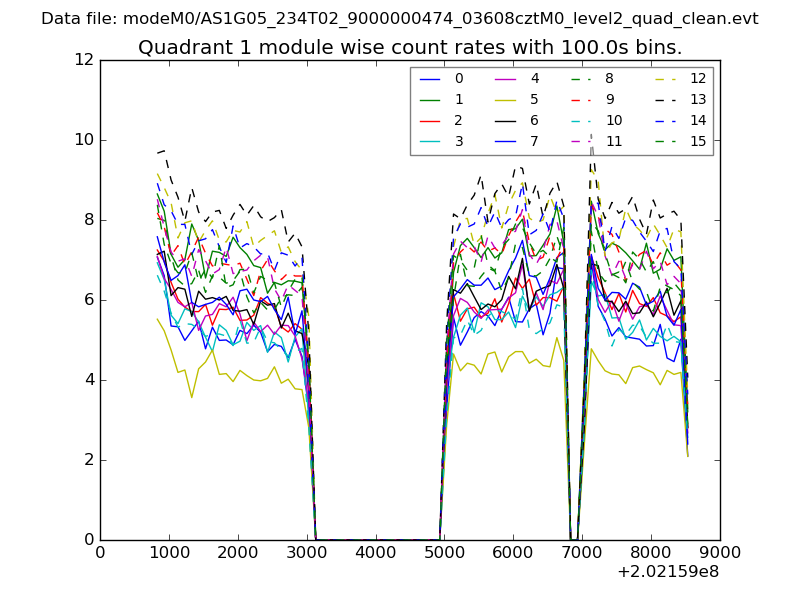
| Module-wise count rates for Quadrant A Data is divided into 100 sec bins |
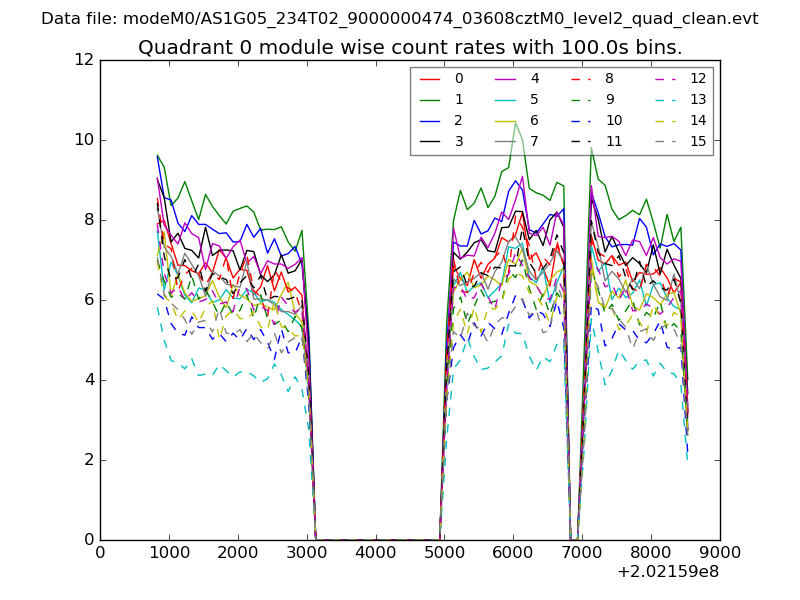 |
 |
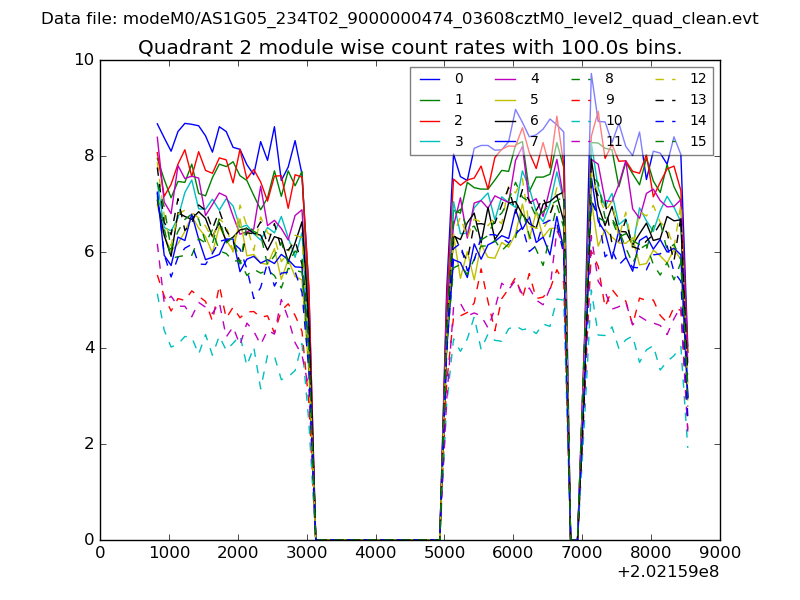
| Module-wise count rates for Quadrant B Data is divided into 100 sec bins |
 |
 |
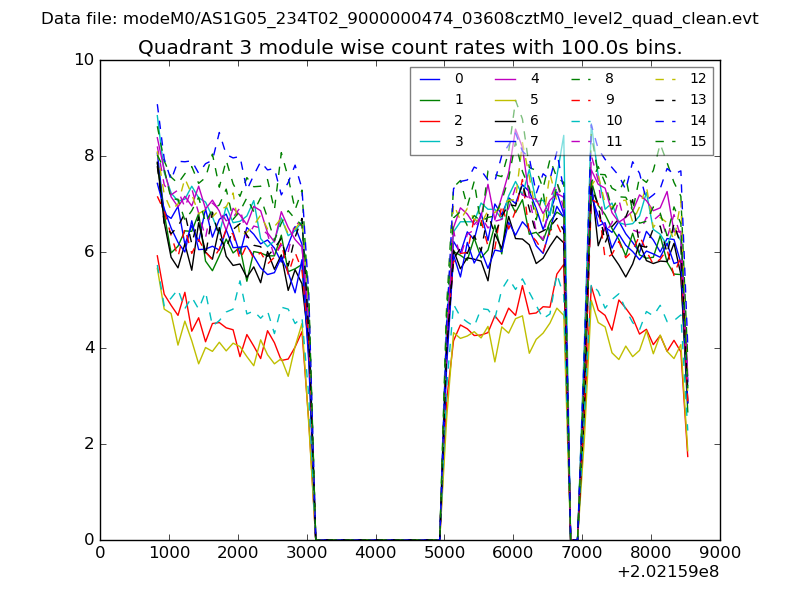
| Module-wise count rates for Quadrant C Data is divided into 100 sec bins |
 |
 |
| Module-wise count rates for Quadrant D Data is divided into 100 sec bins |
 |
 |
| Parameter | Plot |
|---|---|
| CZT HV Monitor | 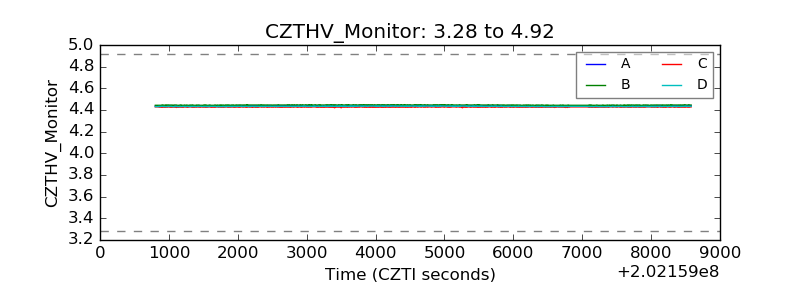 |
| D_VDD | 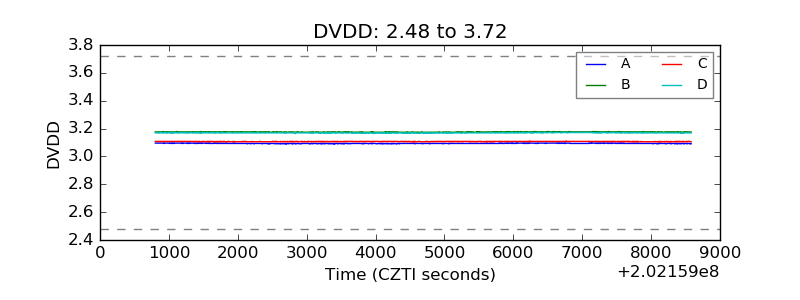 |
| Temperature 1 | 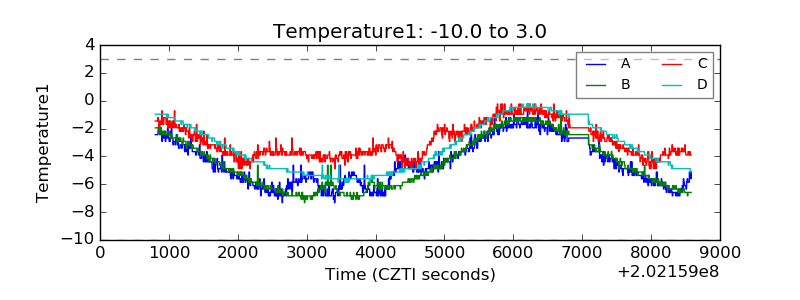 |
| Veto HV Monitor | 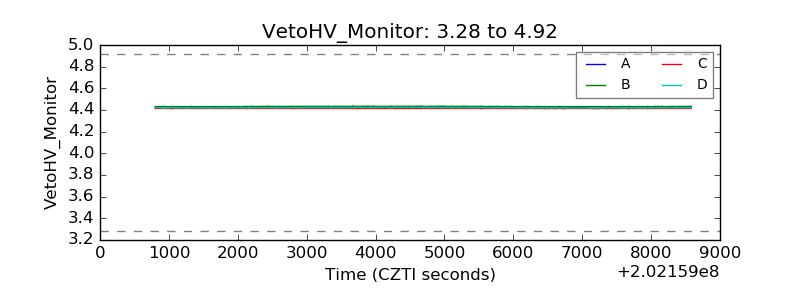 |
| Veto LLD | 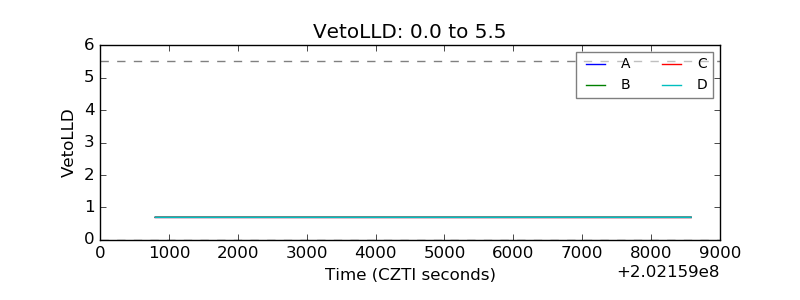 |
| Alpha Counter | 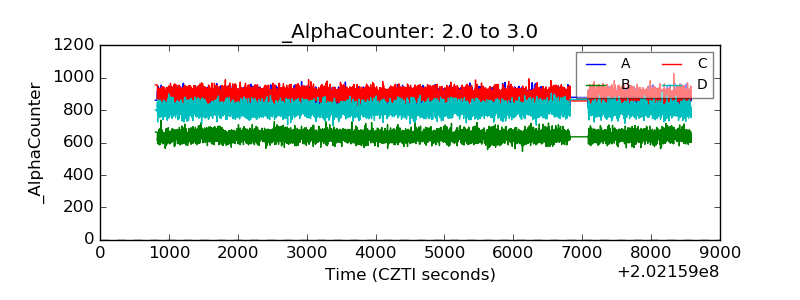 |
| _CPM_Rate | 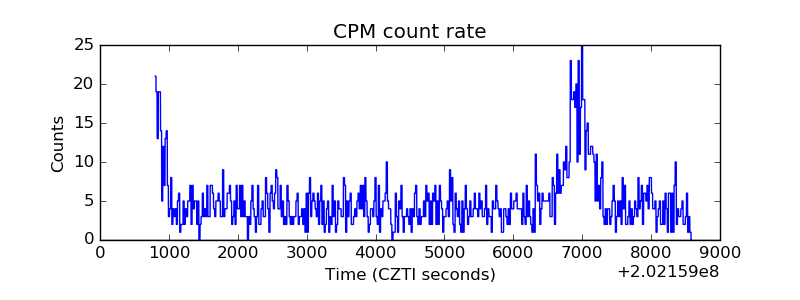 |
| CZT Counter | 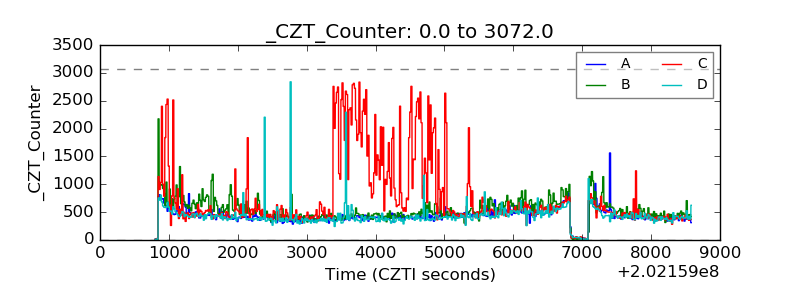 |
| +2.5 Volts monitor |  |
| +5 Volts monitor |  |
| Veto Counter | 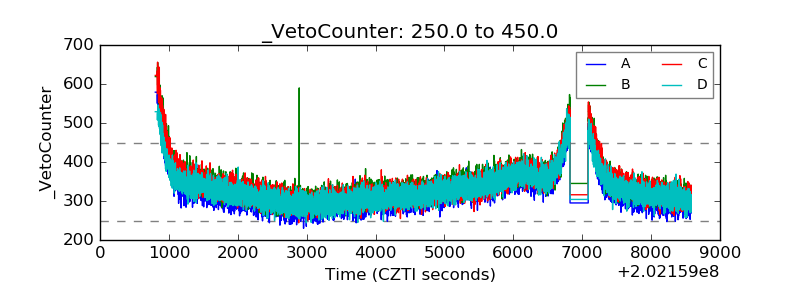 |