| Param | Original file | Final file |
|---|---|---|
| Filename | modeM0/AS1G05_234T02_9000000474_03609cztM0_level2.evt | modeM0/AS1G05_234T02_9000000474_03609cztM0_level2_quad_clean.evt |
| Size (bytes) | 591,177,600 | 98,242,560 |
| Size | 563.8 MB | 93.7 MB |
| Events in quadrant A | 3,618,267 | 614,321 |
| Events in quadrant B | 4,451,388 | 613,875 |
| Events in quadrant C | 5,665,374 | 596,009 |
| Events in quadrant D | 3,626,081 | 594,521 |
| Mode M9 | |||
|---|---|---|---|
| Quadrant | BADHDUFLAG | Total packets | Discarded packets |
| A | 0 | 5 | 0 |
| B | 0 | 5 | 0 |
| C | 0 | 5 | 0 |
| D | 0 | 5 | 0 |
| Mode SS | |||
|---|---|---|---|
| Quadrant | BADHDUFLAG | Total packets | Discarded packets |
| A | 0 | 164 | 0 |
| B | 0 | 164 | 0 |
| C | 0 | 164 | 0 |
| D | 0 | 164 | 0 |
| Mode M0 | |||
|---|---|---|---|
| Quadrant | BADHDUFLAG | Total packets | Discarded packets |
| A | 0 | 16634 | 3 |
| B | 0 | 18765 | 2 |
| C | 0 | 22629 | 2 |
| D | 0 | 16918 | 2 |
| Quadrant | Total seconds | Saturated seconds | Saturation percentage |
|---|---|---|---|
| A | 8002 | 28 | 0.349913% |
| B | 8002 | 148 | 1.849538% |
| C | 8002 | 540 | 6.748313% |
| D | 8002 | 47 | 0.587353% |
Noise dominated data is calculated using 1-second bins in cleaned event files. If a bin has >2000 counts, and if more than 50% of those come from <1% of pixels, then it is considered to be noise-dominated and hence unusable.
| Quadrant | # 1 sec bins | Bins with >0 counts | Bins with >2000 counts | High rate bins dominated by noise | Noise dominated (total time) | Noise dominated (detector-on time) | Marked lightcurve |
|---|---|---|---|---|---|---|---|
| A | 8527 | 8004 | 2 | 2 | 0.02% | 0.02% | 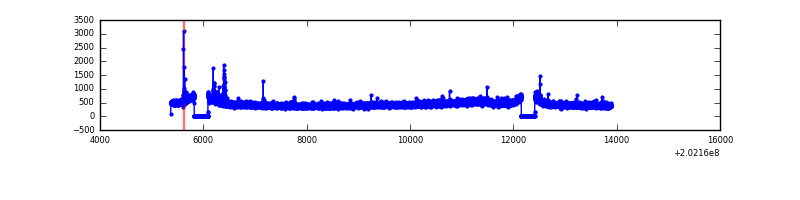 |
| B | 8526 | 8003 | 54 | 54 | 0.63% | 0.67% | 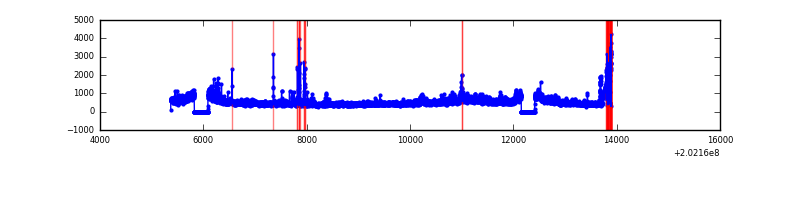 |
| C | 8527 | 8004 | 378 | 378 | 4.43% | 4.72% | 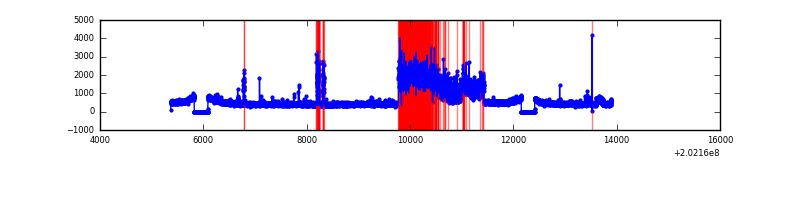 |
| D | 8527 | 8004 | 24 | 24 | 0.28% | 0.30% | 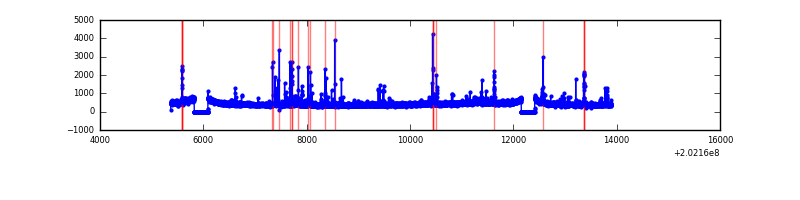 |
Top three noisy pixels from each quadrant. If the there are fewer than three noisy pixels in the level2.evt file, extra rows are filled as -1
| Pixel properties | Quadrant properties | ||||||
|---|---|---|---|---|---|---|---|
| Quadrant | DetID | PixID | Counts | Sigma | Mean | Median | Sigma |
| A | 0 | 31 | 56063 | 293.83 | 908 | 885 | 187.8 |
| A | 8 | 15 | 33165 | 171.9 | 908 | 885 | 187.8 |
| A | 0 | 226 | 9644 | 46.64 | 908 | 885 | 187.8 |
| B | 15 | 204 | 476819 | 2645.84 | 922 | 896 | 179.9 |
| B | 5 | 172 | 210609 | 1165.87 | 922 | 896 | 179.9 |
| B | 4 | 81 | 91388 | 503.08 | 922 | 896 | 179.9 |
| C | 2 | 53 | 2117602 | 10272.82 | 882 | 884 | 206.1 |
| C | 9 | 247 | 47413 | 225.81 | 882 | 884 | 206.1 |
| C | 7 | 189 | 28114 | 132.15 | 882 | 884 | 206.1 |
| D | 13 | 223 | 72376 | 329.76 | 890 | 861 | 216.9 |
| D | 4 | 160 | 41612 | 187.91 | 890 | 861 | 216.9 |
| D | 2 | 14 | 36556 | 164.59 | 890 | 861 | 216.9 |
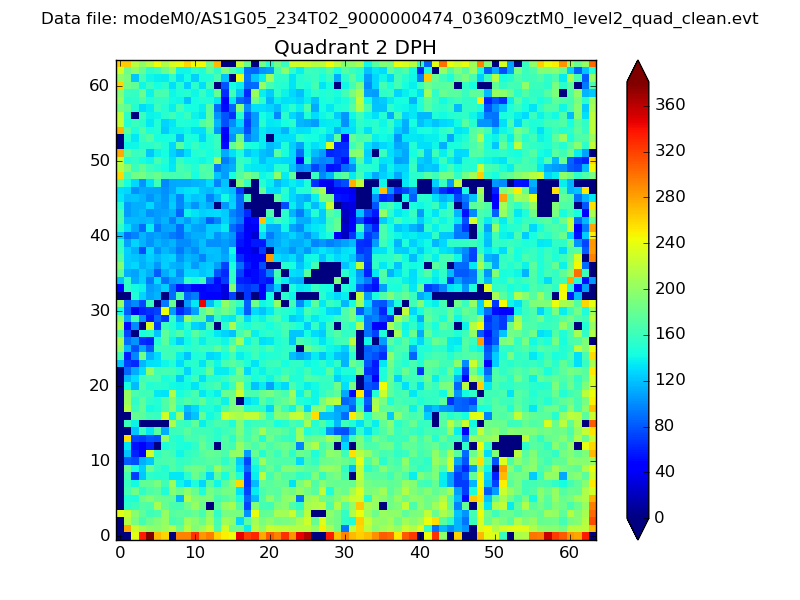
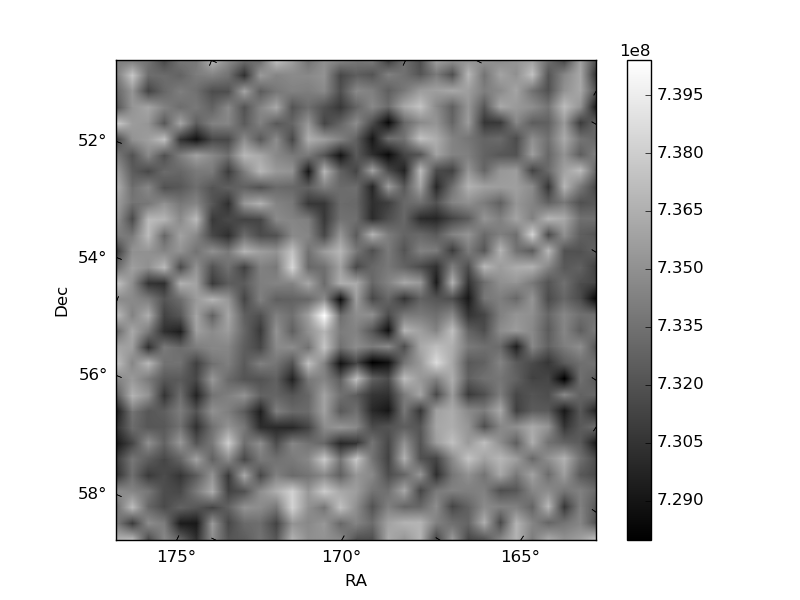
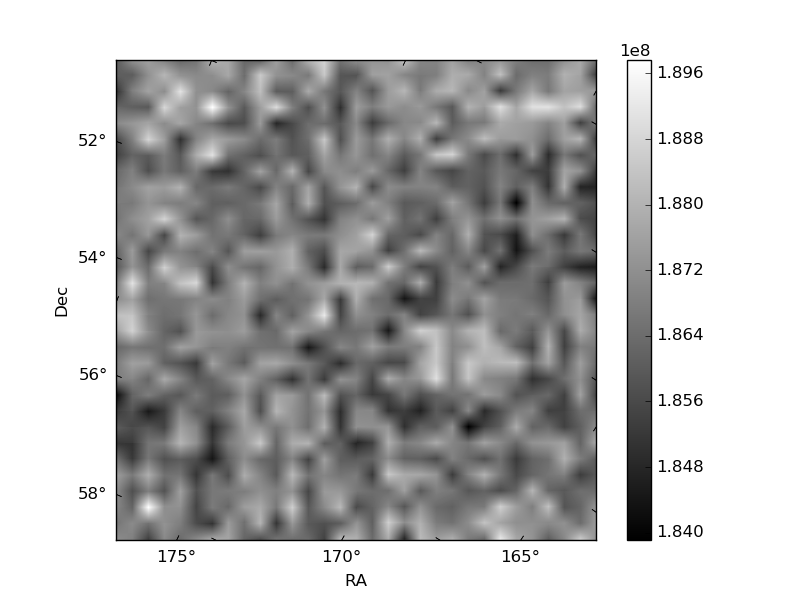
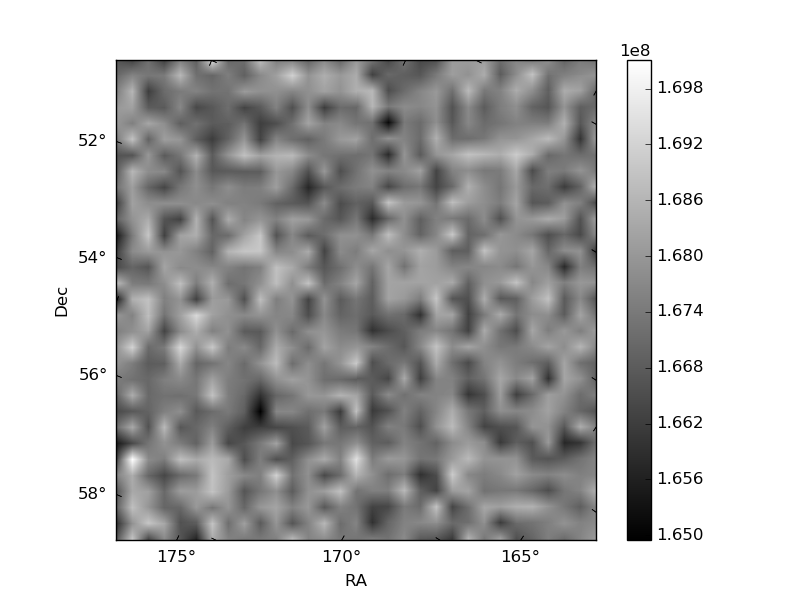
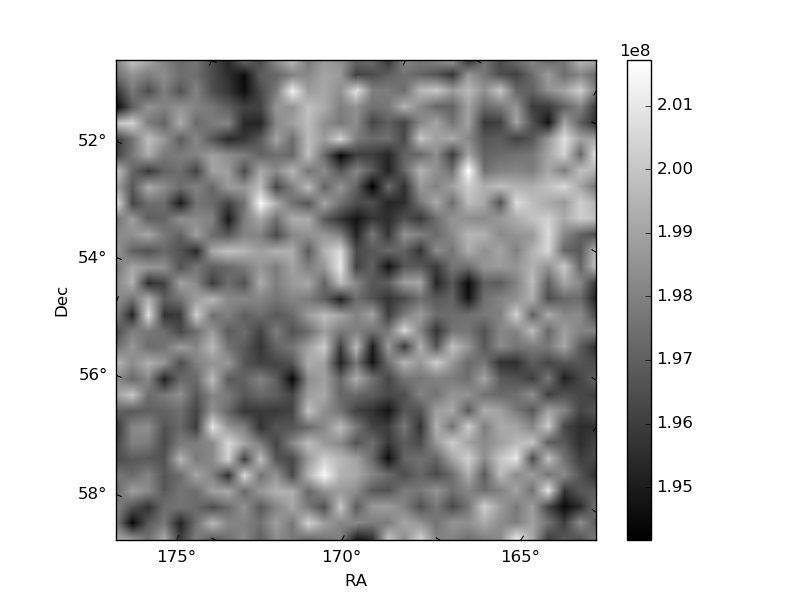
Histogram calculated using DETX and DETY for each event in the final _common_clean file
| Quadrant A | 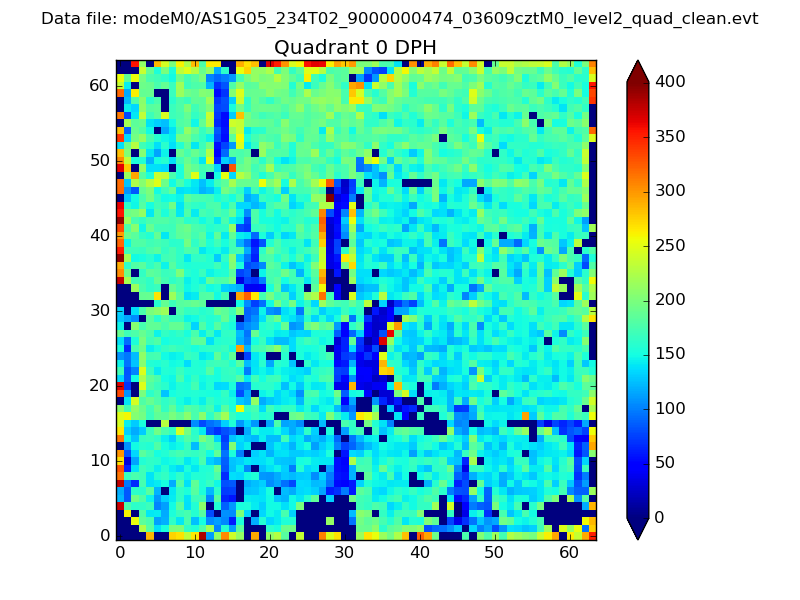 |
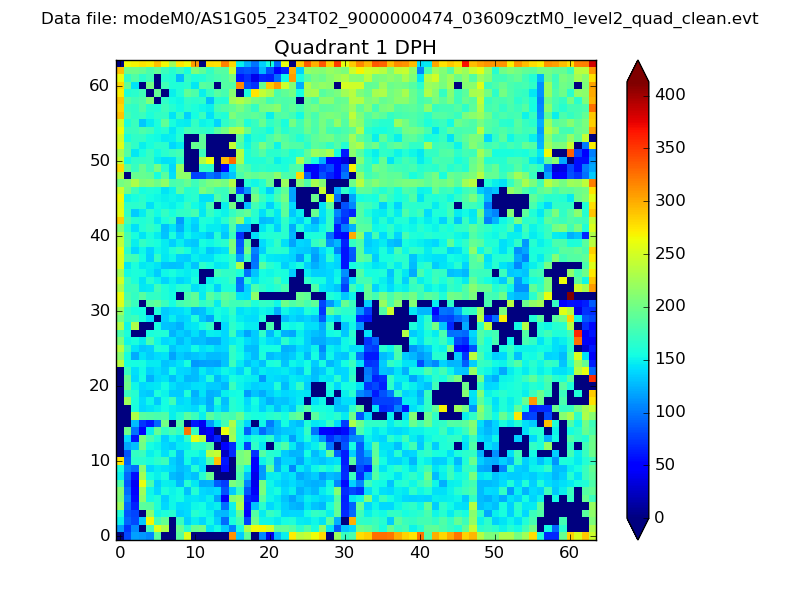 |
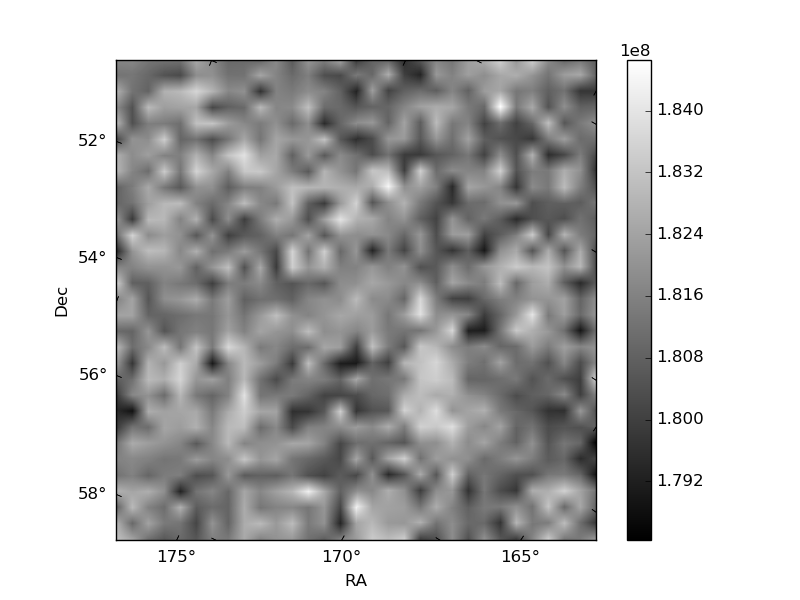
Quadrant B |
|---|---|---|---|
| Quadrant D | 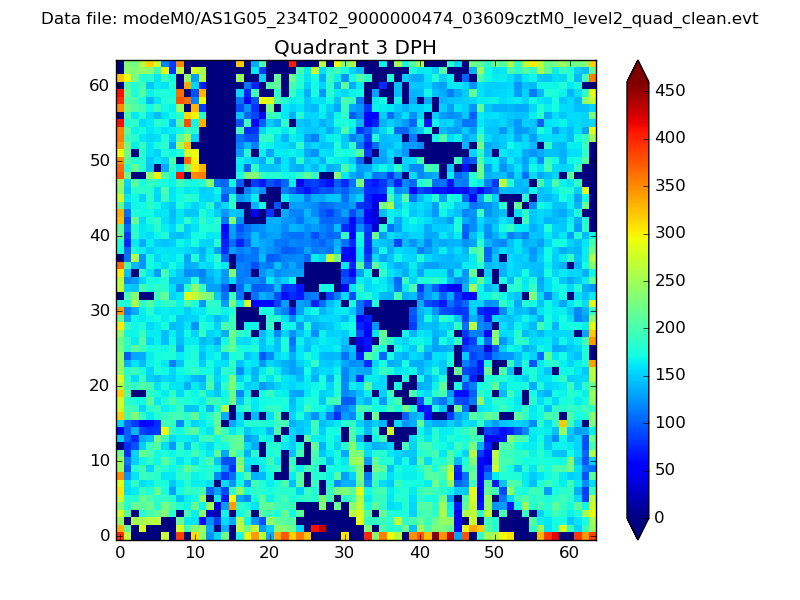 |
 |
Quadrant C |
| Plot type | Count rate plots | Images |
|---|---|---|
| Comparison with Poisson distribution Blue bars denote a histogram of data divided into 1 sec bins. Red curve is a Poisson curve with rate = median count rate of data. |
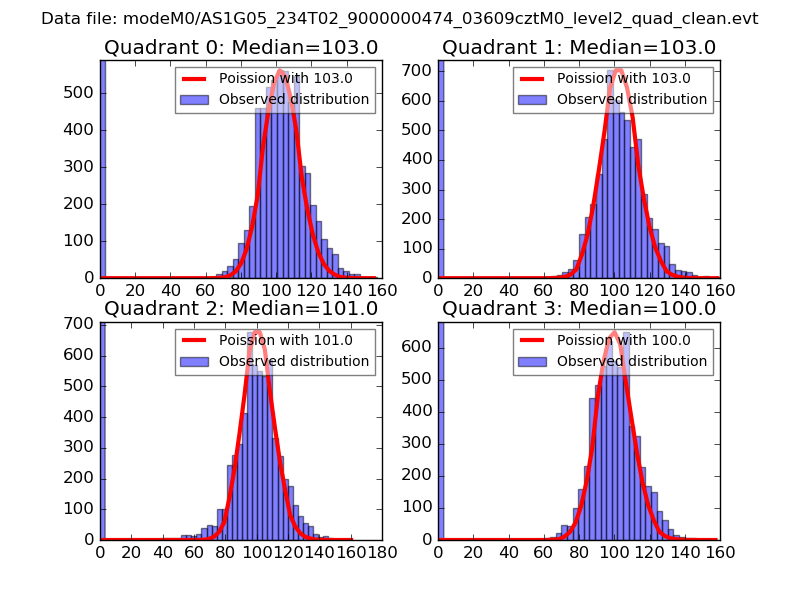 |
 |
| Quadrant-wise count rates Data is divided into 100 sec bins |
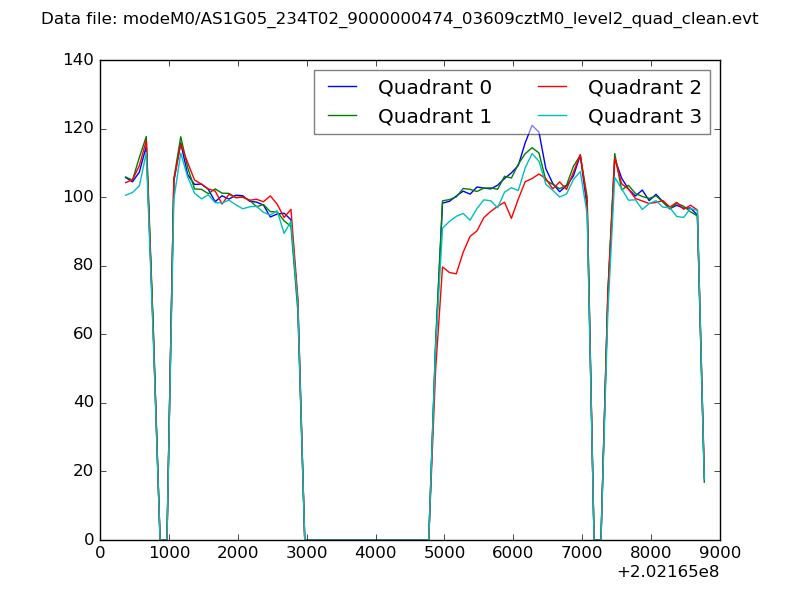 |
|
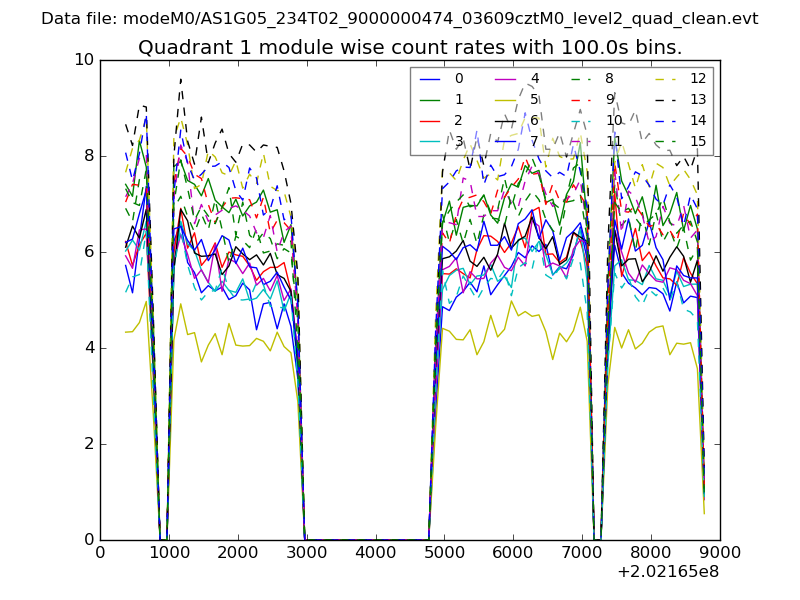
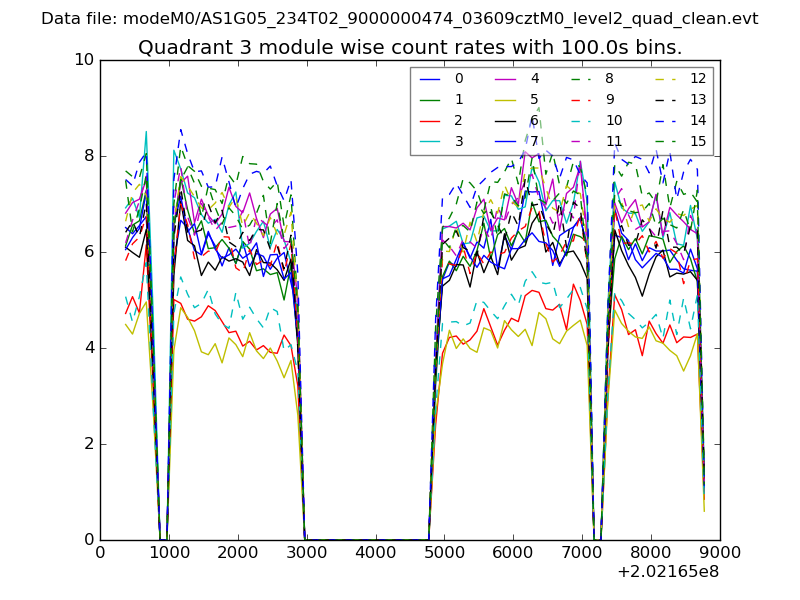
| Module-wise count rates for Quadrant A Data is divided into 100 sec bins |
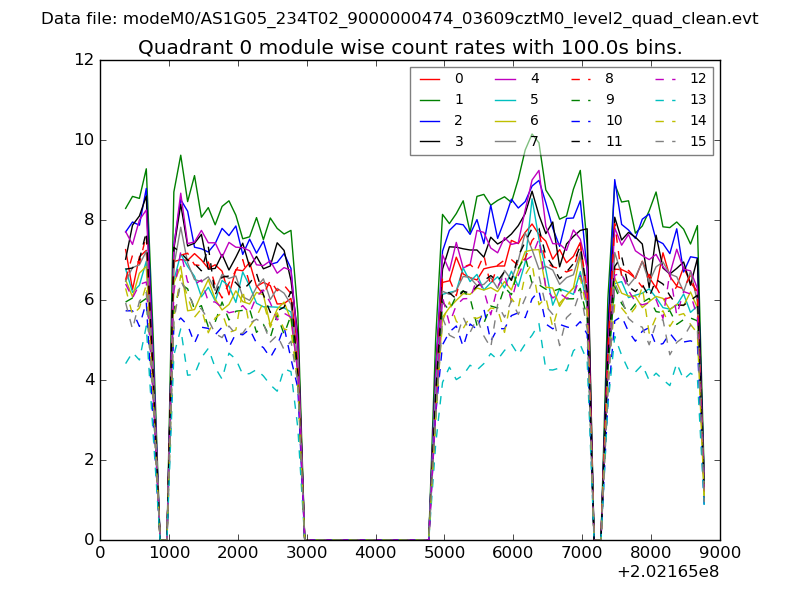 |
 |
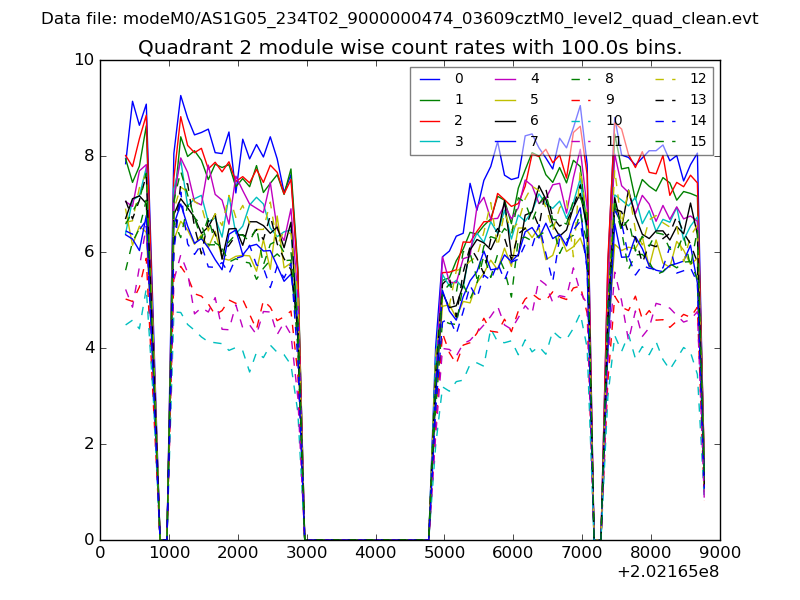
| Module-wise count rates for Quadrant B Data is divided into 100 sec bins |
 |
 |
| Module-wise count rates for Quadrant C Data is divided into 100 sec bins |
 |
 |
| Module-wise count rates for Quadrant D Data is divided into 100 sec bins |
 |
 |
| Parameter | Plot |
|---|---|
| CZT HV Monitor | 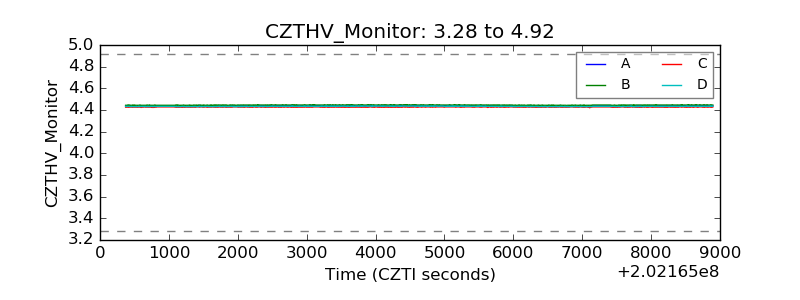 |
| D_VDD | 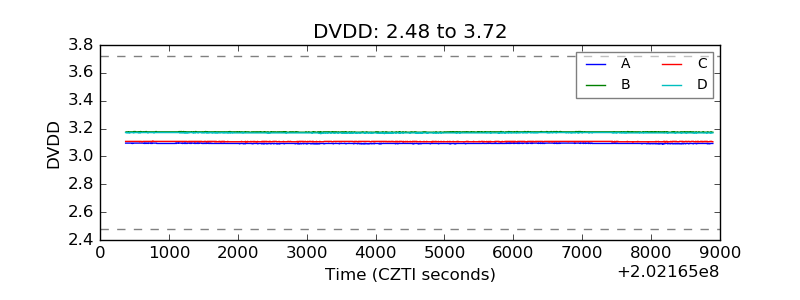 |
| Temperature 1 | 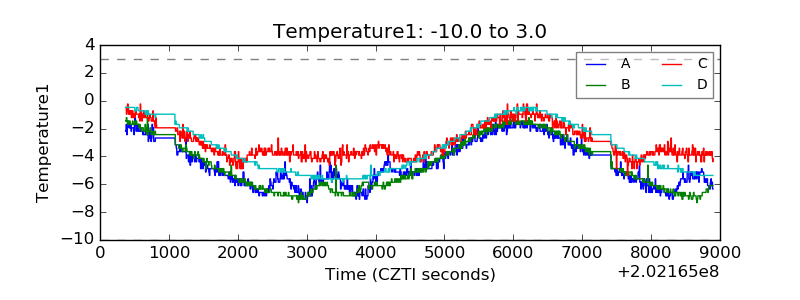 |
| Veto HV Monitor | 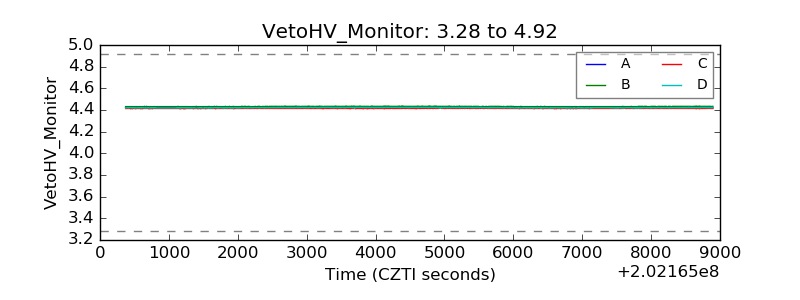 |
| Veto LLD | 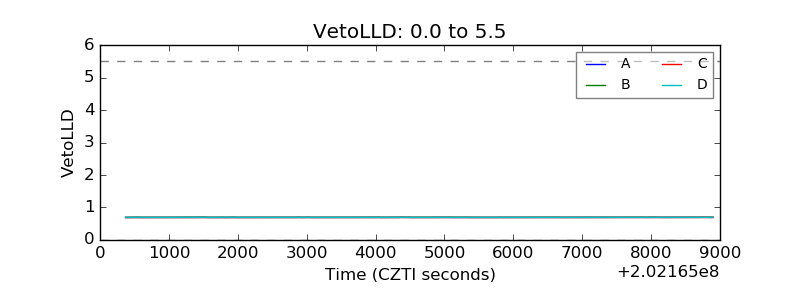 |
| Alpha Counter | 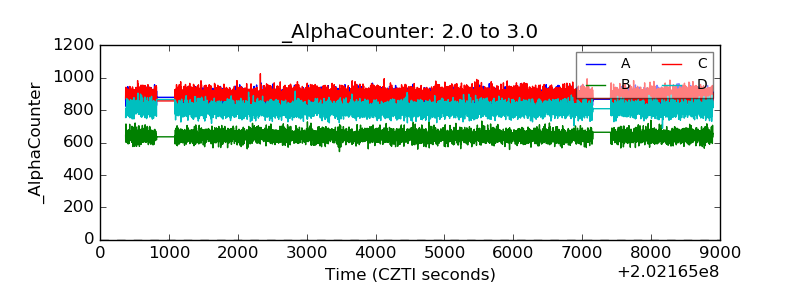 |
| _CPM_Rate | 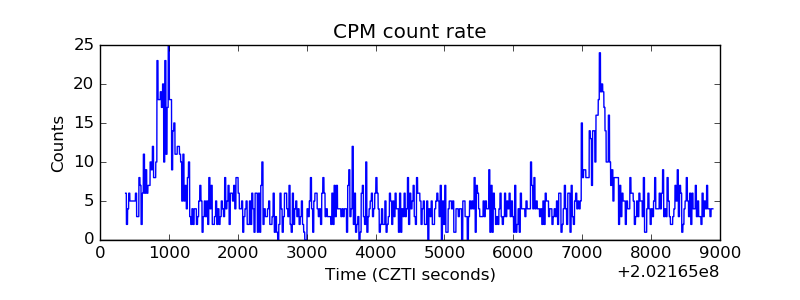 |
| CZT Counter | 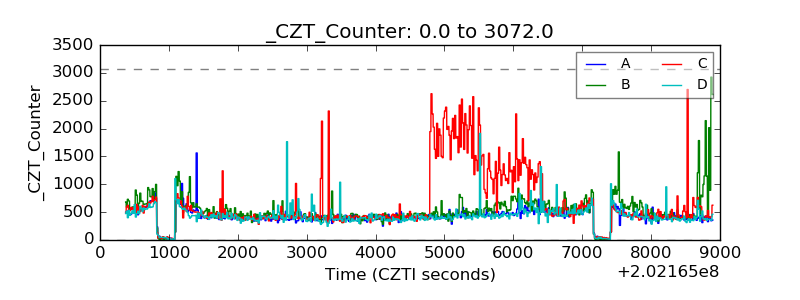 |
| +2.5 Volts monitor |  |
| +5 Volts monitor | 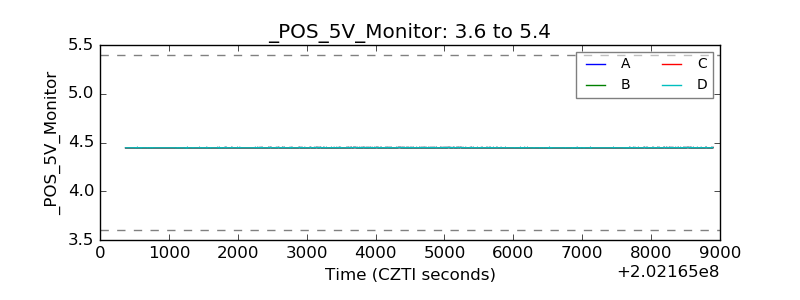 |
| Veto Counter | 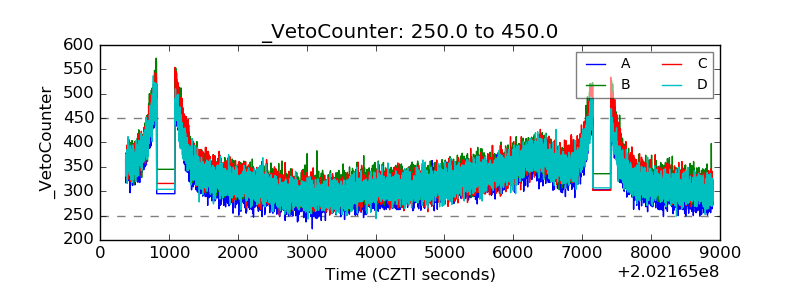 |