| Param | Original file | Final file |
|---|---|---|
| Filename | modeM0/AS1G05_234T02_9000000474_03612cztM0_level2.evt | modeM0/AS1G05_234T02_9000000474_03612cztM0_level2_quad_clean.evt |
| Size (bytes) | 1,461,801,600 | 197,694,720 |
| Size | 1.4 GB | 188.5 MB |
| Events in quadrant A | 8,559,594 | 1,184,428 |
| Events in quadrant B | 10,503,362 | 1,186,094 |
| Events in quadrant C | 15,108,220 | 1,147,761 |
| Events in quadrant D | 8,807,578 | 1,150,198 |
| Mode M9 | |||
|---|---|---|---|
| Quadrant | BADHDUFLAG | Total packets | Discarded packets |
| A | 0 | 21 | 0 |
| B | 0 | 21 | 0 |
| C | 0 | 21 | 0 |
| D | 0 | 21 | 0 |
| Mode SS | |||
|---|---|---|---|
| Quadrant | BADHDUFLAG | Total packets | Discarded packets |
| A | 0 | 388 | 0 |
| B | 0 | 388 | 0 |
| C | 0 | 388 | 0 |
| D | 0 | 388 | 0 |
| Mode M0 | |||
|---|---|---|---|
| Quadrant | BADHDUFLAG | Total packets | Discarded packets |
| A | 0 | 39278 | 7 |
| B | 0 | 44258 | 4 |
| C | 0 | 58698 | 11 |
| D | 0 | 40453 | 4 |
| Quadrant | Total seconds | Saturated seconds | Saturation percentage |
|---|---|---|---|
| A | 19144 | 107 | 0.558922% |
| B | 19145 | 251 | 1.311047% |
| C | 19144 | 1379 | 7.203301% |
| D | 19145 | 117 | 0.611126% |
Noise dominated data is calculated using 1-second bins in cleaned event files. If a bin has >2000 counts, and if more than 50% of those come from <1% of pixels, then it is considered to be noise-dominated and hence unusable.
| Quadrant | # 1 sec bins | Bins with >0 counts | Bins with >2000 counts | High rate bins dominated by noise | Noise dominated (total time) | Noise dominated (detector-on time) | Marked lightcurve |
|---|---|---|---|---|---|---|---|
| A | 21100 | 19149 | 6 | 6 | 0.03% | 0.03% | 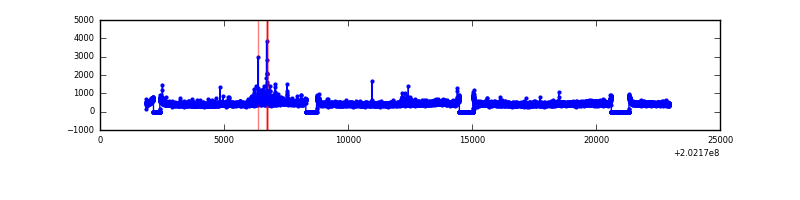 |
| B | 21100 | 19149 | 79 | 79 | 0.37% | 0.41% | 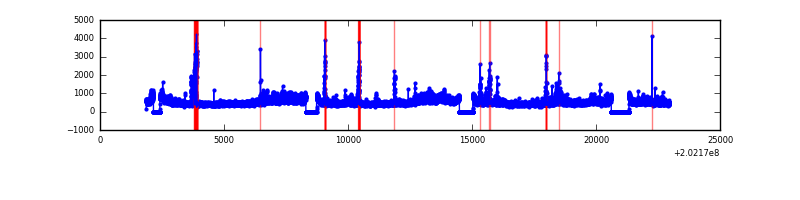 |
| C | 21100 | 19149 | 998 | 998 | 4.73% | 5.21% | 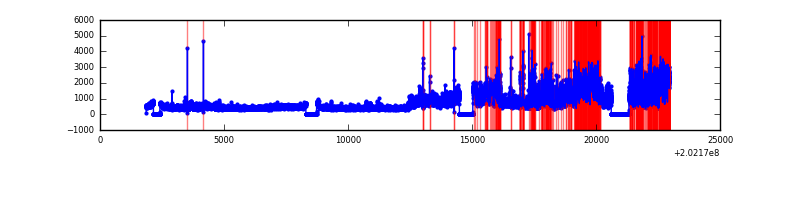 |
| D | 21100 | 19149 | 44 | 44 | 0.21% | 0.23% | 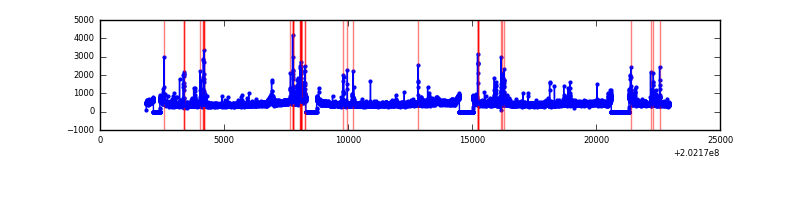 |
Top three noisy pixels from each quadrant. If the there are fewer than three noisy pixels in the level2.evt file, extra rows are filled as -1
| Pixel properties | Quadrant properties | ||||||
|---|---|---|---|---|---|---|---|
| Quadrant | DetID | PixID | Counts | Sigma | Mean | Median | Sigma |
| A | 14 | 238 | 133208 | 295.7 | 2152 | 2096 | 443.4 |
| A | 8 | 15 | 41426 | 88.7 | 2152 | 2096 | 443.4 |
| A | 15 | 174 | 24548 | 50.64 | 2152 | 2096 | 443.4 |
| B | 15 | 204 | 1175207 | 2797.58 | 2181 | 2123 | 419.3 |
| B | 5 | 172 | 464353 | 1102.33 | 2181 | 2123 | 419.3 |
| B | 14 | 167 | 267006 | 631.7 | 2181 | 2123 | 419.3 |
| C | 2 | 53 | 6865896 | 14287.18 | 2064 | 2072 | 480.4 |
| C | 9 | 247 | 105242 | 214.75 | 2064 | 2072 | 480.4 |
| C | 8 | 128 | 23587 | 44.78 | 2064 | 2072 | 480.4 |
| D | 8 | 195 | 408495 | 804.78 | 2097 | 2035 | 505.1 |
| D | 13 | 239 | 136917 | 267.06 | 2097 | 2035 | 505.1 |
| D | 1 | 193 | 120803 | 235.16 | 2097 | 2035 | 505.1 |
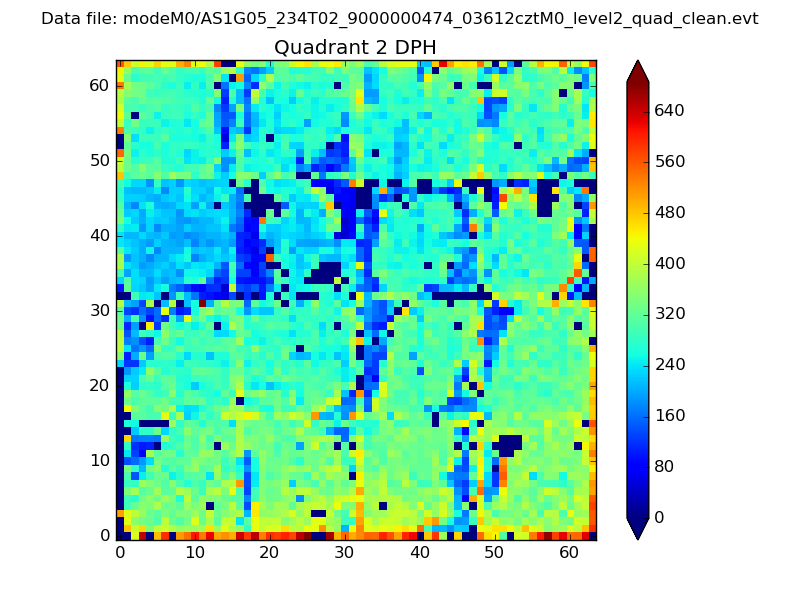
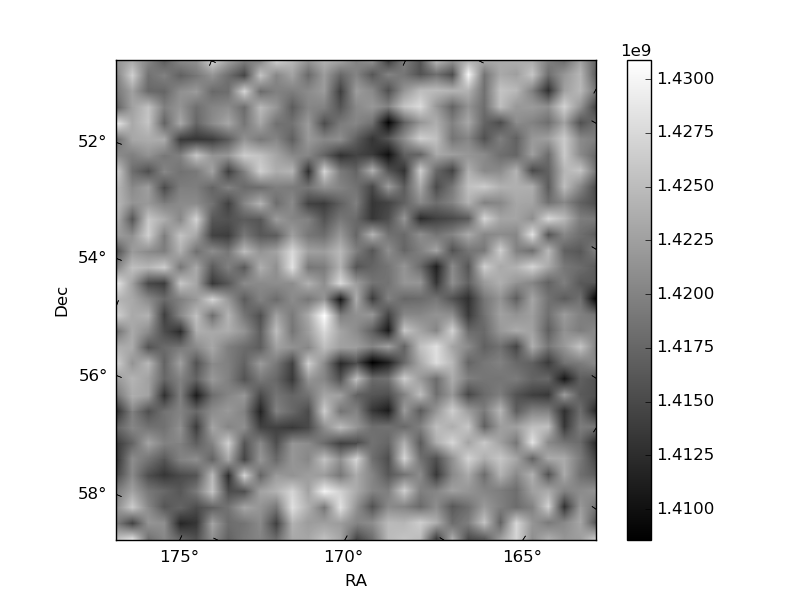
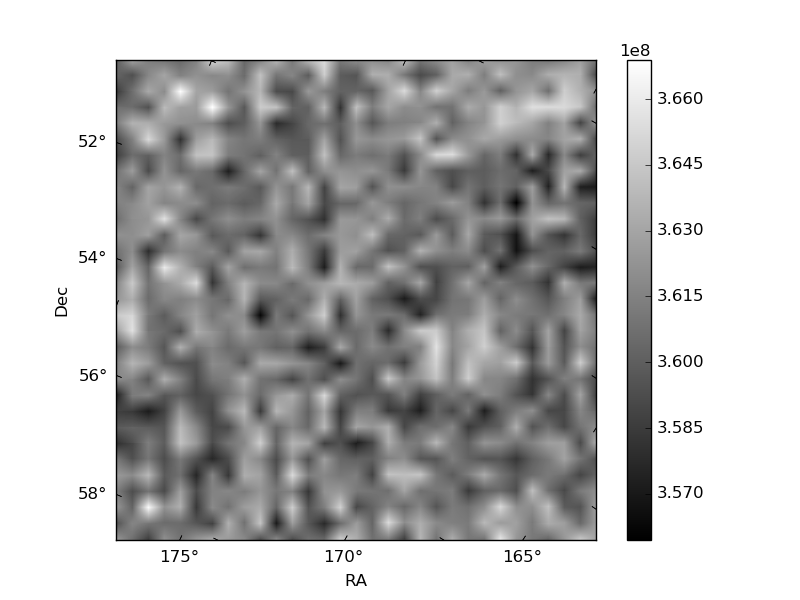
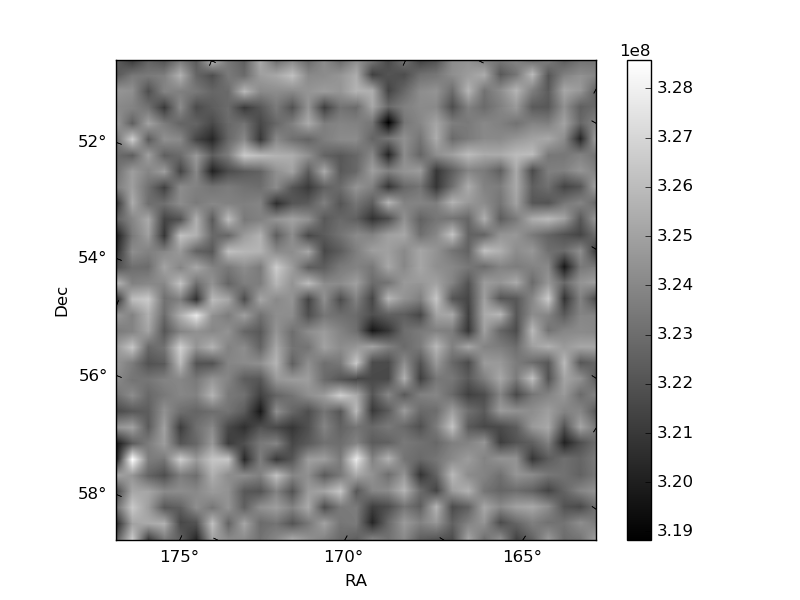
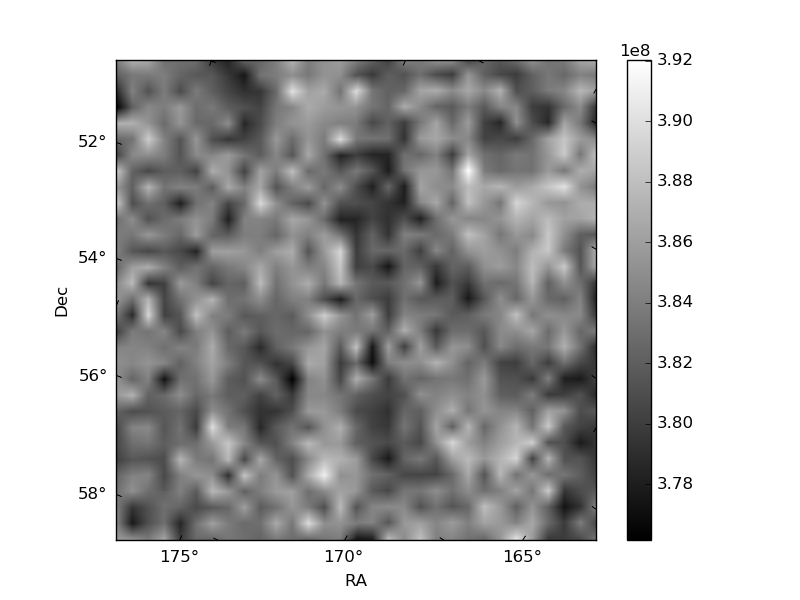
Histogram calculated using DETX and DETY for each event in the final _common_clean file
| Quadrant A | 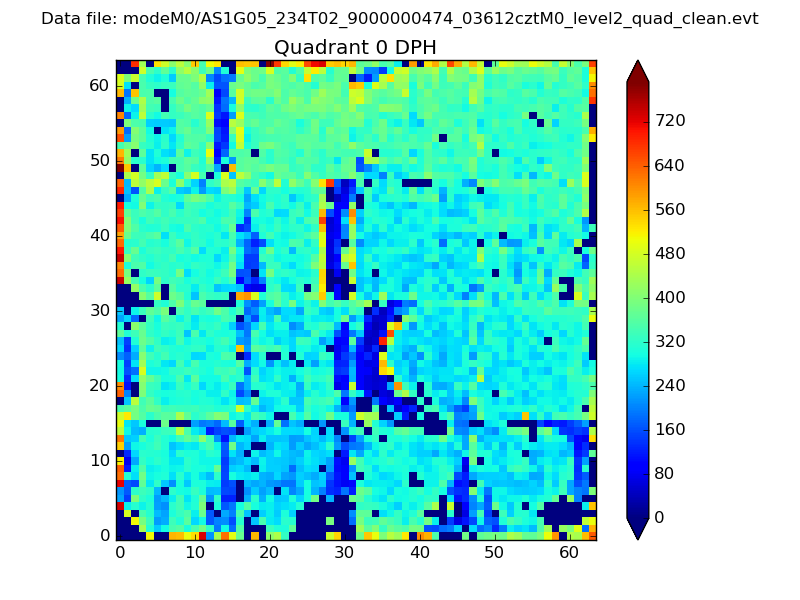 |
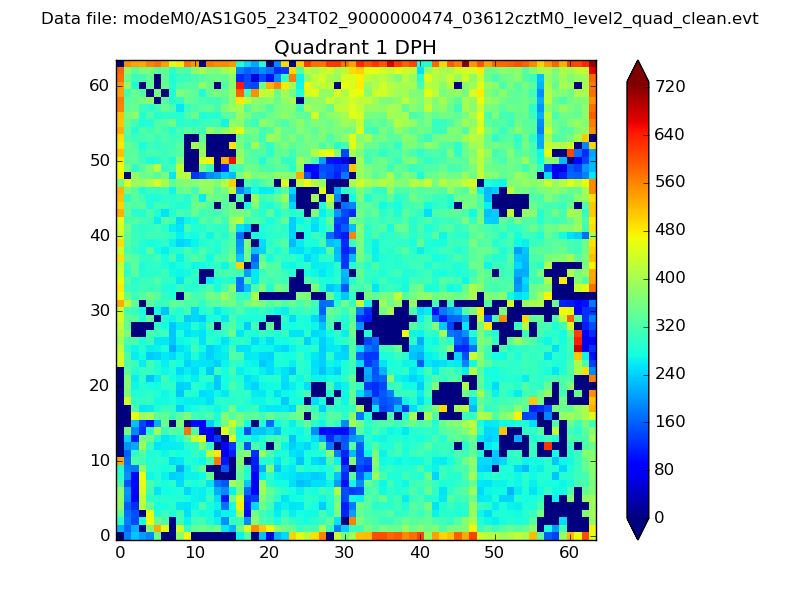 |
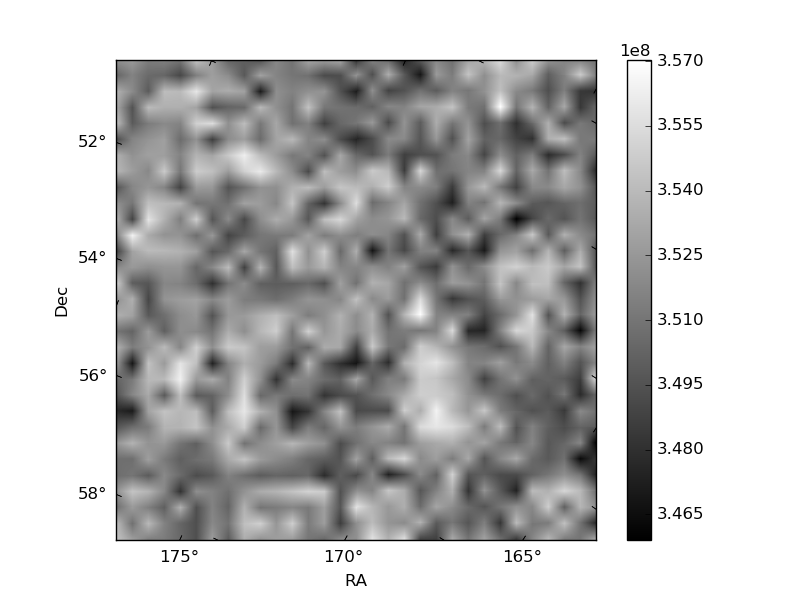
Quadrant B |
|---|---|---|---|
| Quadrant D | 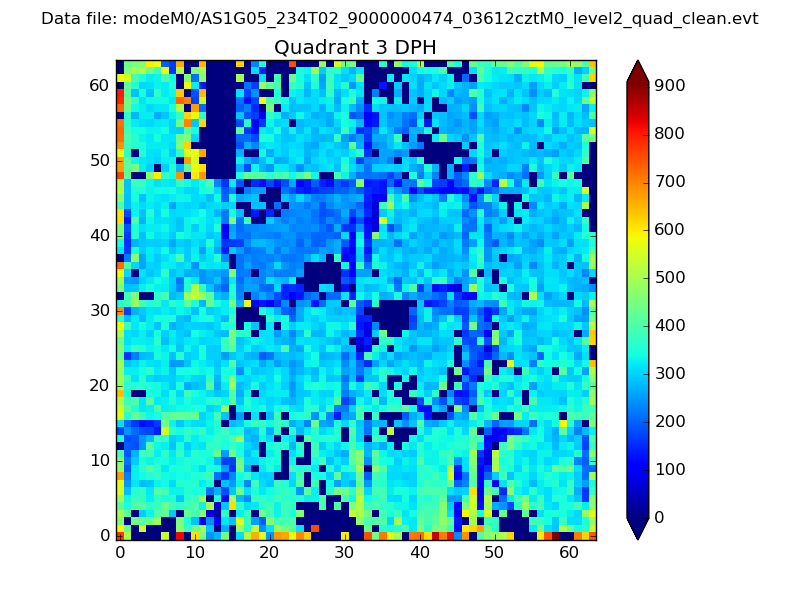 |
 |
Quadrant C |
| Plot type | Count rate plots | Images |
|---|---|---|
| Comparison with Poisson distribution Blue bars denote a histogram of data divided into 1 sec bins. Red curve is a Poisson curve with rate = median count rate of data. |
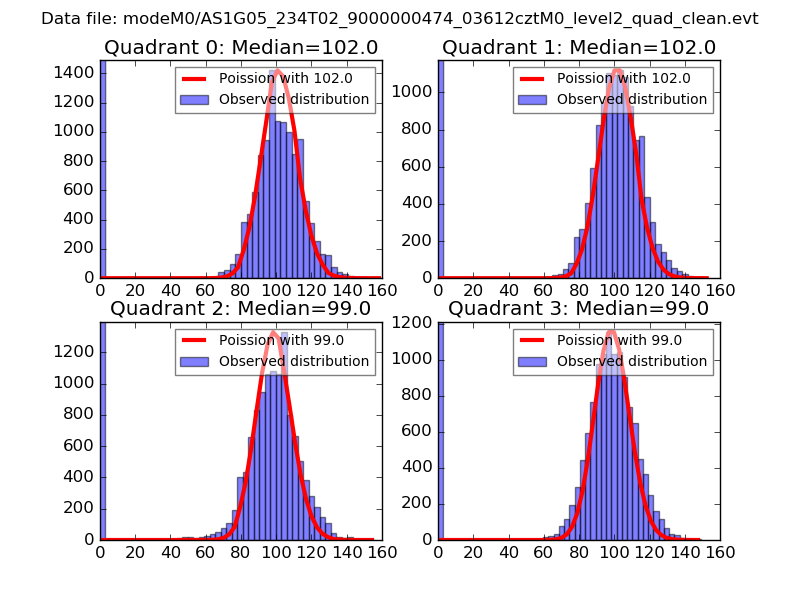 |
 |
| Quadrant-wise count rates Data is divided into 100 sec bins |
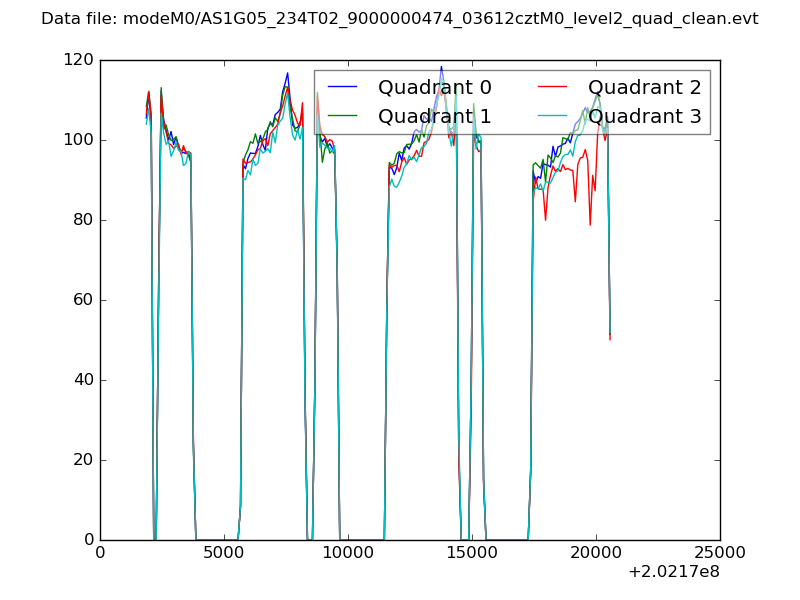 |
|
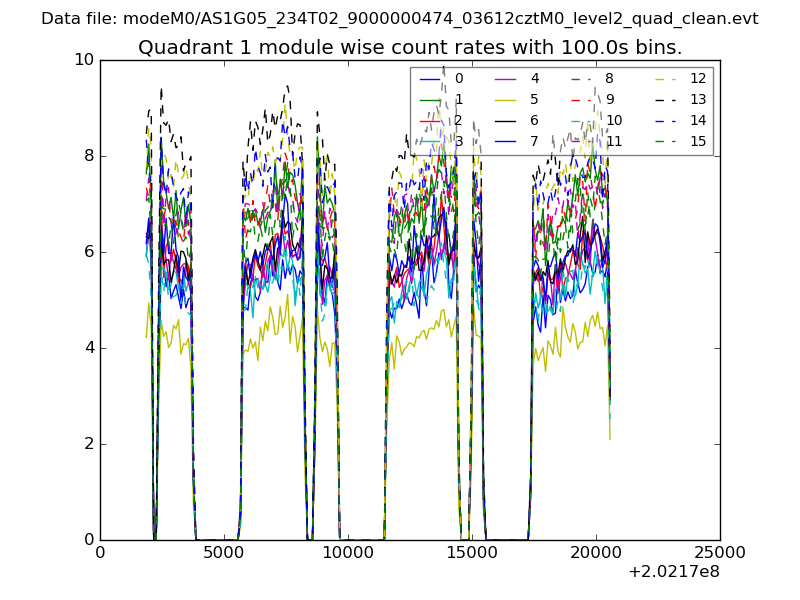
| Module-wise count rates for Quadrant A Data is divided into 100 sec bins |
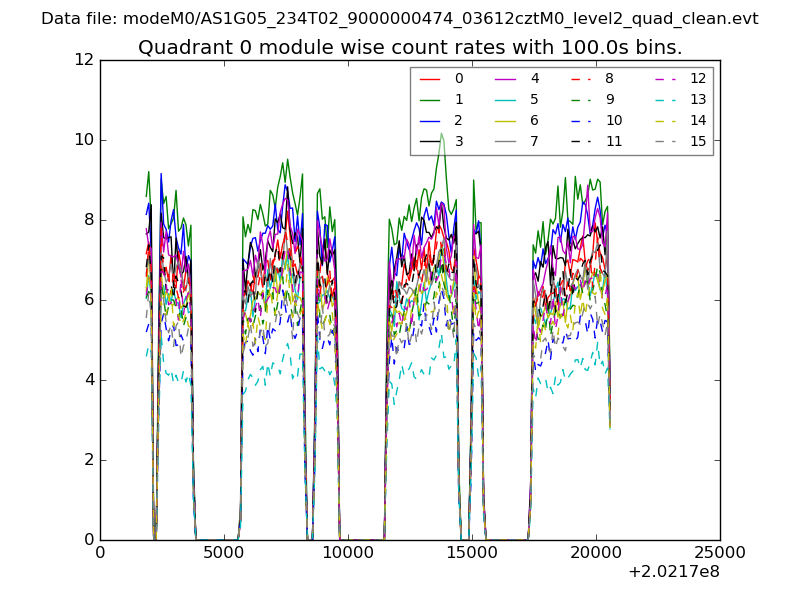 |
 |
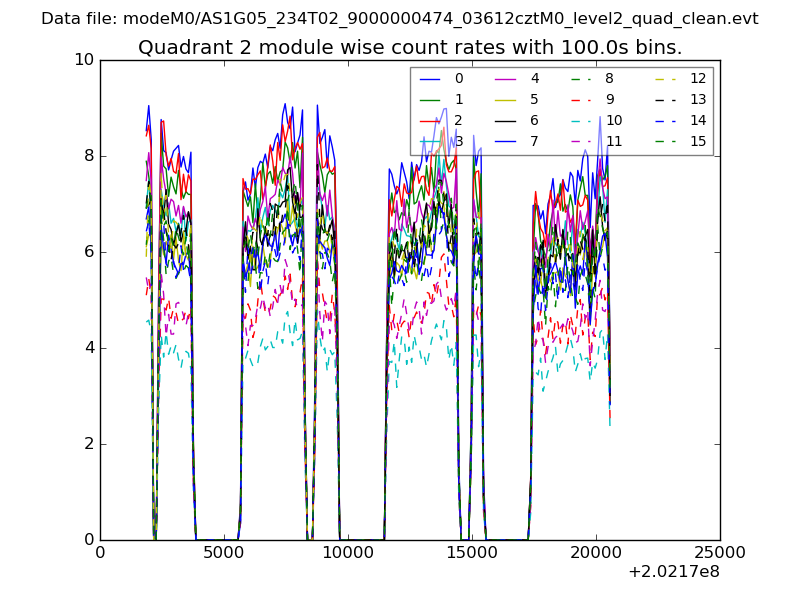
| Module-wise count rates for Quadrant B Data is divided into 100 sec bins |
 |
 |
| Module-wise count rates for Quadrant C Data is divided into 100 sec bins |
 |
 |
| Module-wise count rates for Quadrant D Data is divided into 100 sec bins |
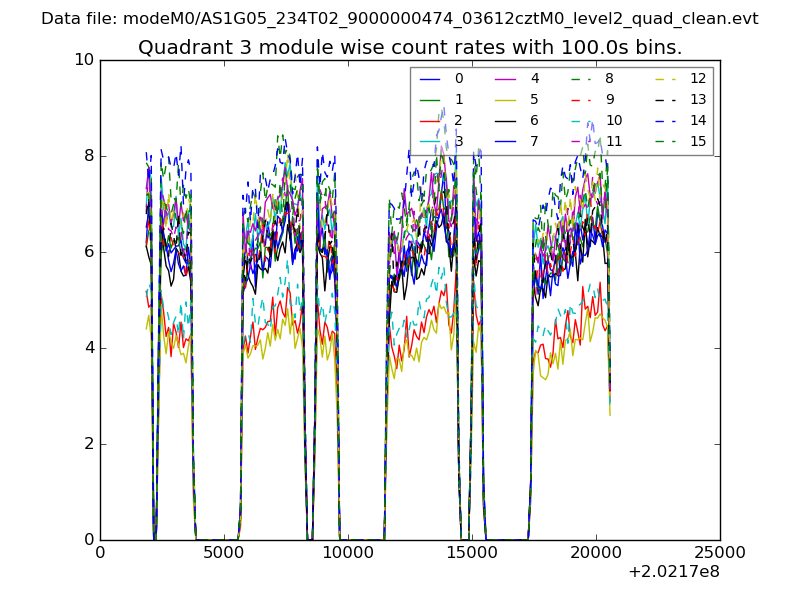 |
 |
| Parameter | Plot |
|---|---|
| CZT HV Monitor | 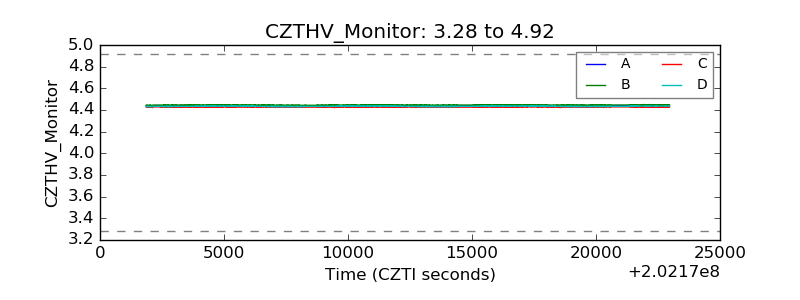 |
| D_VDD | 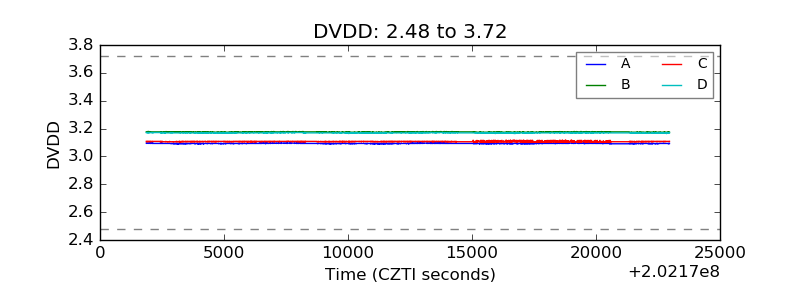 |
| Temperature 1 | 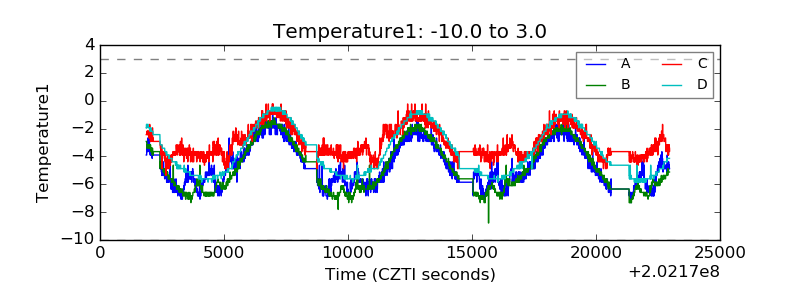 |
| Veto HV Monitor | 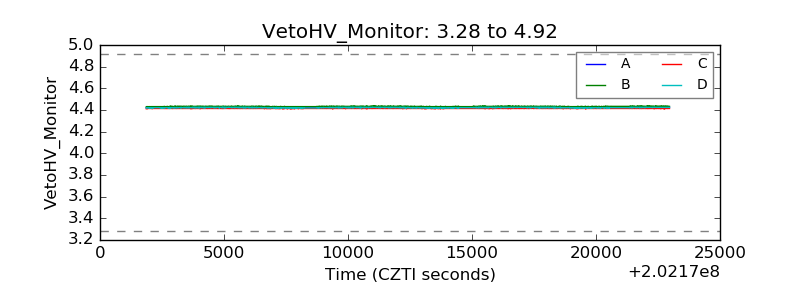 |
| Veto LLD | 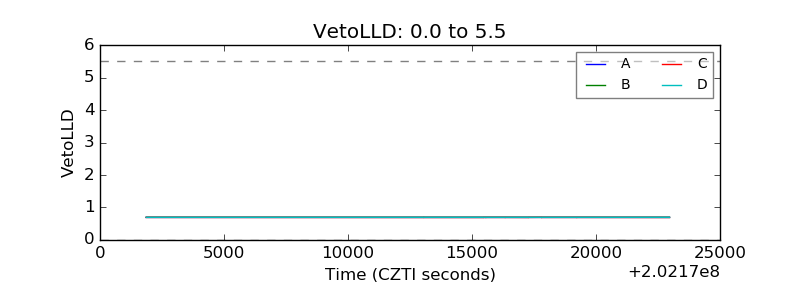 |
| Alpha Counter | 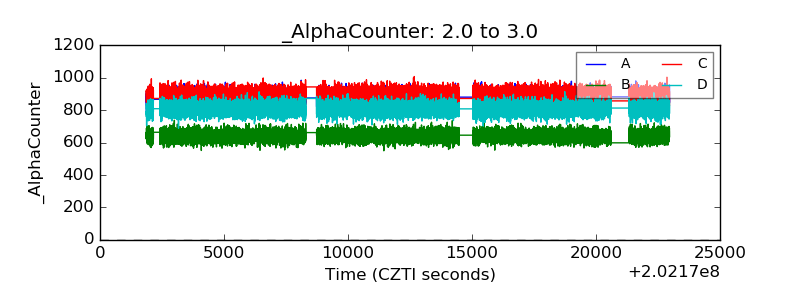 |
| _CPM_Rate | 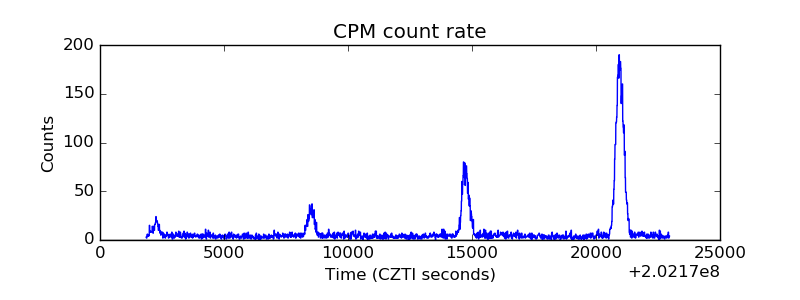 |
| CZT Counter | 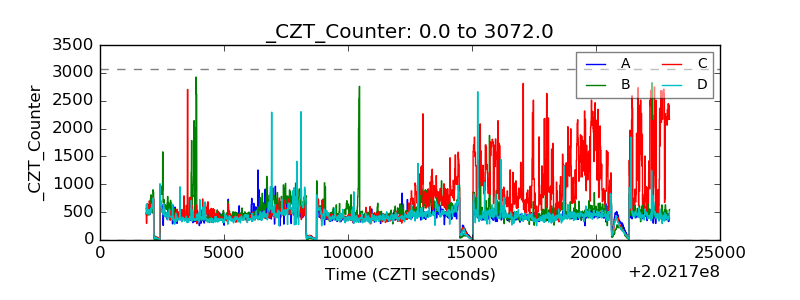 |
| +2.5 Volts monitor |  |
| +5 Volts monitor |  |
| Veto Counter | 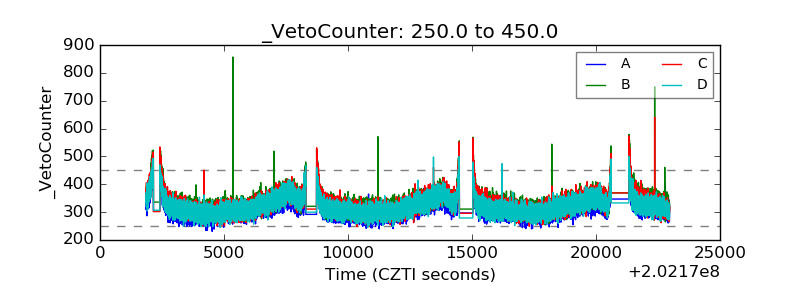 |