| Param | Original file | Final file |
|---|---|---|
| Filename | modeM0/AS1G05_234T02_9000000474_03613cztM0_level2.evt | modeM0/AS1G05_234T02_9000000474_03613cztM0_level2_quad_clean.evt |
| Size (bytes) | 643,472,640 | 60,644,160 |
| Size | 613.7 MB | 57.8 MB |
| Events in quadrant A | 3,087,996 | 350,135 |
| Events in quadrant B | 3,991,643 | 345,797 |
| Events in quadrant C | 8,722,599 | 322,212 |
| Events in quadrant D | 3,218,437 | 336,861 |
| Mode M9 | |||
|---|---|---|---|
| Quadrant | BADHDUFLAG | Total packets | Discarded packets |
| A | 0 | 16 | 0 |
| B | 0 | 16 | 0 |
| C | 0 | 16 | 0 |
| D | 0 | 16 | 0 |
| Mode SS | |||
|---|---|---|---|
| Quadrant | BADHDUFLAG | Total packets | Discarded packets |
| A | 0 | 140 | 0 |
| B | 0 | 140 | 0 |
| C | 0 | 140 | 0 |
| D | 0 | 140 | 0 |
| Mode M0 | |||
|---|---|---|---|
| Quadrant | BADHDUFLAG | Total packets | Discarded packets |
| A | 0 | 14052 | 3 |
| B | 0 | 16280 | 2 |
| C | 0 | 30821 | 2 |
| D | 0 | 14531 | 2 |
| Quadrant | Total seconds | Saturated seconds | Saturation percentage |
|---|---|---|---|
| A | 6907 | 83 | 1.201679% |
| B | 6907 | 112 | 1.621543% |
| C | 6907 | 1354 | 19.603301% |
| D | 6907 | 83 | 1.201679% |
Noise dominated data is calculated using 1-second bins in cleaned event files. If a bin has >2000 counts, and if more than 50% of those come from <1% of pixels, then it is considered to be noise-dominated and hence unusable.
| Quadrant | # 1 sec bins | Bins with >0 counts | Bins with >2000 counts | High rate bins dominated by noise | Noise dominated (total time) | Noise dominated (detector-on time) | Marked lightcurve |
|---|---|---|---|---|---|---|---|
| A | 8497 | 6909 | 0 | 0 | 0.00% | 0.00% | 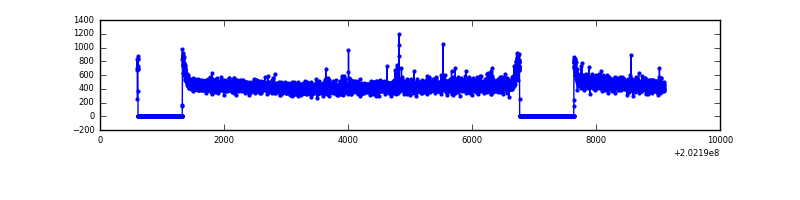 |
| B | 8497 | 6909 | 14 | 14 | 0.16% | 0.20% | 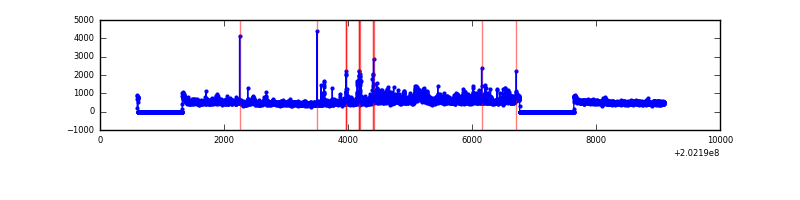 |
| C | 8497 | 6909 | 1108 | 1108 | 13.04% | 16.04% |  |
| D | 8497 | 6909 | 11 | 11 | 0.13% | 0.16% | 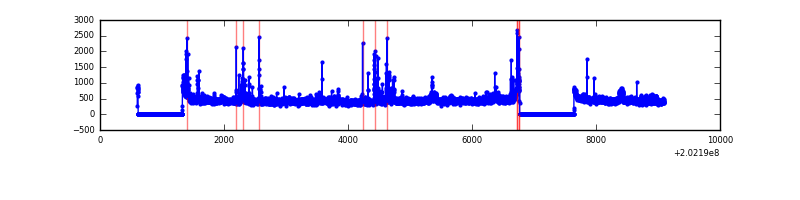 |
Top three noisy pixels from each quadrant. If the there are fewer than three noisy pixels in the level2.evt file, extra rows are filled as -1
| Pixel properties | Quadrant properties | ||||||
|---|---|---|---|---|---|---|---|
| Quadrant | DetID | PixID | Counts | Sigma | Mean | Median | Sigma |
| A | 8 | 15 | 10202 | 57.08 | 792 | 771 | 165.2 |
| A | 14 | 238 | 9762 | 54.42 | 792 | 771 | 165.2 |
| A | 0 | 226 | 8238 | 45.19 | 792 | 771 | 165.2 |
| B | 15 | 204 | 623441 | 3958.88 | 802 | 782 | 157.3 |
| B | 0 | 182 | 87281 | 549.96 | 802 | 782 | 157.3 |
| B | 5 | 172 | 64464 | 404.89 | 802 | 782 | 157.3 |
| C | 2 | 53 | 5772717 | 34275.35 | 722 | 725 | 168.4 |
| C | 9 | 247 | 119175 | 703.38 | 722 | 725 | 168.4 |
| C | 13 | 61 | 6193 | 32.47 | 722 | 725 | 168.4 |
| D | 8 | 195 | 98155 | 522.5 | 764 | 740 | 186.4 |
| D | 13 | 223 | 63550 | 336.89 | 764 | 740 | 186.4 |
| D | 7 | 223 | 55532 | 293.88 | 764 | 740 | 186.4 |
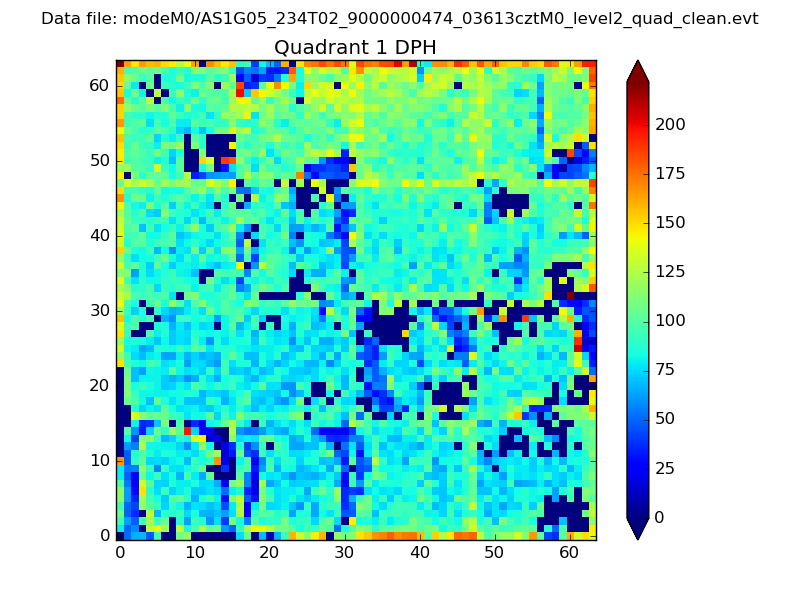
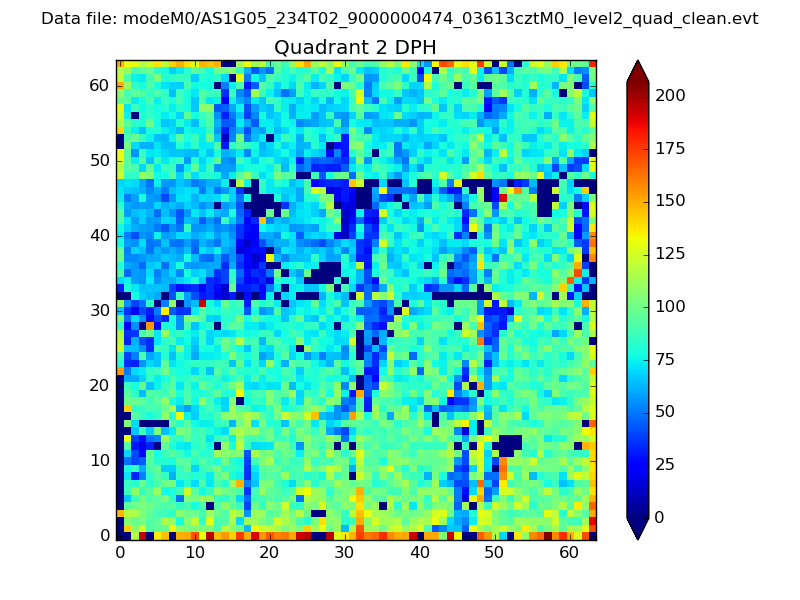
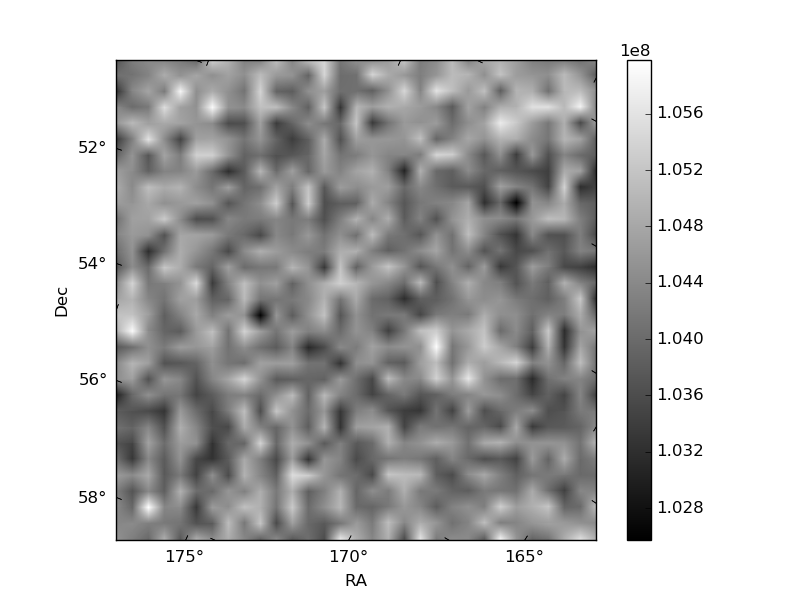
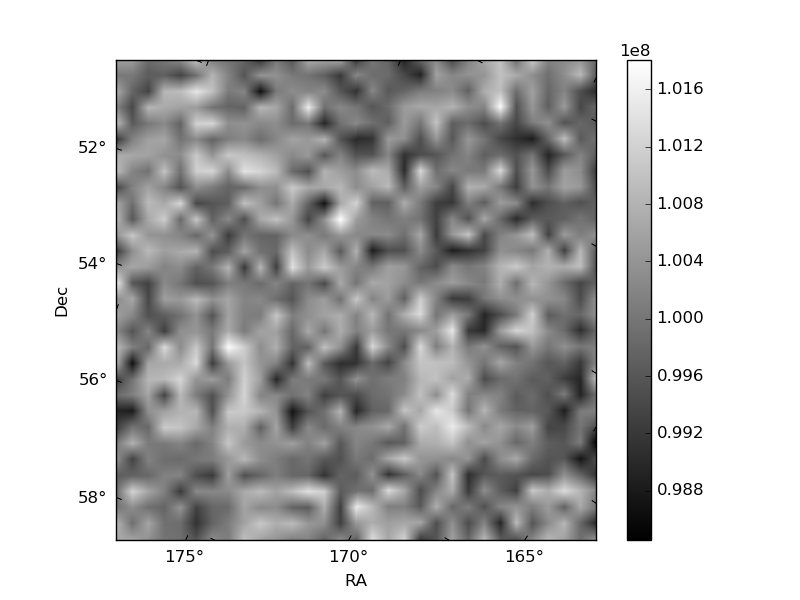
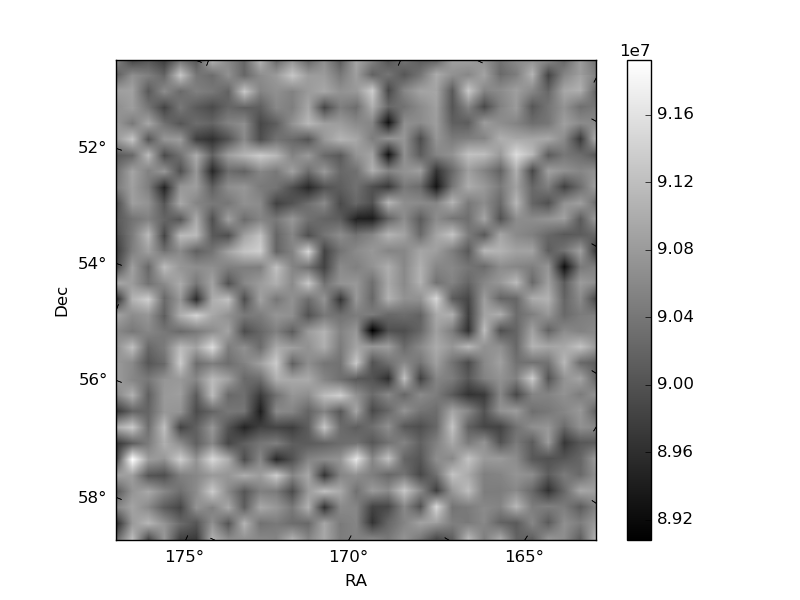
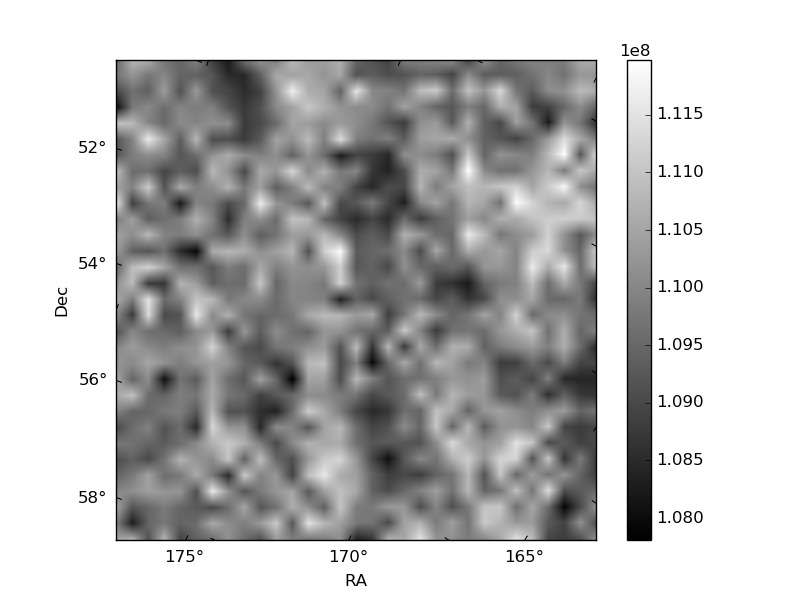
Histogram calculated using DETX and DETY for each event in the final _common_clean file
| Quadrant A | 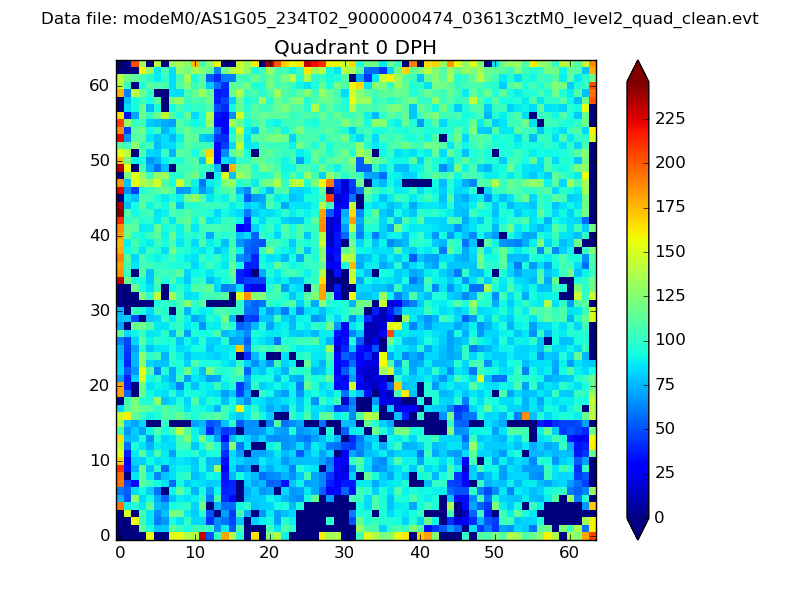 |
 |
Quadrant B |
|---|---|---|---|
| Quadrant D |  |
 |
Quadrant C |
| Plot type | Count rate plots | Images |
|---|---|---|
| Comparison with Poisson distribution Blue bars denote a histogram of data divided into 1 sec bins. Red curve is a Poisson curve with rate = median count rate of data. |
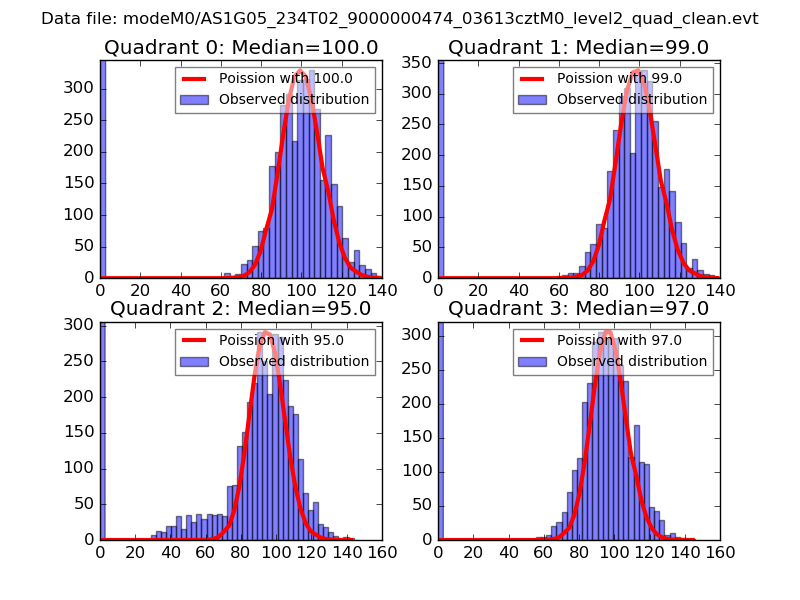 |
 |
| Quadrant-wise count rates Data is divided into 100 sec bins |
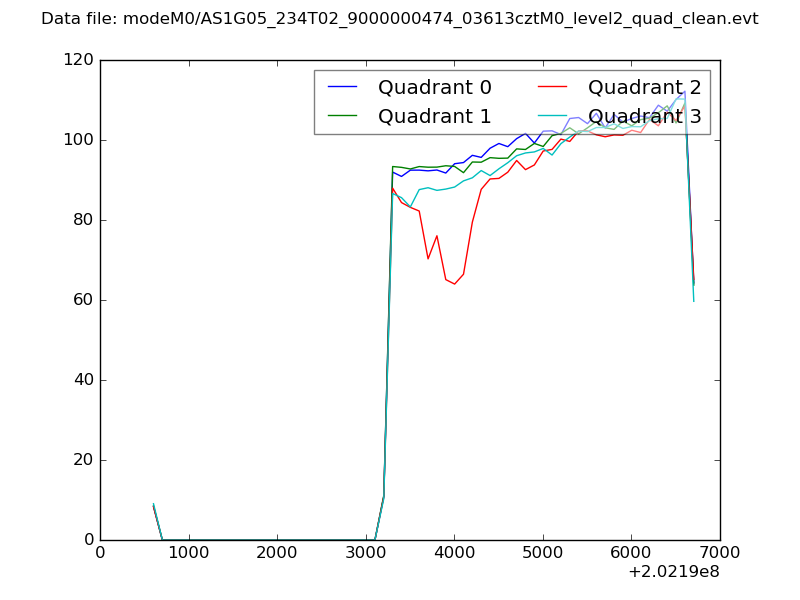 |
|
| Module-wise count rates for Quadrant A Data is divided into 100 sec bins |
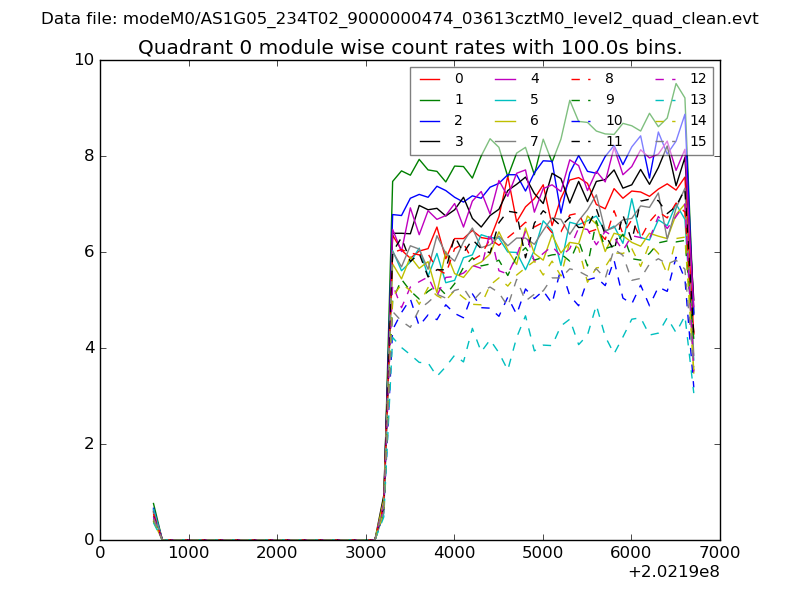 |
 |
| Module-wise count rates for Quadrant B Data is divided into 100 sec bins |
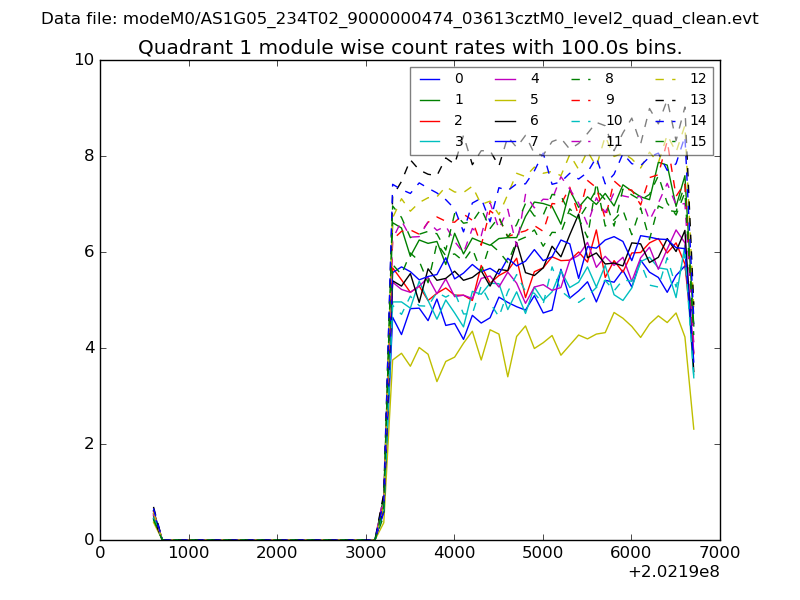 |
 |
| Module-wise count rates for Quadrant C Data is divided into 100 sec bins |
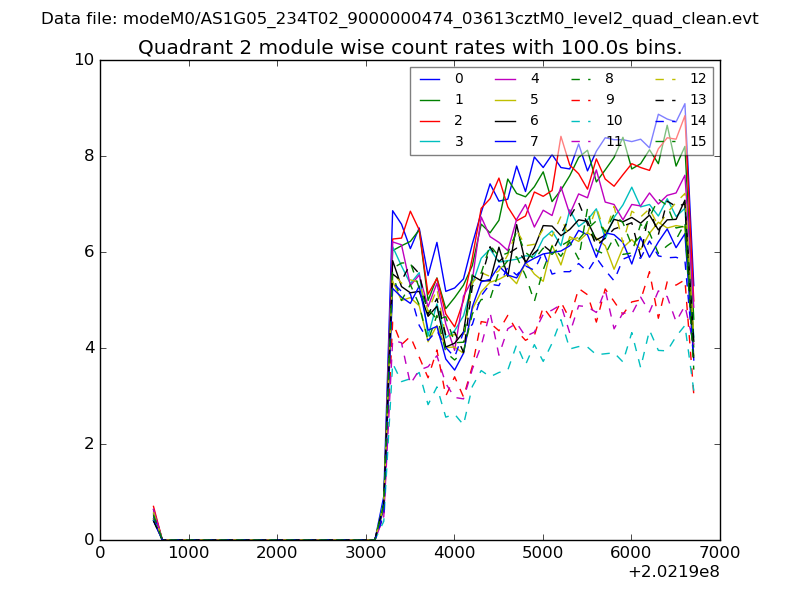 |
 |
| Module-wise count rates for Quadrant D Data is divided into 100 sec bins |
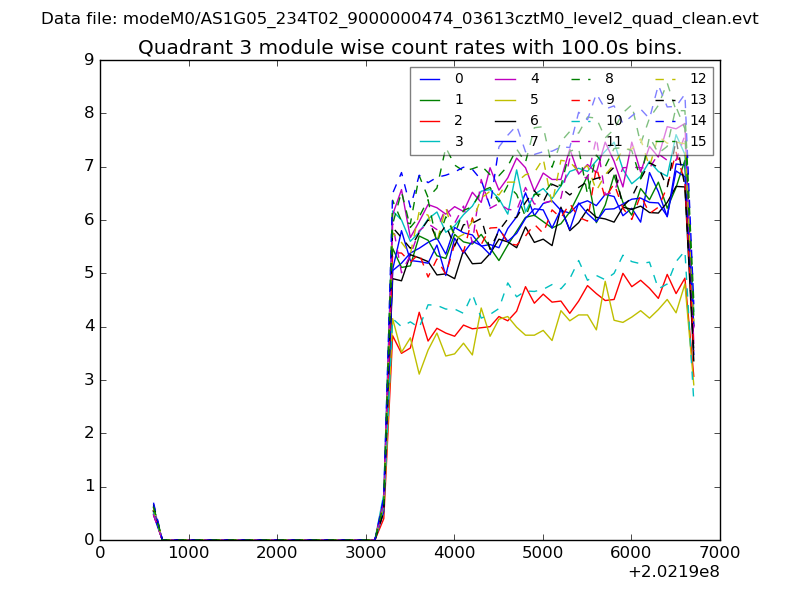 |
 |
| Parameter | Plot |
|---|---|
| CZT HV Monitor | 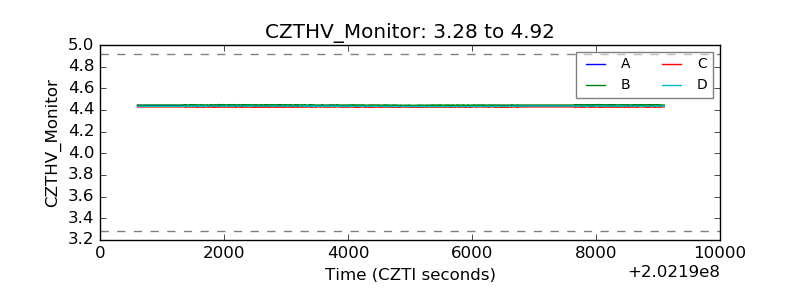 |
| D_VDD | 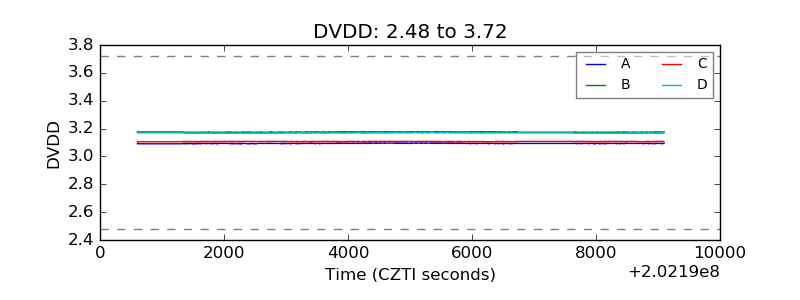 |
| Temperature 1 | 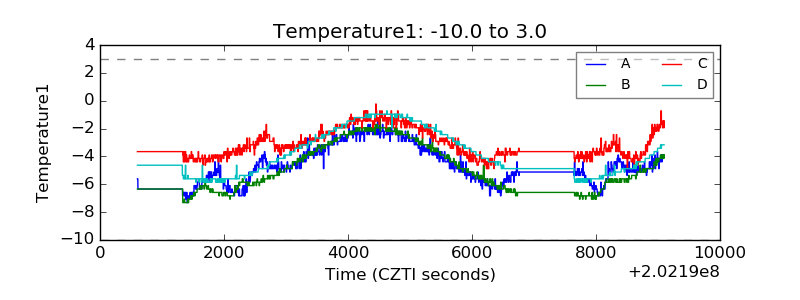 |
| Veto HV Monitor | 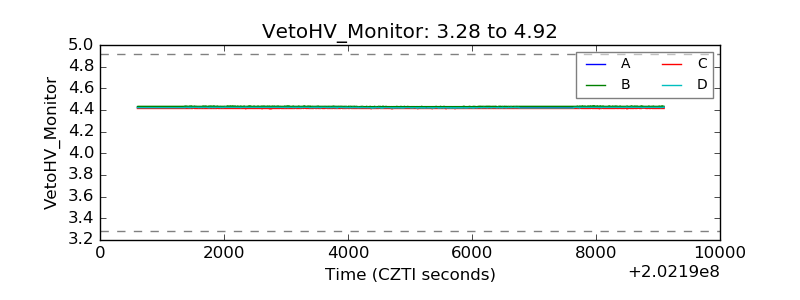 |
| Veto LLD | 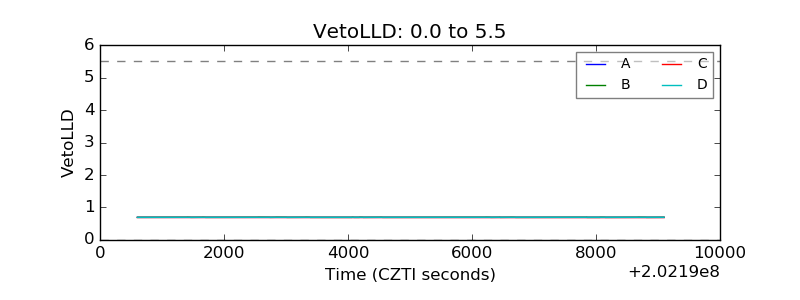 |
| Alpha Counter | 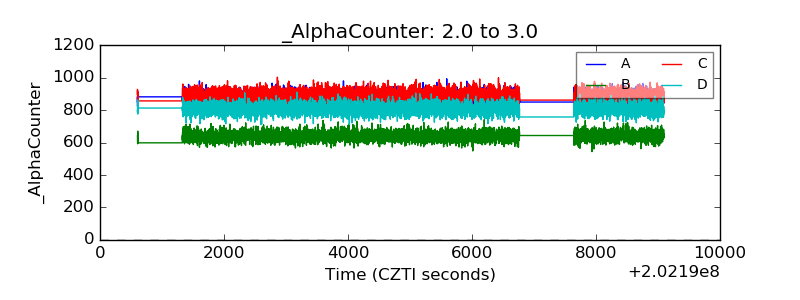 |
| _CPM_Rate | 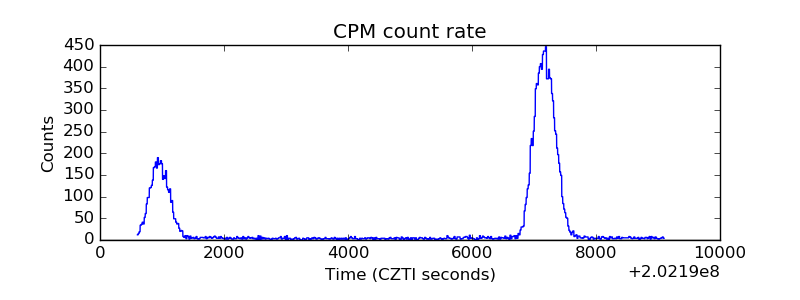 |
| CZT Counter |  |
| +2.5 Volts monitor |  |
| +5 Volts monitor |  |
| Veto Counter | 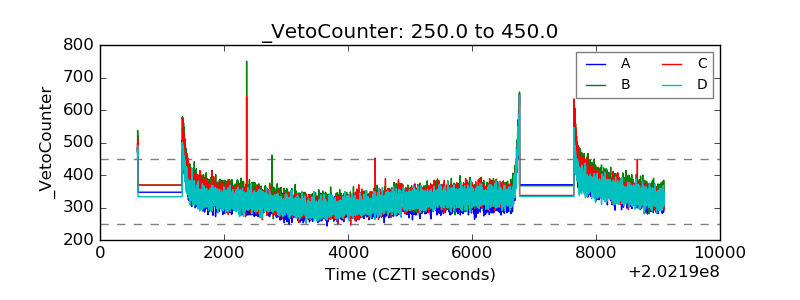 |