| Param | Original file | Final file |
|---|---|---|
| Filename | modeM0/AS1G05_234T02_9000000474_03614cztM0_level2.evt | modeM0/AS1G05_234T02_9000000474_03614cztM0_level2_quad_clean.evt |
| Size (bytes) | 529,776,000 | 69,410,880 |
| Size | 505.2 MB | 66.2 MB |
| Events in quadrant A | 3,093,256 | 416,608 |
| Events in quadrant B | 3,611,292 | 415,758 |
| Events in quadrant C | 5,788,541 | 400,842 |
| Events in quadrant D | 3,098,415 | 402,867 |
| Mode M9 | |||
|---|---|---|---|
| Quadrant | BADHDUFLAG | Total packets | Discarded packets |
| A | 0 | 10 | 0 |
| B | 0 | 10 | 0 |
| C | 0 | 10 | 0 |
| D | 0 | 10 | 0 |
| Mode SS | |||
|---|---|---|---|
| Quadrant | BADHDUFLAG | Total packets | Discarded packets |
| A | 0 | 136 | 0 |
| B | 0 | 136 | 0 |
| C | 0 | 136 | 0 |
| D | 0 | 136 | 0 |
| Mode M0 | |||
|---|---|---|---|
| Quadrant | BADHDUFLAG | Total packets | Discarded packets |
| A | 0 | 13799 | 3 |
| B | 0 | 14798 | 2 |
| C | 0 | 21750 | 2 |
| D | 0 | 14063 | 2 |
| Quadrant | Total seconds | Saturated seconds | Saturation percentage |
|---|---|---|---|
| A | 6675 | 85 | 1.273408% |
| B | 6675 | 94 | 1.408240% |
| C | 6675 | 446 | 6.681648% |
| D | 6675 | 77 | 1.153558% |
Noise dominated data is calculated using 1-second bins in cleaned event files. If a bin has >2000 counts, and if more than 50% of those come from <1% of pixels, then it is considered to be noise-dominated and hence unusable.
| Quadrant | # 1 sec bins | Bins with >0 counts | Bins with >2000 counts | High rate bins dominated by noise | Noise dominated (total time) | Noise dominated (detector-on time) | Marked lightcurve |
|---|---|---|---|---|---|---|---|
| A | 7670 | 6676 | 1 | 1 | 0.01% | 0.01% | 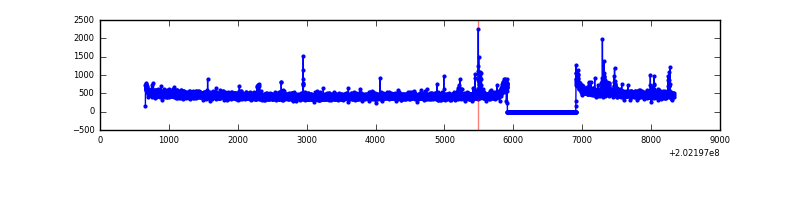 |
| B | 7670 | 6676 | 2 | 2 | 0.03% | 0.03% | 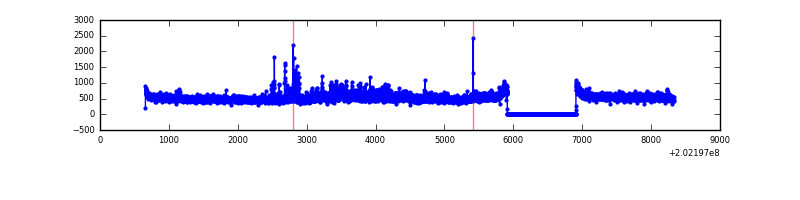 |
| C | 7670 | 6676 | 285 | 285 | 3.72% | 4.27% | 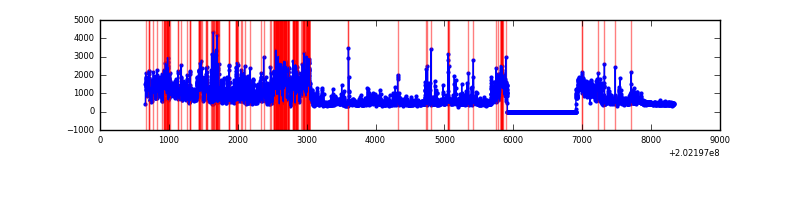 |
| D | 7670 | 6676 | 15 | 15 | 0.20% | 0.22% | 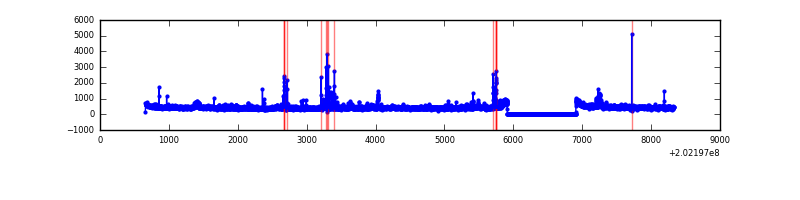 |
Top three noisy pixels from each quadrant. If the there are fewer than three noisy pixels in the level2.evt file, extra rows are filled as -1
| Pixel properties | Quadrant properties | ||||||
|---|---|---|---|---|---|---|---|
| Quadrant | DetID | PixID | Counts | Sigma | Mean | Median | Sigma |
| A | 0 | 50 | 36692 | 223.91 | 780 | 763 | 160.5 |
| A | 0 | 149 | 14103 | 83.13 | 780 | 763 | 160.5 |
| A | 0 | 128 | 13091 | 76.83 | 780 | 763 | 160.5 |
| B | 15 | 204 | 322432 | 2092.12 | 787 | 767 | 153.8 |
| B | 3 | 0 | 133315 | 862.1 | 787 | 767 | 153.8 |
| B | 5 | 172 | 30306 | 192.12 | 787 | 767 | 153.8 |
| C | 2 | 53 | 2793074 | 16341.67 | 739 | 743 | 170.9 |
| C | 9 | 247 | 85527 | 496.18 | 739 | 743 | 170.9 |
| C | 7 | 223 | 13322 | 73.62 | 739 | 743 | 170.9 |
| D | 13 | 223 | 103213 | 562.41 | 751 | 728 | 182.2 |
| D | 8 | 195 | 40795 | 219.88 | 751 | 728 | 182.2 |
| D | 7 | 223 | 37159 | 199.92 | 751 | 728 | 182.2 |
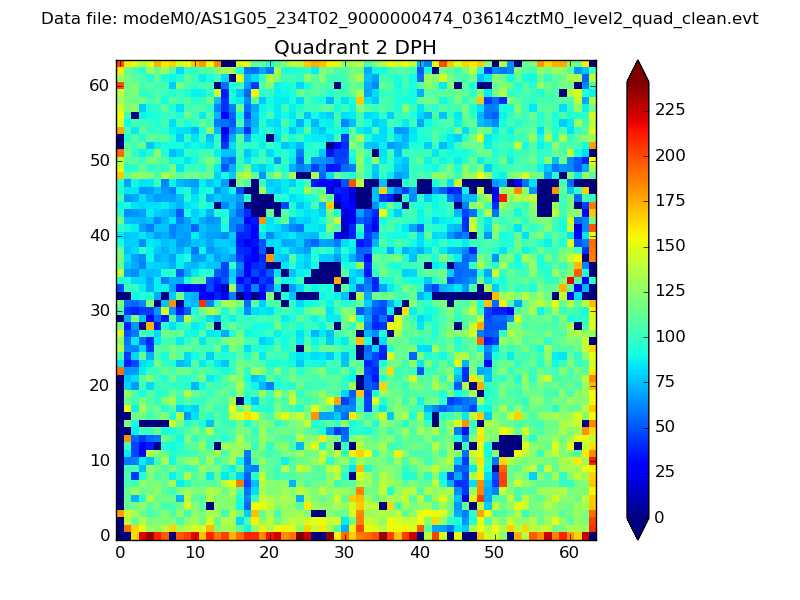
Histogram calculated using DETX and DETY for each event in the final _common_clean file
| Quadrant A | 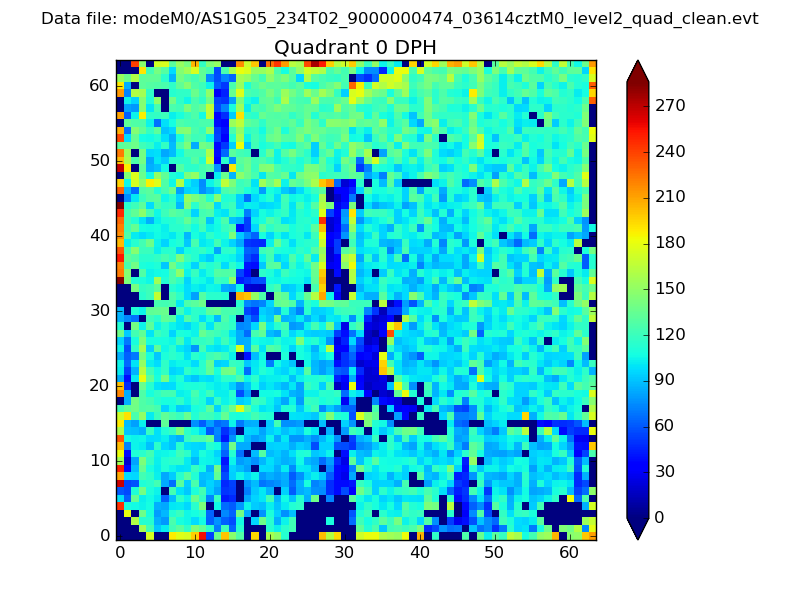 |
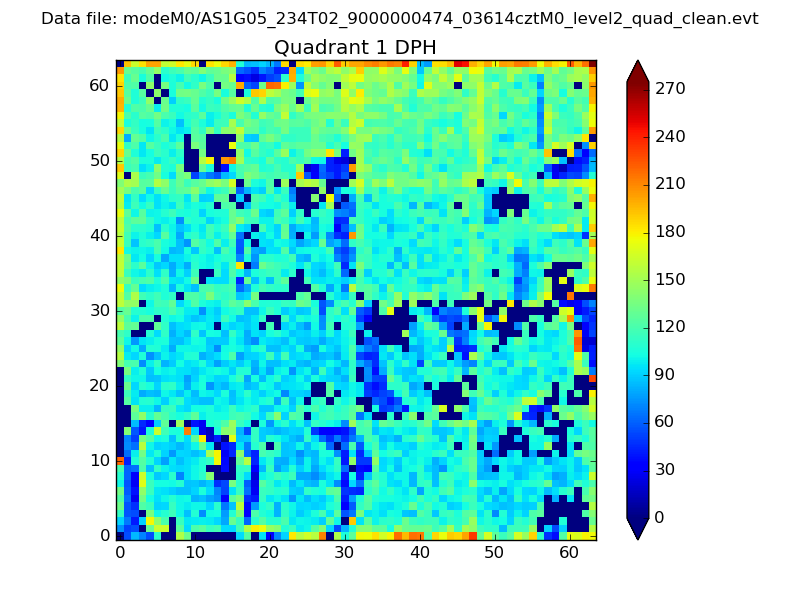 |
Quadrant B |
|---|---|---|---|
| Quadrant D | 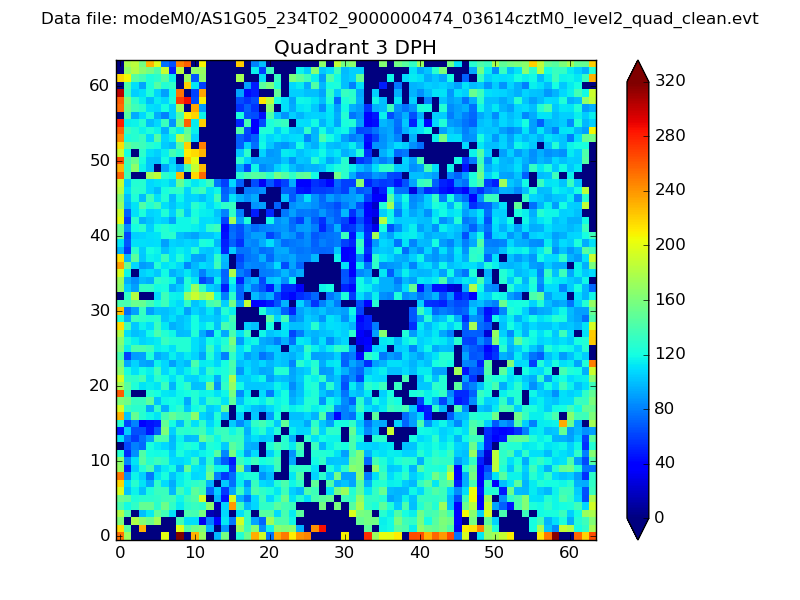 |
 |
Quadrant C |
| Plot type | Count rate plots | Images |
|---|---|---|
| Comparison with Poisson distribution Blue bars denote a histogram of data divided into 1 sec bins. Red curve is a Poisson curve with rate = median count rate of data. |
 |
 |
| Quadrant-wise count rates Data is divided into 100 sec bins |
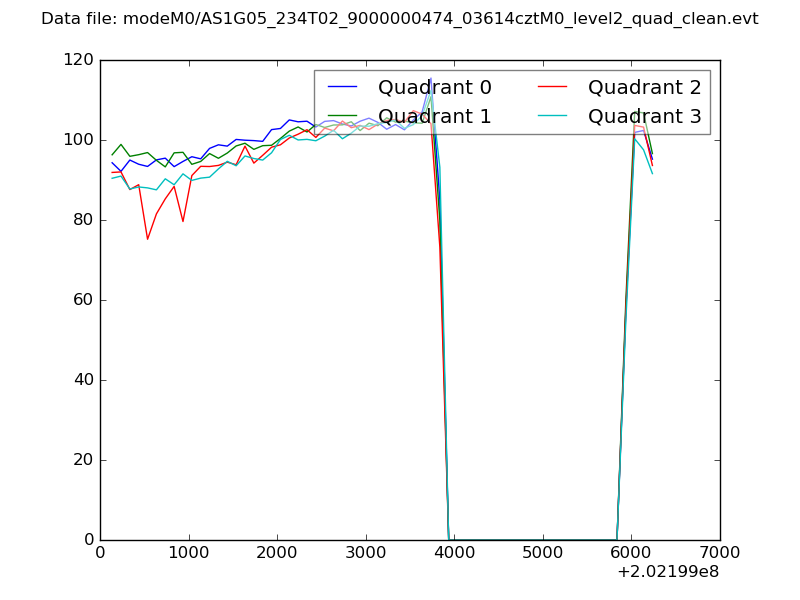 |
|
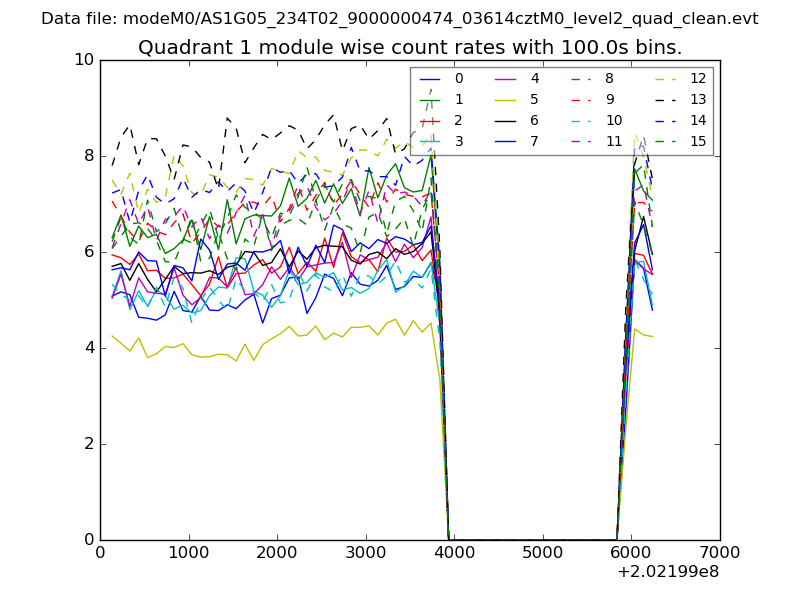
| Module-wise count rates for Quadrant A Data is divided into 100 sec bins |
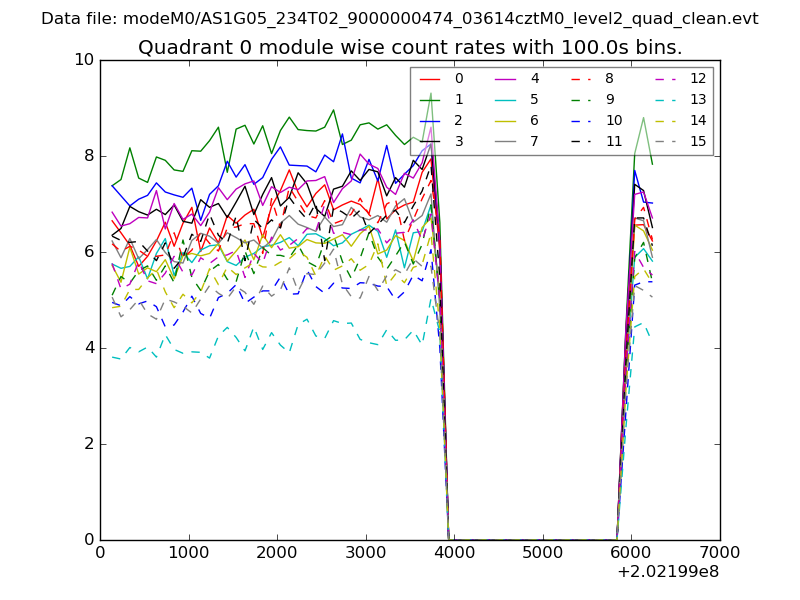 |
 |
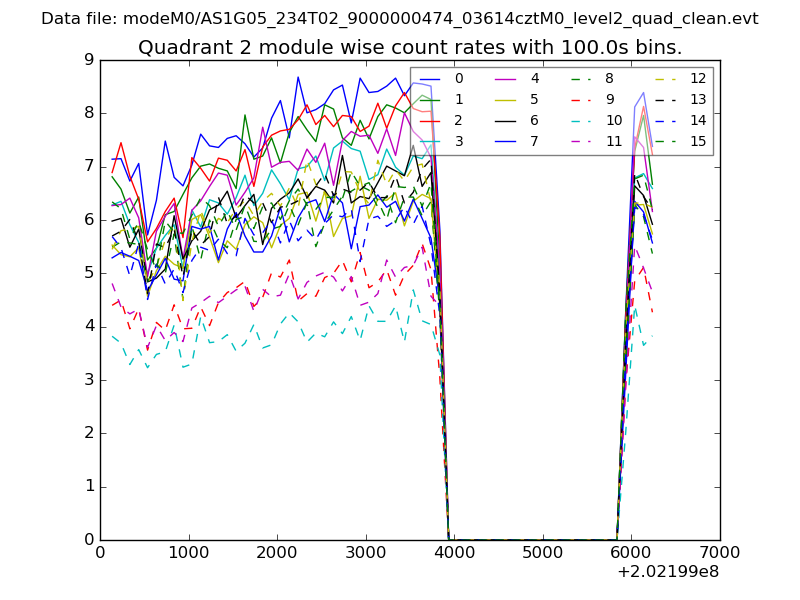
| Module-wise count rates for Quadrant B Data is divided into 100 sec bins |
 |
 |
| Module-wise count rates for Quadrant C Data is divided into 100 sec bins |
 |
 |
| Module-wise count rates for Quadrant D Data is divided into 100 sec bins |
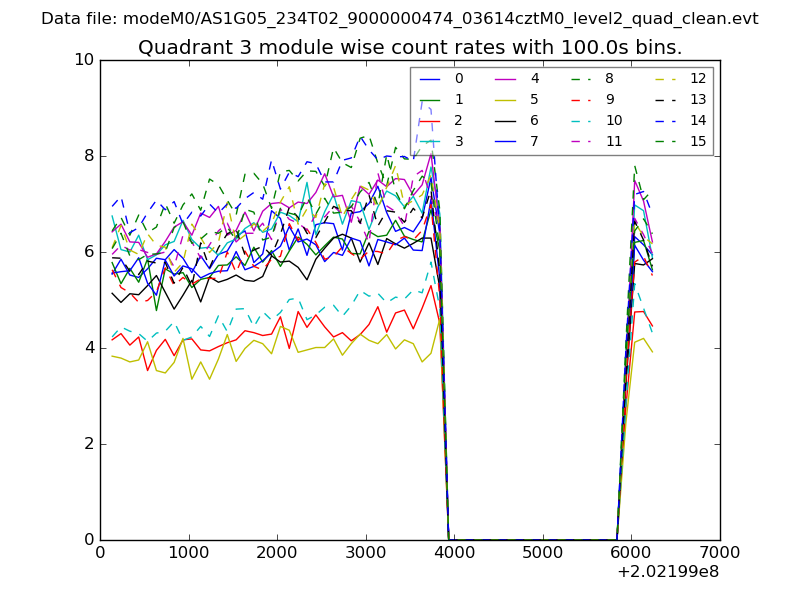 |
 |
| Parameter | Plot |
|---|---|
| CZT HV Monitor | 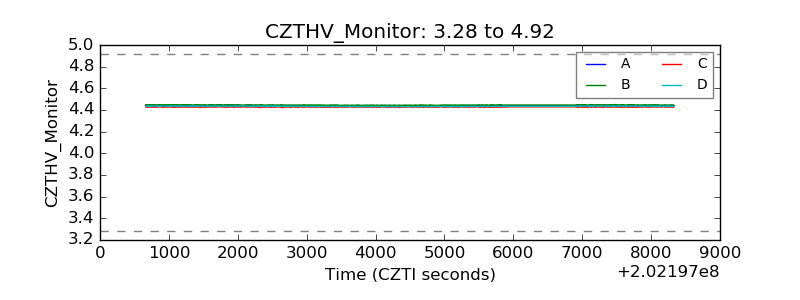 |
| D_VDD | 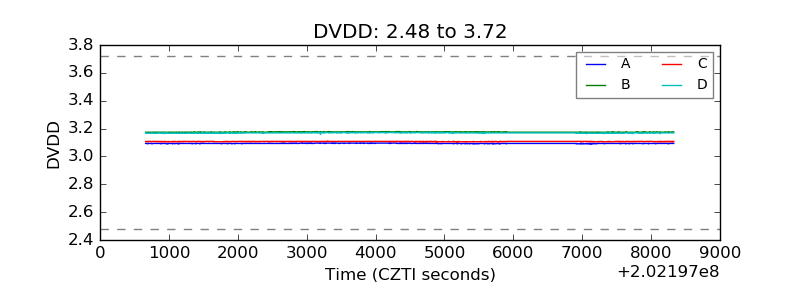 |
| Temperature 1 | 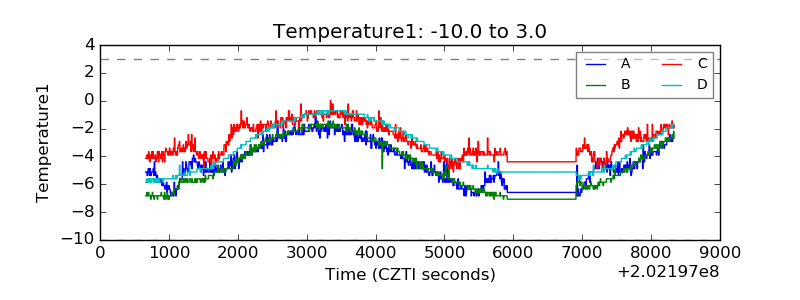 |
| Veto HV Monitor | 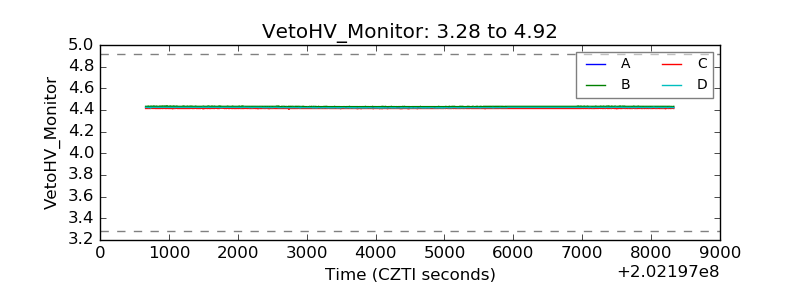 |
| Veto LLD | 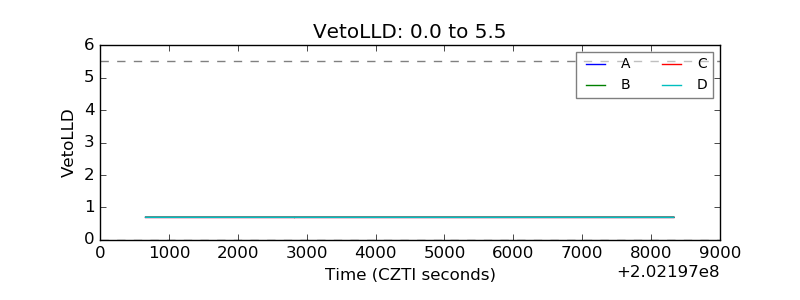 |
| Alpha Counter | 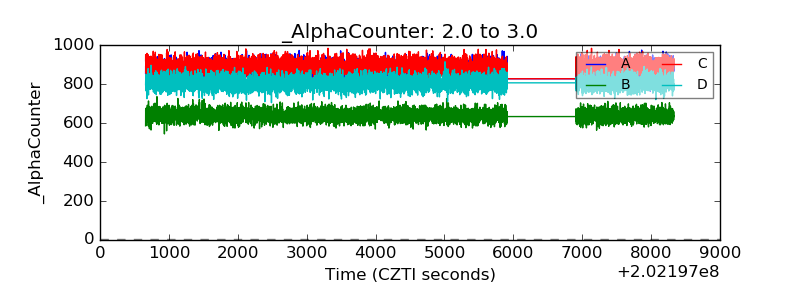 |
| _CPM_Rate | 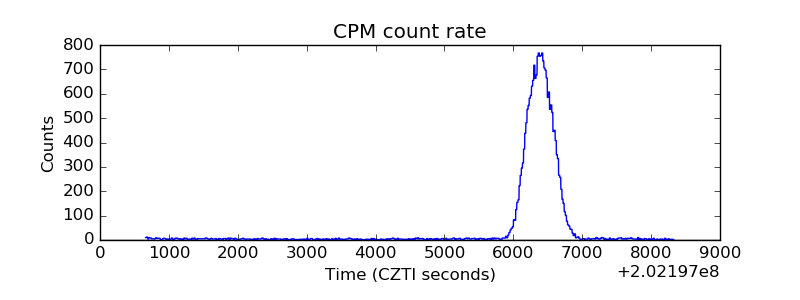 |
| CZT Counter | 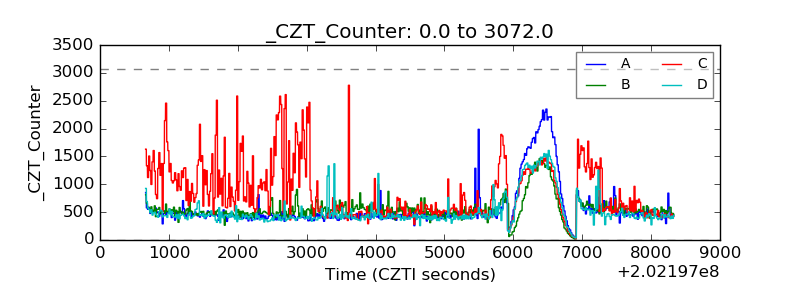 |
| +2.5 Volts monitor |  |
| +5 Volts monitor |  |
| Veto Counter | 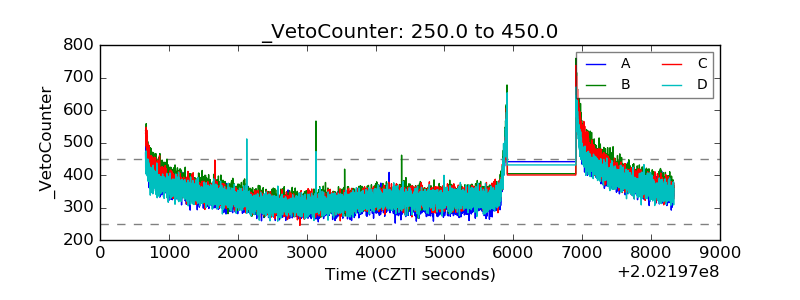 |