| Param | Original file | Final file |
|---|---|---|
| Filename | modeM0/AS1G05_234T02_9000000474_03616cztM0_level2.evt | modeM0/AS1G05_234T02_9000000474_03616cztM0_level2_quad_clean.evt |
| Size (bytes) | 552,957,120 | 75,147,840 |
| Size | 527.3 MB | 71.7 MB |
| Events in quadrant A | 3,103,285 | 478,536 |
| Events in quadrant B | 3,931,139 | 476,325 |
| Events in quadrant C | 6,297,497 | 408,470 |
| Events in quadrant D | 2,974,764 | 459,445 |
| Mode M9 | |||
|---|---|---|---|
| Quadrant | BADHDUFLAG | Total packets | Discarded packets |
| A | 0 | 18 | 0 |
| B | 0 | 18 | 0 |
| C | 0 | 18 | 0 |
| D | 0 | 19 | 0 |
| Mode SS | |||
|---|---|---|---|
| Quadrant | BADHDUFLAG | Total packets | Discarded packets |
| A | 0 | 130 | 0 |
| B | 0 | 130 | 0 |
| C | 0 | 130 | 0 |
| D | 0 | 130 | 0 |
| Mode M0 | |||
|---|---|---|---|
| Quadrant | BADHDUFLAG | Total packets | Discarded packets |
| A | 0 | 13639 | 3 |
| B | 0 | 15719 | 2 |
| C | 0 | 23051 | 2 |
| D | 0 | 13565 | 2 |
| Quadrant | Total seconds | Saturated seconds | Saturation percentage |
|---|---|---|---|
| A | 6487 | 111 | 1.711115% |
| B | 6487 | 104 | 1.603206% |
| C | 6487 | 1189 | 18.328966% |
| D | 6487 | 88 | 1.356559% |
Noise dominated data is calculated using 1-second bins in cleaned event files. If a bin has >2000 counts, and if more than 50% of those come from <1% of pixels, then it is considered to be noise-dominated and hence unusable.
| Quadrant | # 1 sec bins | Bins with >0 counts | Bins with >2000 counts | High rate bins dominated by noise | Noise dominated (total time) | Noise dominated (detector-on time) | Marked lightcurve |
|---|---|---|---|---|---|---|---|
| A | 7612 | 6488 | 0 | 0 | 0.00% | 0.00% | 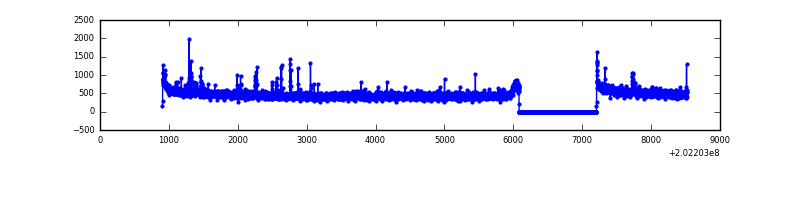 |
| B | 7612 | 6488 | 3 | 3 | 0.04% | 0.05% | 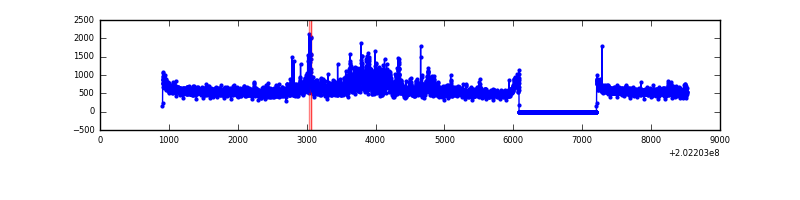 |
| C | 7612 | 6487 | 959 | 959 | 12.60% | 14.78% |  |
| D | 7612 | 6488 | 9 | 9 | 0.12% | 0.14% | 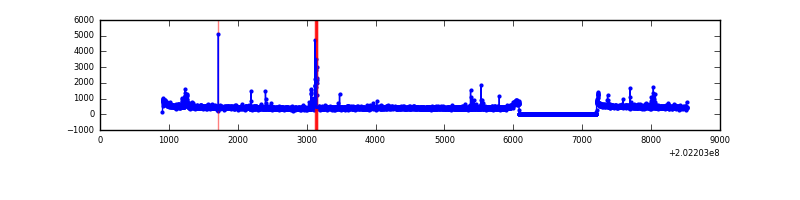 |
Top three noisy pixels from each quadrant. If the there are fewer than three noisy pixels in the level2.evt file, extra rows are filled as -1
| Pixel properties | Quadrant properties | ||||||
|---|---|---|---|---|---|---|---|
| Quadrant | DetID | PixID | Counts | Sigma | Mean | Median | Sigma |
| A | 0 | 128 | 30648 | 187.63 | 778 | 761 | 159.3 |
| A | 0 | 50 | 22814 | 138.45 | 778 | 761 | 159.3 |
| A | 14 | 191 | 18118 | 108.97 | 778 | 761 | 159.3 |
| B | 15 | 204 | 578883 | 3864.85 | 782 | 762 | 149.6 |
| B | 3 | 0 | 235359 | 1568.32 | 782 | 762 | 149.6 |
| B | 0 | 182 | 24321 | 157.49 | 782 | 762 | 149.6 |
| C | 2 | 53 | 3403296 | 21253.73 | 692 | 694 | 160.1 |
| C | 9 | 247 | 89307 | 553.5 | 692 | 694 | 160.1 |
| C | 7 | 223 | 59416 | 366.8 | 692 | 694 | 160.1 |
| D | 13 | 223 | 62143 | 342.39 | 749 | 726 | 179.4 |
| D | 7 | 223 | 36864 | 201.46 | 749 | 726 | 179.4 |
| D | 2 | 14 | 14352 | 75.96 | 749 | 726 | 179.4 |
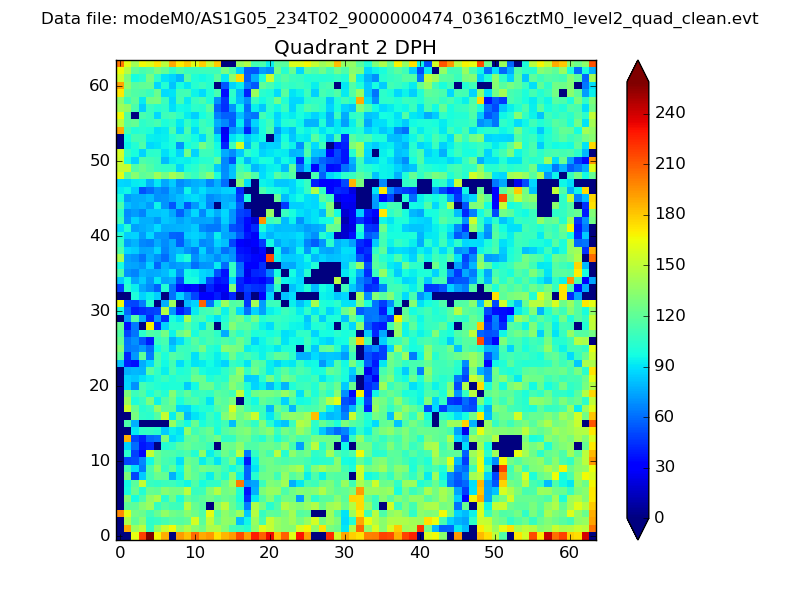
Histogram calculated using DETX and DETY for each event in the final _common_clean file
| Quadrant A |  |
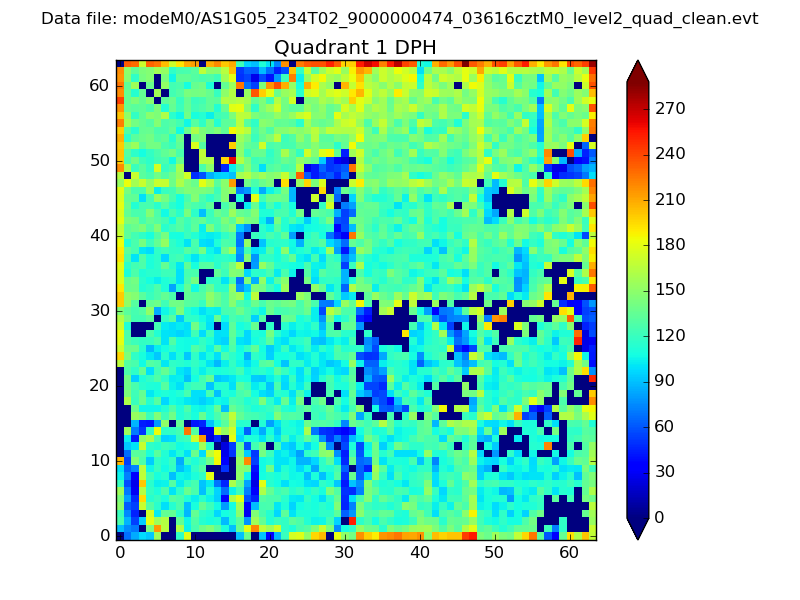 |
Quadrant B |
|---|---|---|---|
| Quadrant D | 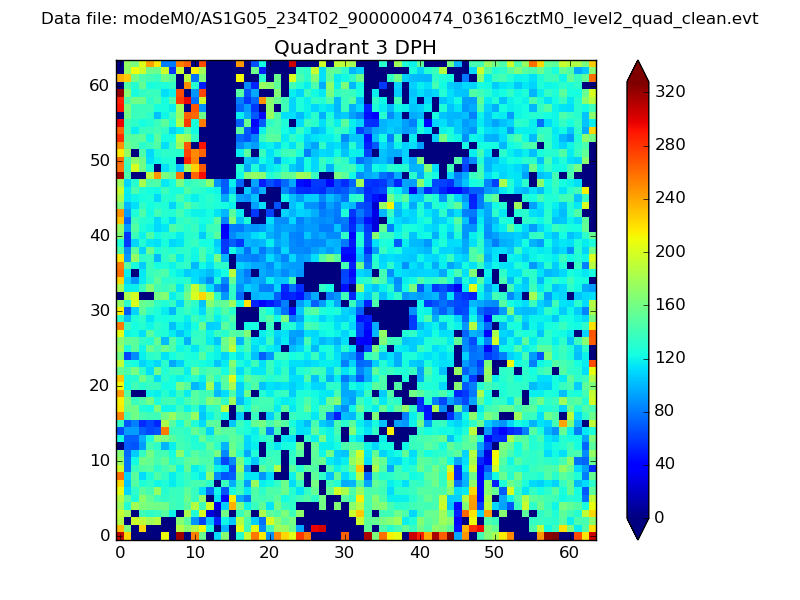 |
 |
Quadrant C |
| Plot type | Count rate plots | Images |
|---|---|---|
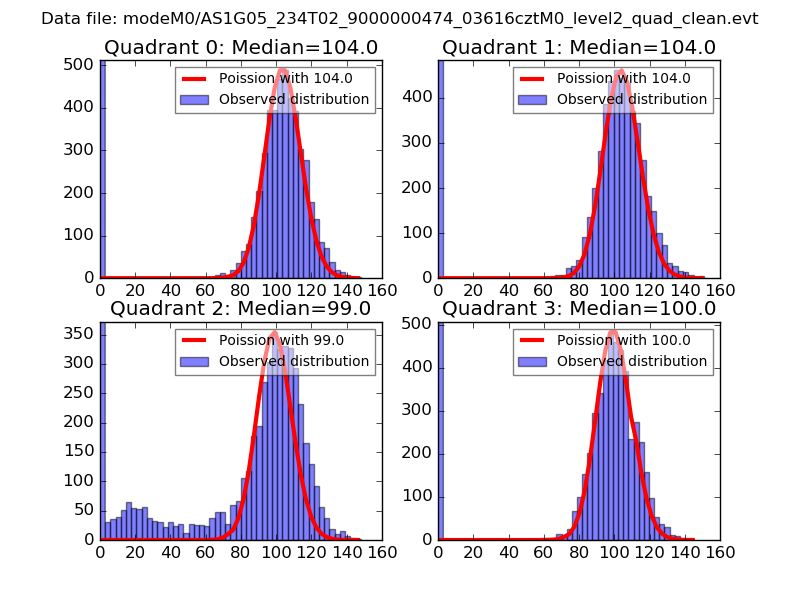
| Comparison with Poisson distribution Blue bars denote a histogram of data divided into 1 sec bins. Red curve is a Poisson curve with rate = median count rate of data. |
 |
 |
| Quadrant-wise count rates Data is divided into 100 sec bins |
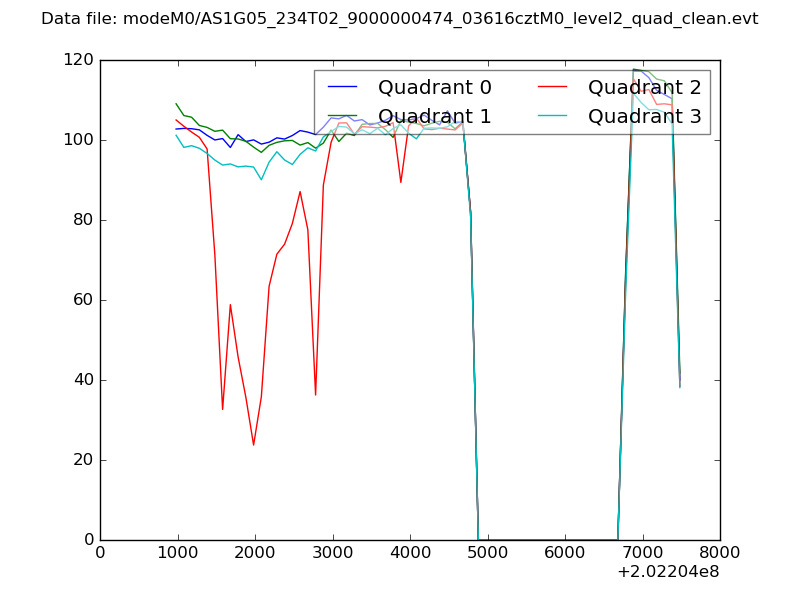 |
|
| Module-wise count rates for Quadrant A Data is divided into 100 sec bins |
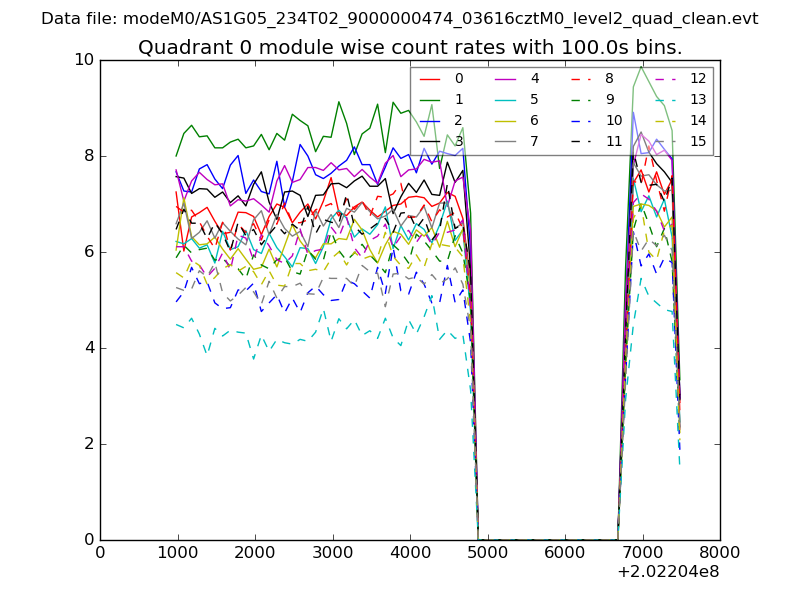 |
 |
| Module-wise count rates for Quadrant B Data is divided into 100 sec bins |
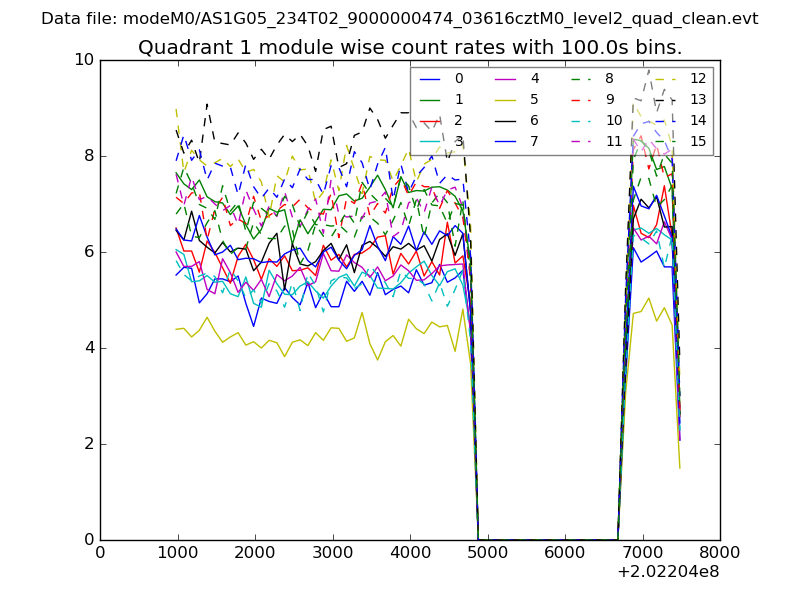 |
 |
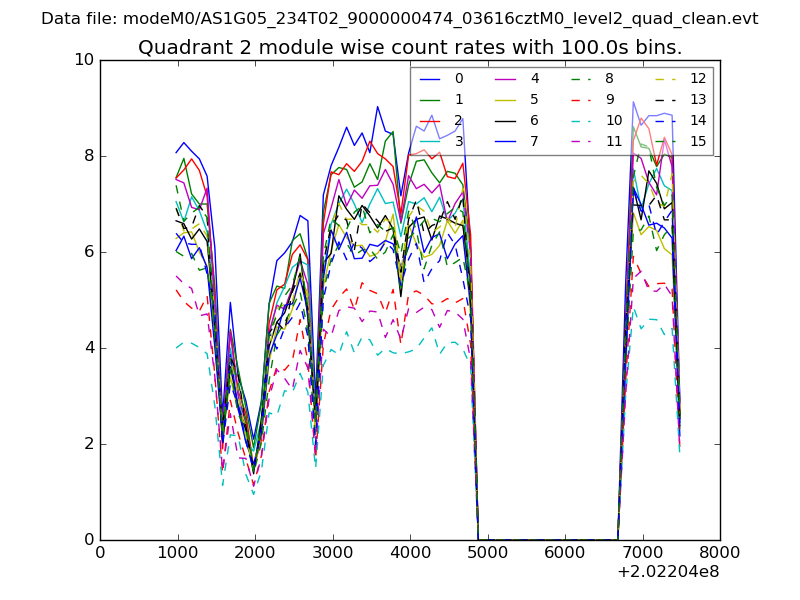
| Module-wise count rates for Quadrant C Data is divided into 100 sec bins |
 |
 |
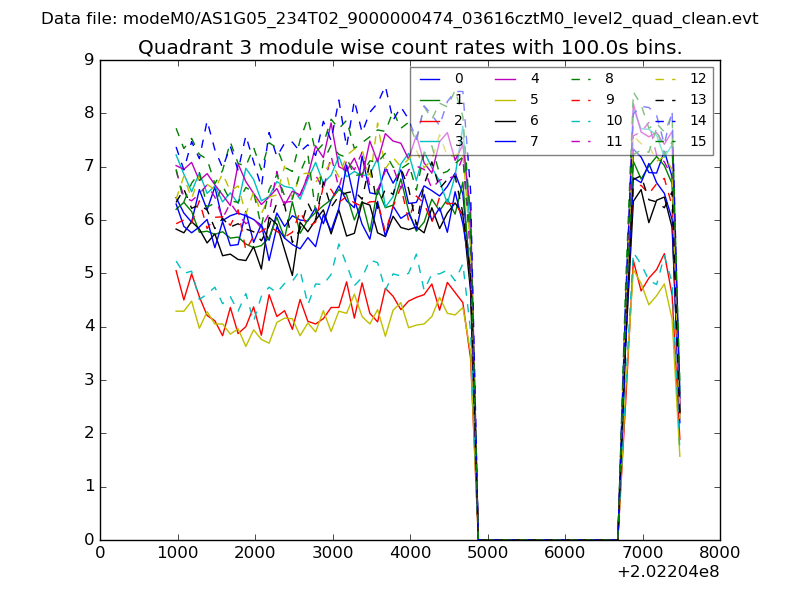
| Module-wise count rates for Quadrant D Data is divided into 100 sec bins |
 |
 |
| Parameter | Plot |
|---|---|
| CZT HV Monitor | 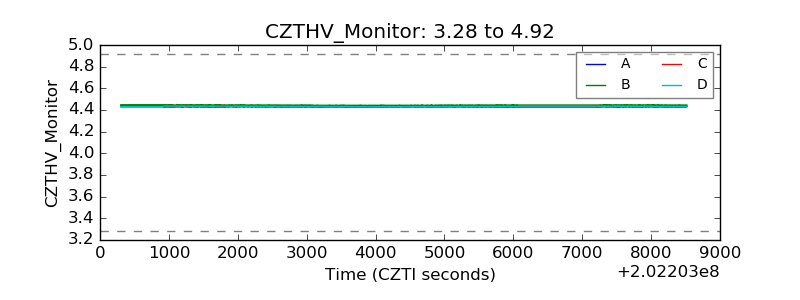 |
| D_VDD | 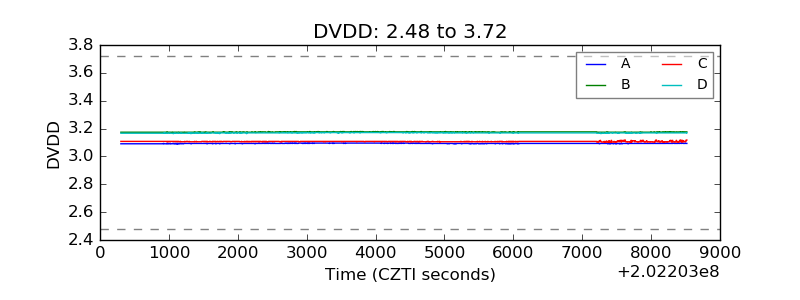 |
| Temperature 1 | 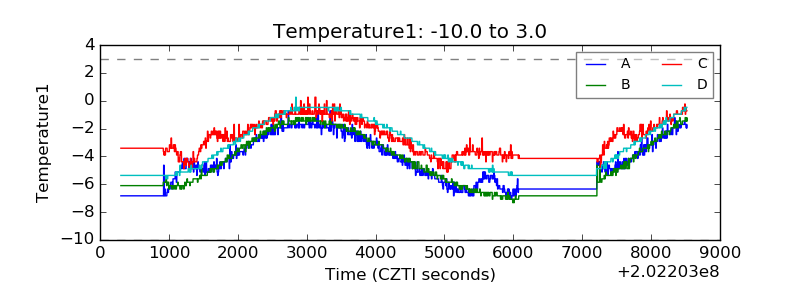 |
| Veto HV Monitor | 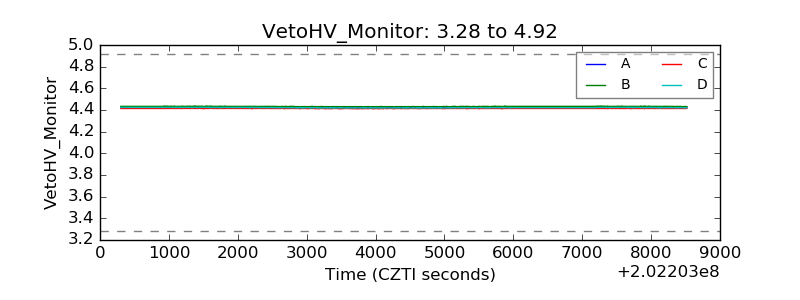 |
| Veto LLD | 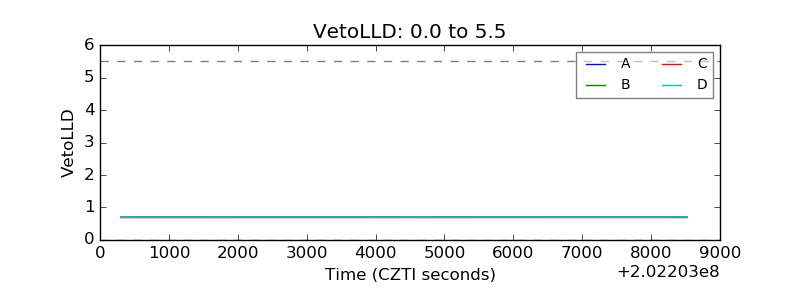 |
| Alpha Counter | 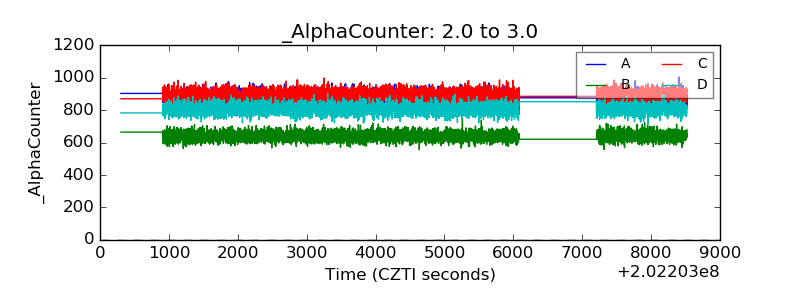 |
| _CPM_Rate | 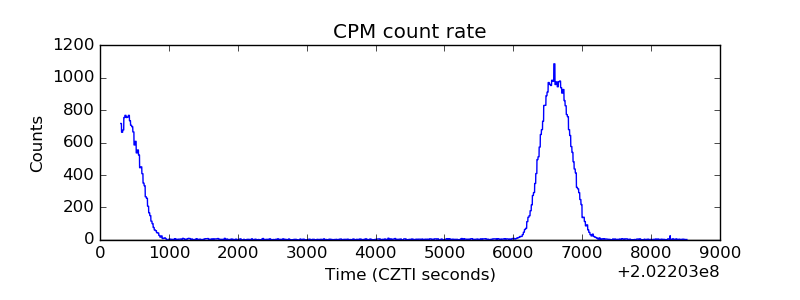 |
| CZT Counter | 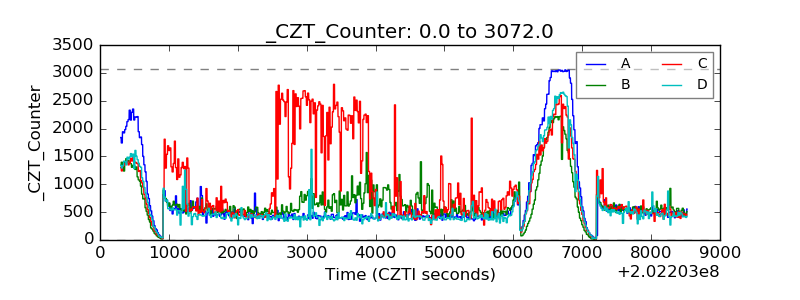 |
| +2.5 Volts monitor |  |
| +5 Volts monitor | 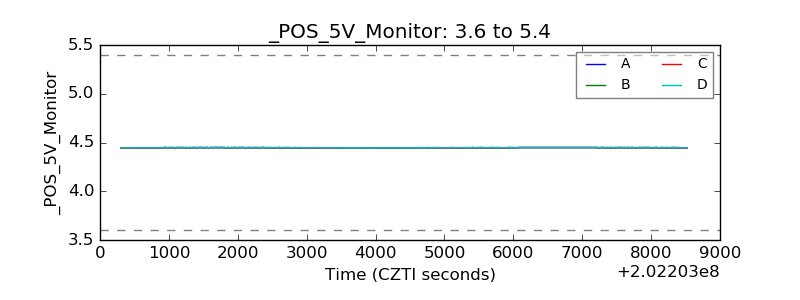 |
| Veto Counter | 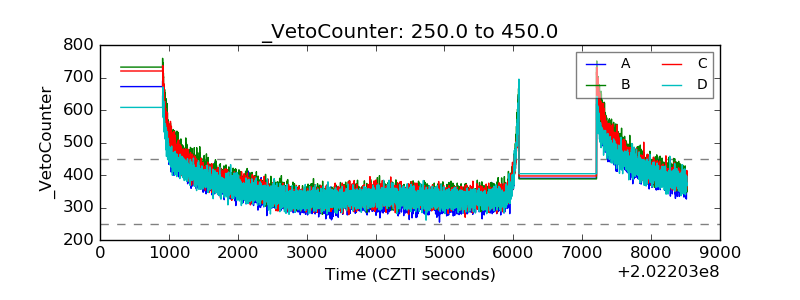 |