| Param | Original file | Final file |
|---|---|---|
| Filename | modeM0/AS1G05_234T02_9000000474_03617cztM0_level2.evt | modeM0/AS1G05_234T02_9000000474_03617cztM0_level2_quad_clean.evt |
| Size (bytes) | 477,028,800 | 90,838,080 |
| Size | 454.9 MB | 86.6 MB |
| Events in quadrant A | 3,254,368 | 584,717 |
| Events in quadrant B | 3,829,641 | 581,356 |
| Events in quadrant C | 3,569,567 | 567,196 |
| Events in quadrant D | 3,344,965 | 557,446 |
| Mode M9 | |||
|---|---|---|---|
| Quadrant | BADHDUFLAG | Total packets | Discarded packets |
| A | 0 | 12 | 0 |
| B | 0 | 12 | 0 |
| C | 0 | 12 | 0 |
| D | 0 | 12 | 0 |
| Mode SS | |||
|---|---|---|---|
| Quadrant | BADHDUFLAG | Total packets | Discarded packets |
| A | 0 | 134 | 0 |
| B | 0 | 134 | 0 |
| C | 0 | 134 | 0 |
| D | 0 | 134 | 0 |
| Mode M0 | |||
|---|---|---|---|
| Quadrant | BADHDUFLAG | Total packets | Discarded packets |
| A | 0 | 14014 | 3 |
| B | 0 | 15473 | 2 |
| C | 0 | 15192 | 2 |
| D | 0 | 14481 | 2 |
| Quadrant | Total seconds | Saturated seconds | Saturation percentage |
|---|---|---|---|
| A | 6599 | 131 | 1.985149% |
| B | 6599 | 110 | 1.666919% |
| C | 6599 | 136 | 2.060918% |
| D | 6599 | 154 | 2.333687% |
Noise dominated data is calculated using 1-second bins in cleaned event files. If a bin has >2000 counts, and if more than 50% of those come from <1% of pixels, then it is considered to be noise-dominated and hence unusable.
| Quadrant | # 1 sec bins | Bins with >0 counts | Bins with >2000 counts | High rate bins dominated by noise | Noise dominated (total time) | Noise dominated (detector-on time) | Marked lightcurve |
|---|---|---|---|---|---|---|---|
| A | 7774 | 6600 | 15 | 15 | 0.19% | 0.23% | 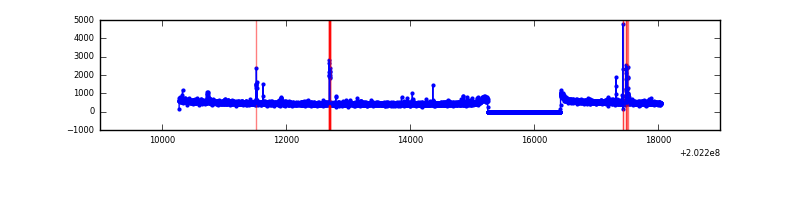 |
| B | 7774 | 6600 | 4 | 4 | 0.05% | 0.06% |  |
| C | 7774 | 6600 | 33 | 33 | 0.42% | 0.50% |  |
| D | 7774 | 6600 | 62 | 62 | 0.80% | 0.94% |  |
Top three noisy pixels from each quadrant. If the there are fewer than three noisy pixels in the level2.evt file, extra rows are filled as -1
| Pixel properties | Quadrant properties | ||||||
|---|---|---|---|---|---|---|---|
| Quadrant | DetID | PixID | Counts | Sigma | Mean | Median | Sigma |
| A | 0 | 50 | 75910 | 459.33 | 807 | 791 | 163.5 |
| A | 0 | 128 | 20225 | 118.83 | 807 | 791 | 163.5 |
| A | 3 | 1 | 16059 | 93.36 | 807 | 791 | 163.5 |
| B | 3 | 0 | 347483 | 2242.9 | 809 | 791 | 154.6 |
| B | 15 | 204 | 162968 | 1049.19 | 809 | 791 | 154.6 |
| B | 4 | 81 | 50636 | 322.47 | 809 | 791 | 154.6 |
| C | 9 | 247 | 289342 | 1620.76 | 772 | 774 | 178.0 |
| C | 2 | 53 | 222705 | 1246.49 | 772 | 774 | 178.0 |
| C | 1 | 16 | 14210 | 75.46 | 772 | 774 | 178.0 |
| D | 13 | 223 | 160261 | 862.02 | 777 | 756 | 185.0 |
| D | 13 | 46 | 113476 | 609.18 | 777 | 756 | 185.0 |
| D | 5 | 233 | 36792 | 194.75 | 777 | 756 | 185.0 |
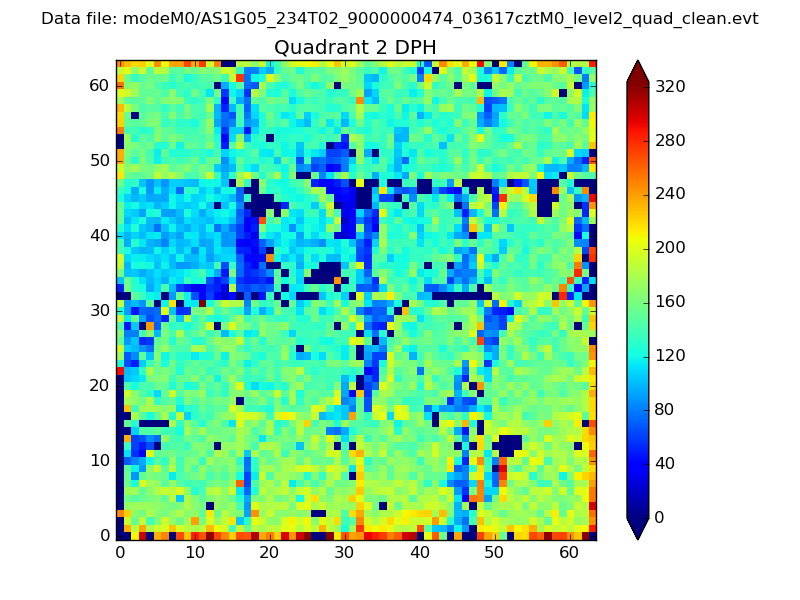
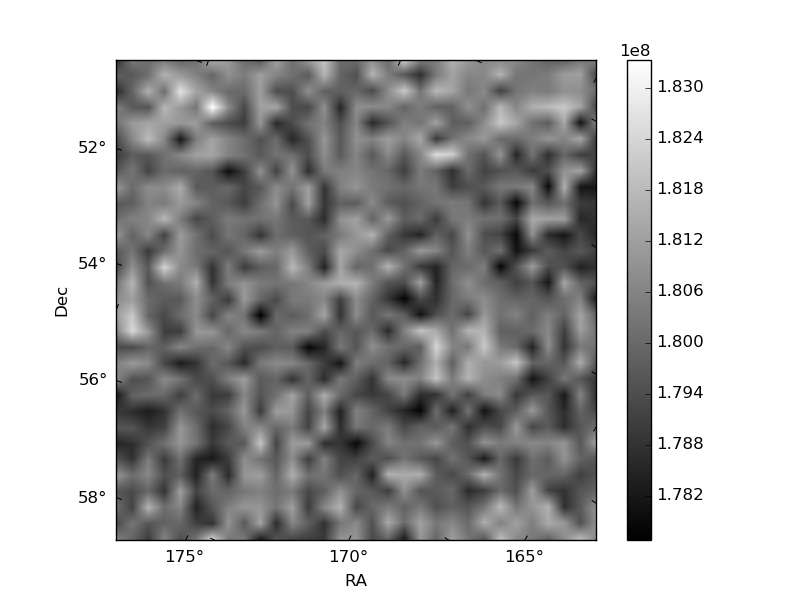
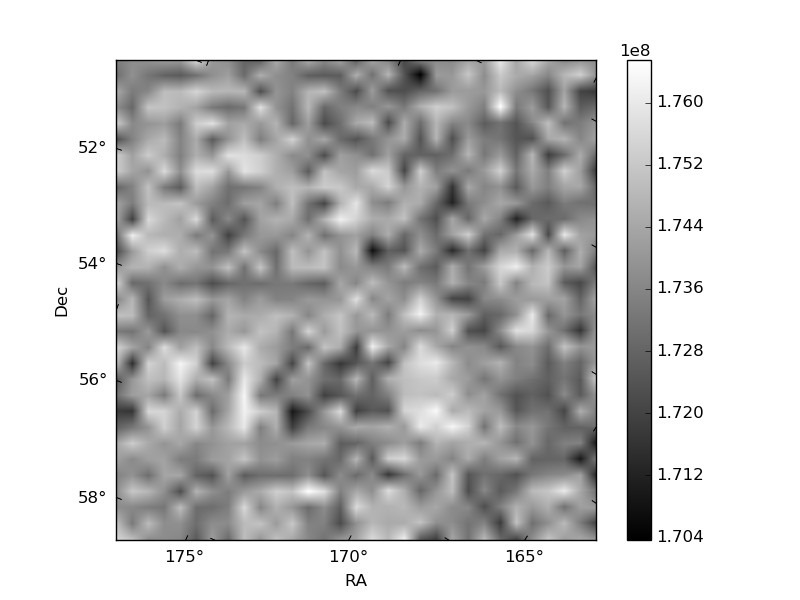
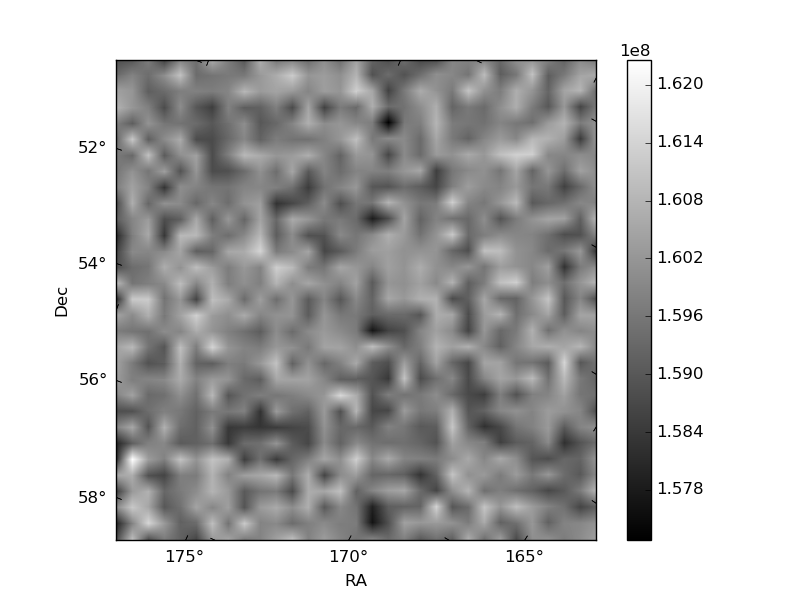
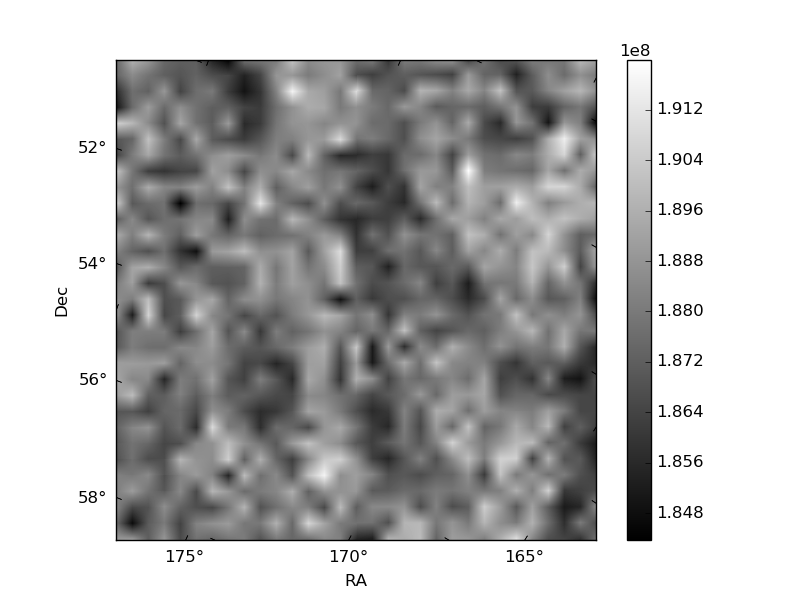
Histogram calculated using DETX and DETY for each event in the final _common_clean file
| Quadrant A | 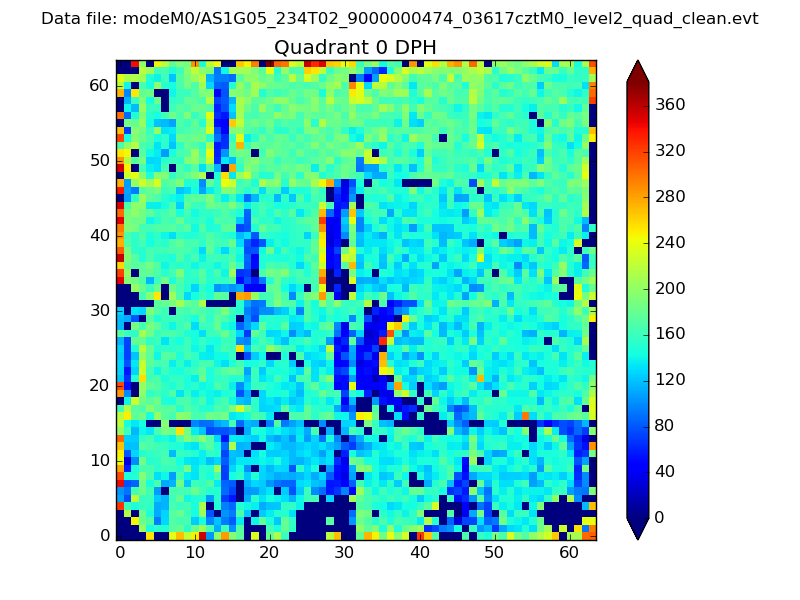 |
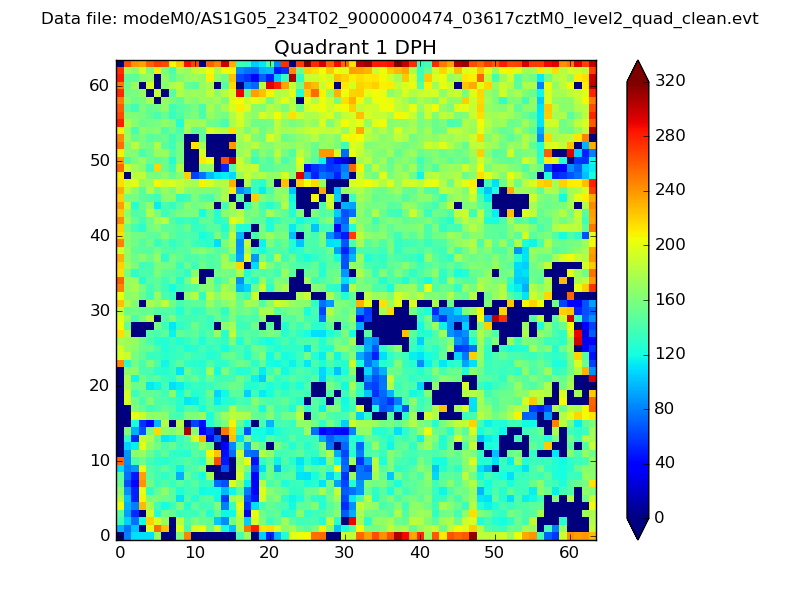 |
Quadrant B |
|---|---|---|---|
| Quadrant D | 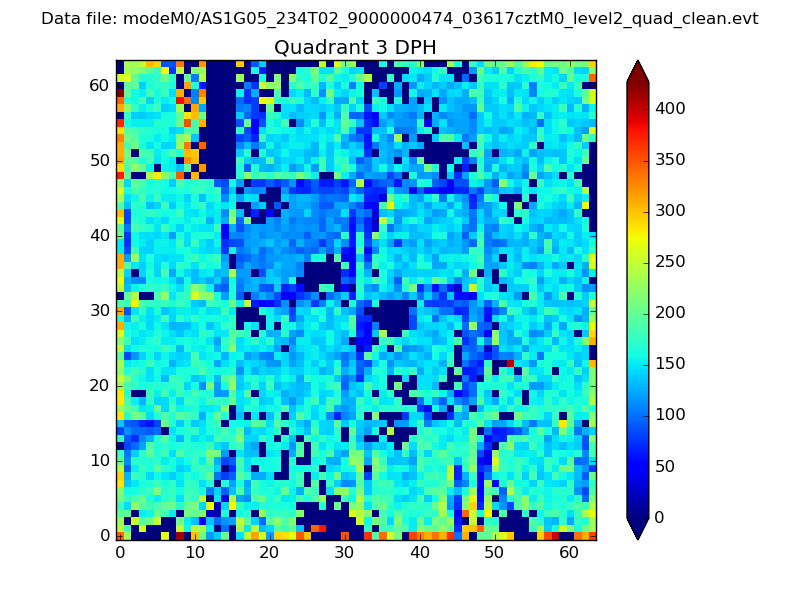 |
 |
Quadrant C |
| Plot type | Count rate plots | Images |
|---|---|---|
| Comparison with Poisson distribution Blue bars denote a histogram of data divided into 1 sec bins. Red curve is a Poisson curve with rate = median count rate of data. |
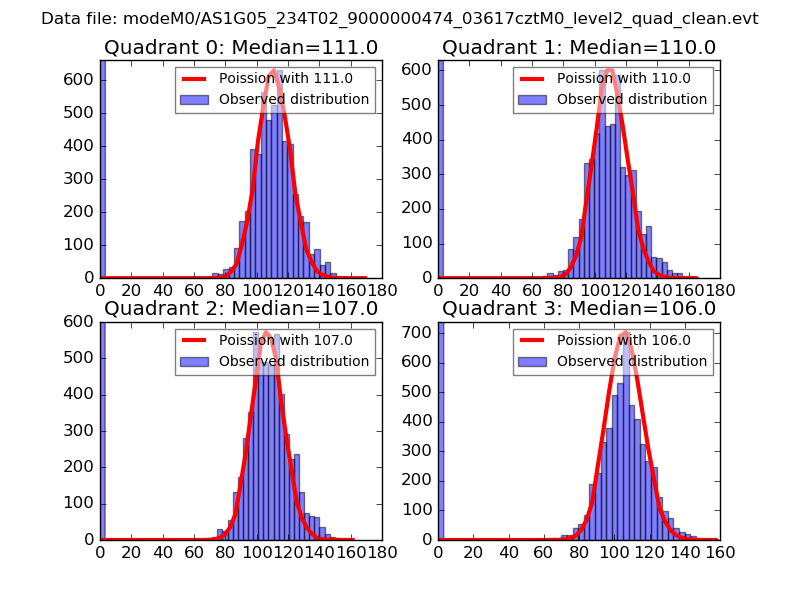 |
 |
| Quadrant-wise count rates Data is divided into 100 sec bins |
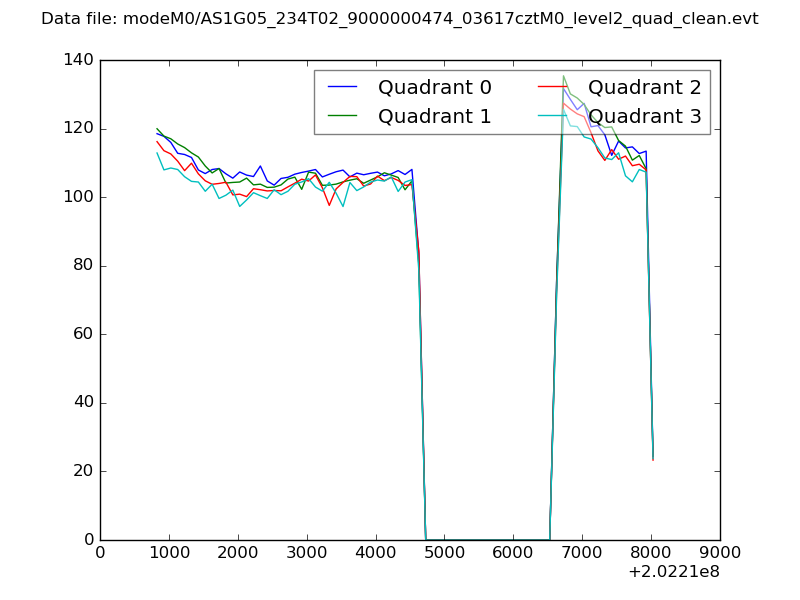 |
|
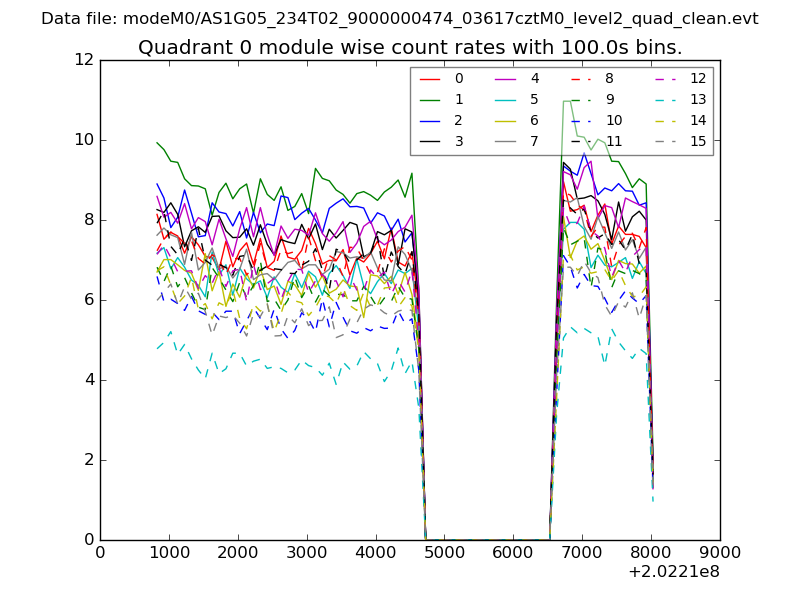
| Module-wise count rates for Quadrant A Data is divided into 100 sec bins |
 |
 |
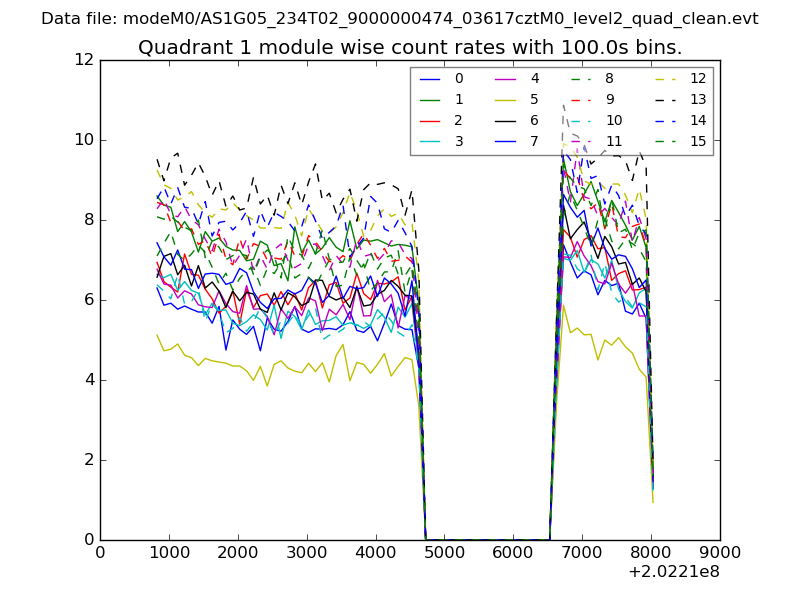
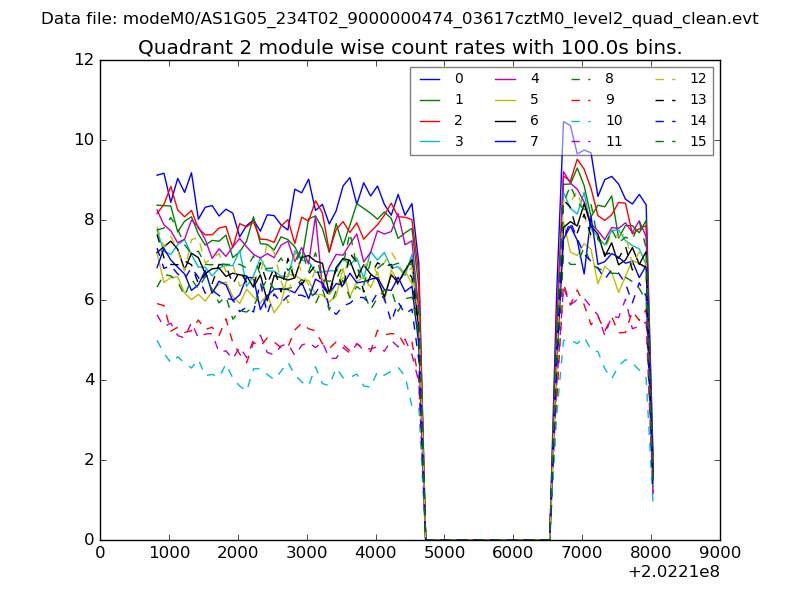
| Module-wise count rates for Quadrant B Data is divided into 100 sec bins |
 |
 |
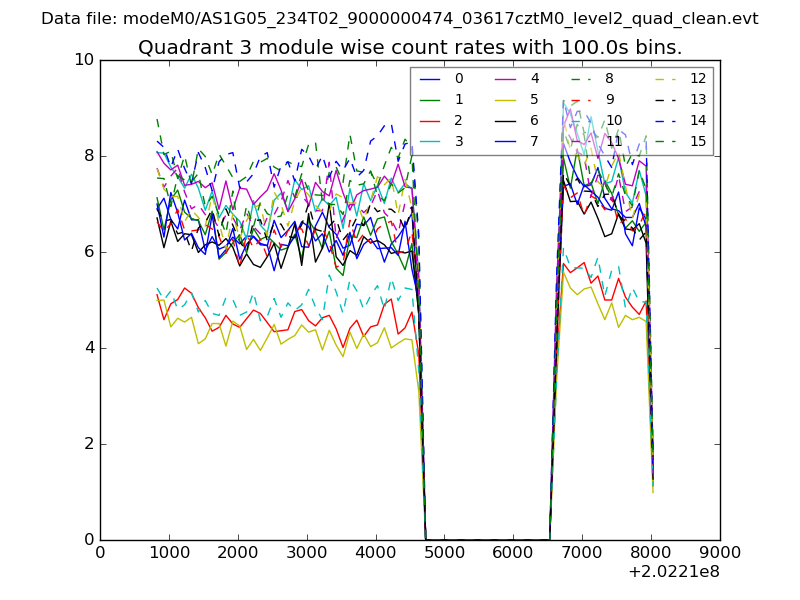
| Module-wise count rates for Quadrant C Data is divided into 100 sec bins |
 |
 |
| Module-wise count rates for Quadrant D Data is divided into 100 sec bins |
 |
 |
| Parameter | Plot |
|---|---|
| CZT HV Monitor | 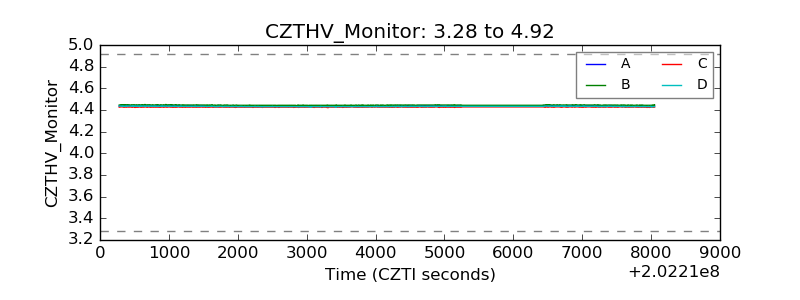 |
| D_VDD | 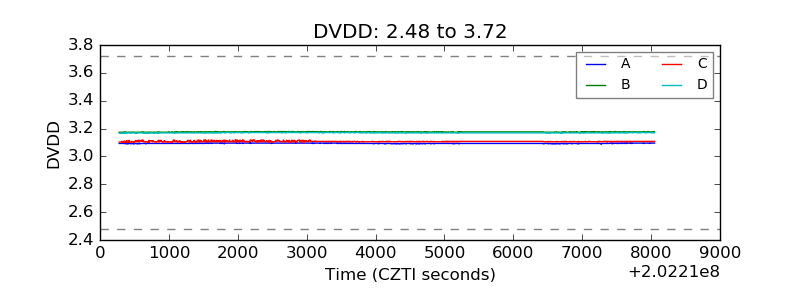 |
| Temperature 1 | 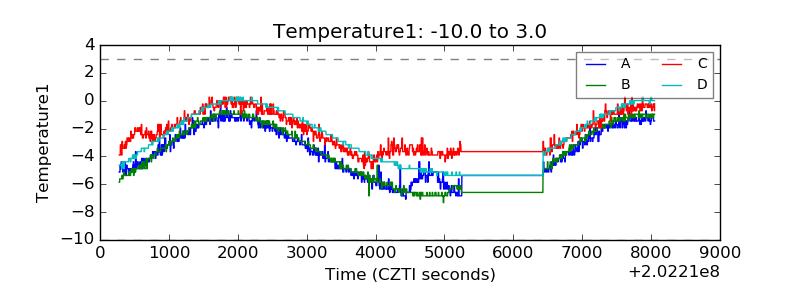 |
| Veto HV Monitor | 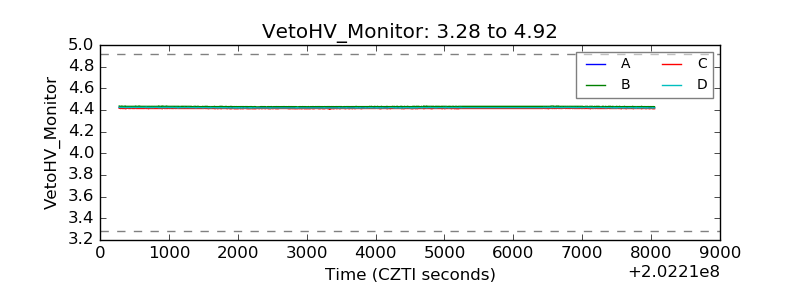 |
| Veto LLD | 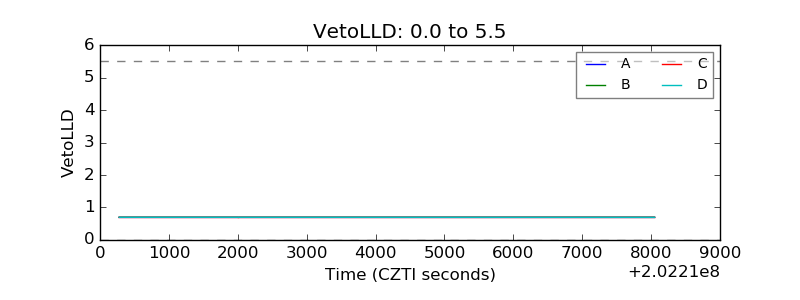 |
| Alpha Counter | 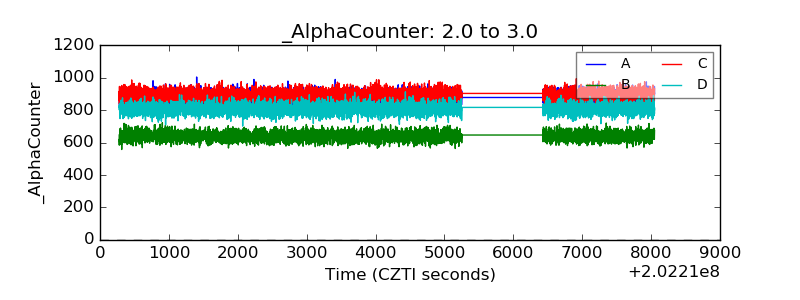 |
| _CPM_Rate | 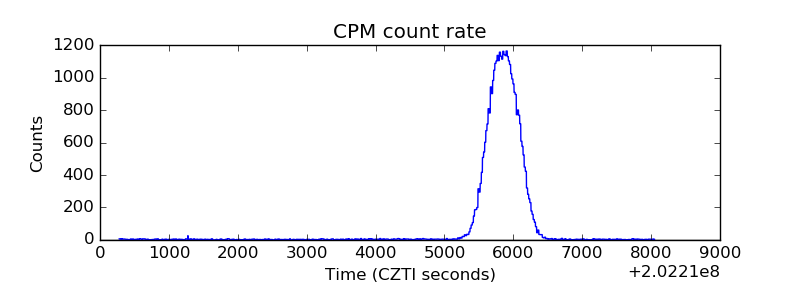 |
| CZT Counter | 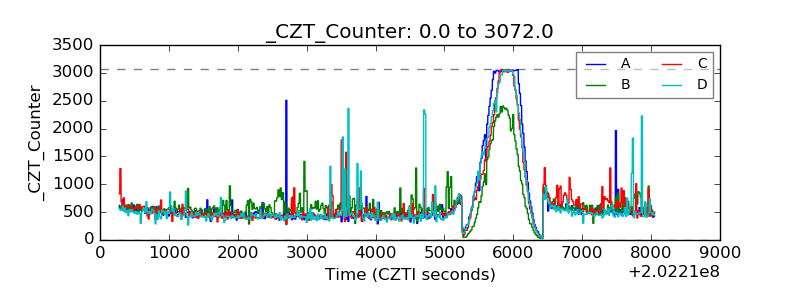 |
| +2.5 Volts monitor |  |
| +5 Volts monitor | 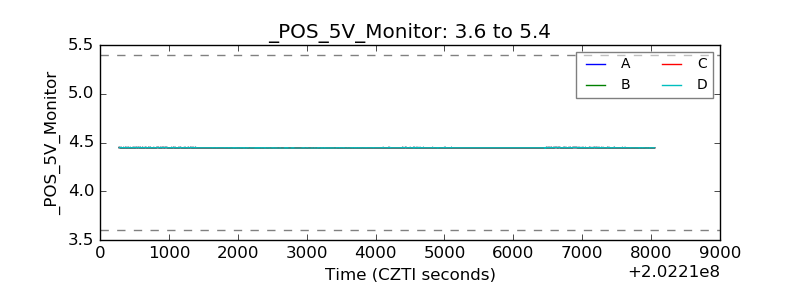 |
| Veto Counter | 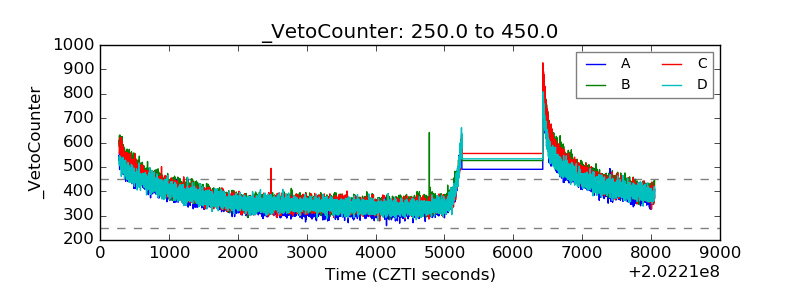 |