| Param | Original file | Final file |
|---|---|---|
| Filename | modeM0/AS1G05_234T02_9000000474_03618cztM0_level2.evt | modeM0/AS1G05_234T02_9000000474_03618cztM0_level2_quad_clean.evt |
| Size (bytes) | 412,551,360 | 85,654,080 |
| Size | 393.4 MB | 81.7 MB |
| Events in quadrant A | 2,746,870 | 558,094 |
| Events in quadrant B | 3,199,807 | 554,634 |
| Events in quadrant C | 3,307,860 | 541,532 |
| Events in quadrant D | 2,845,480 | 534,434 |
| Mode M9 | |||
|---|---|---|---|
| Quadrant | BADHDUFLAG | Total packets | Discarded packets |
| A | 0 | 12 | 0 |
| B | 0 | 12 | 0 |
| C | 0 | 12 | 0 |
| D | 0 | 12 | 0 |
| Mode SS | |||
|---|---|---|---|
| Quadrant | BADHDUFLAG | Total packets | Discarded packets |
| A | 0 | 120 | 0 |
| B | 0 | 120 | 0 |
| C | 0 | 120 | 0 |
| D | 0 | 120 | 0 |
| Mode M0 | |||
|---|---|---|---|
| Quadrant | BADHDUFLAG | Total packets | Discarded packets |
| A | 0 | 12093 | 2 |
| B | 0 | 13326 | 1 |
| C | 0 | 13671 | 1 |
| D | 0 | 12474 | 1 |
| Quadrant | Total seconds | Saturated seconds | Saturation percentage |
|---|---|---|---|
| A | 5789 | 102 | 1.761962% |
| B | 5789 | 100 | 1.727414% |
| C | 5789 | 107 | 1.848333% |
| D | 5789 | 105 | 1.813785% |
Noise dominated data is calculated using 1-second bins in cleaned event files. If a bin has >2000 counts, and if more than 50% of those come from <1% of pixels, then it is considered to be noise-dominated and hence unusable.
| Quadrant | # 1 sec bins | Bins with >0 counts | Bins with >2000 counts | High rate bins dominated by noise | Noise dominated (total time) | Noise dominated (detector-on time) | Marked lightcurve |
|---|---|---|---|---|---|---|---|
| A | 7034 | 5790 | 6 | 6 | 0.09% | 0.10% | 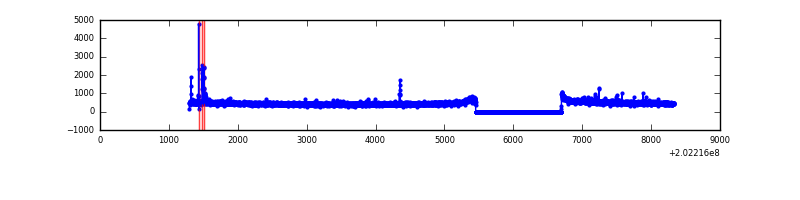 |
| B | 7034 | 5790 | 3 | 3 | 0.04% | 0.05% | 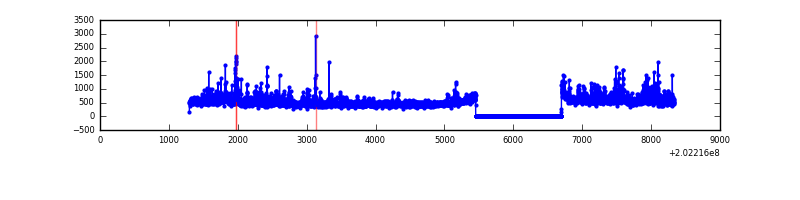 |
| C | 7034 | 5790 | 29 | 29 | 0.41% | 0.50% | 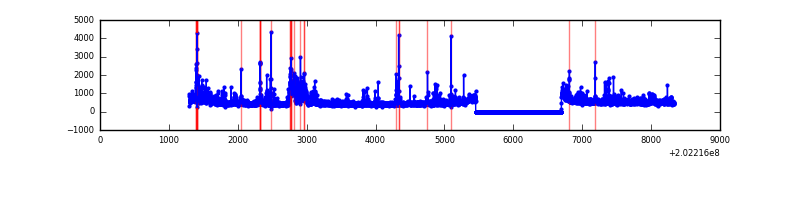 |
| D | 7034 | 5790 | 30 | 30 | 0.43% | 0.52% | 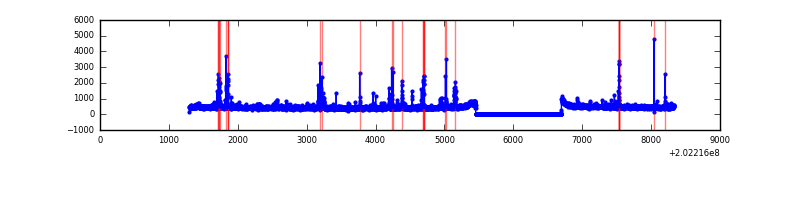 |
Top three noisy pixels from each quadrant. If the there are fewer than three noisy pixels in the level2.evt file, extra rows are filled as -1
| Pixel properties | Quadrant properties | ||||||
|---|---|---|---|---|---|---|---|
| Quadrant | DetID | PixID | Counts | Sigma | Mean | Median | Sigma |
| A | 0 | 50 | 39323 | 273.46 | 694 | 679 | 141.3 |
| A | 12 | 194 | 7636 | 49.23 | 694 | 679 | 141.3 |
| A | 15 | 174 | 7451 | 47.92 | 694 | 679 | 141.3 |
| B | 4 | 81 | 173059 | 1295.98 | 695 | 678 | 133.0 |
| B | 15 | 204 | 133363 | 997.54 | 695 | 678 | 133.0 |
| B | 0 | 182 | 46542 | 344.81 | 695 | 678 | 133.0 |
| C | 2 | 53 | 429140 | 2751.46 | 671 | 673 | 155.7 |
| C | 9 | 247 | 248680 | 1592.61 | 671 | 673 | 155.7 |
| C | 13 | 61 | 5740 | 32.54 | 671 | 673 | 155.7 |
| D | 13 | 223 | 126913 | 786.74 | 675 | 657 | 160.5 |
| D | 13 | 239 | 41490 | 254.44 | 675 | 657 | 160.5 |
| D | 1 | 20 | 32606 | 199.08 | 675 | 657 | 160.5 |
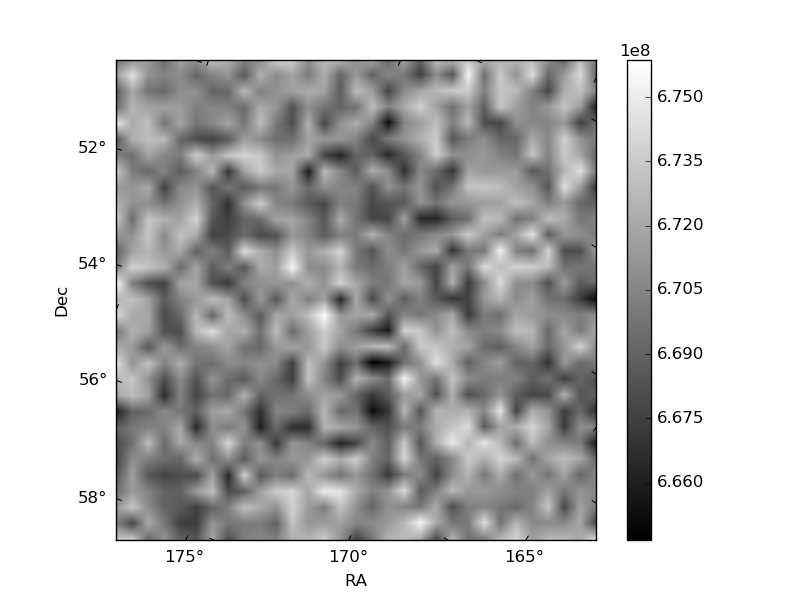
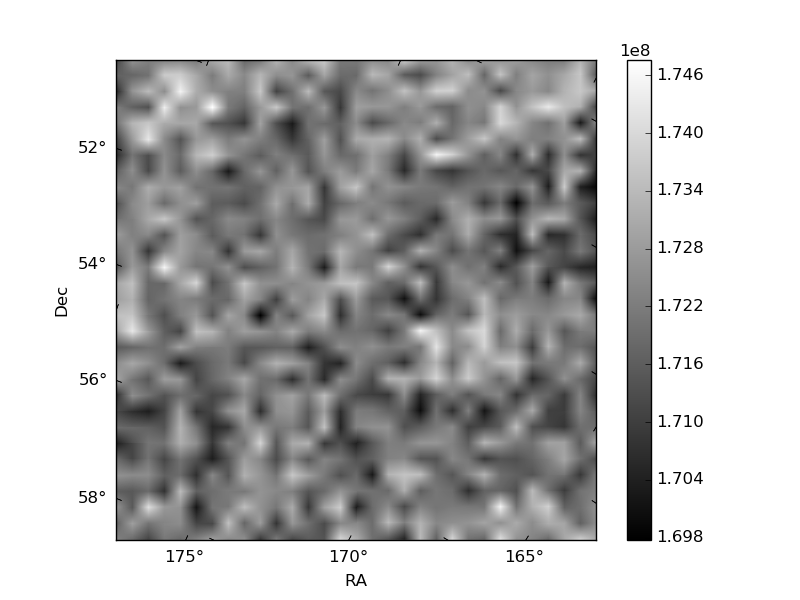
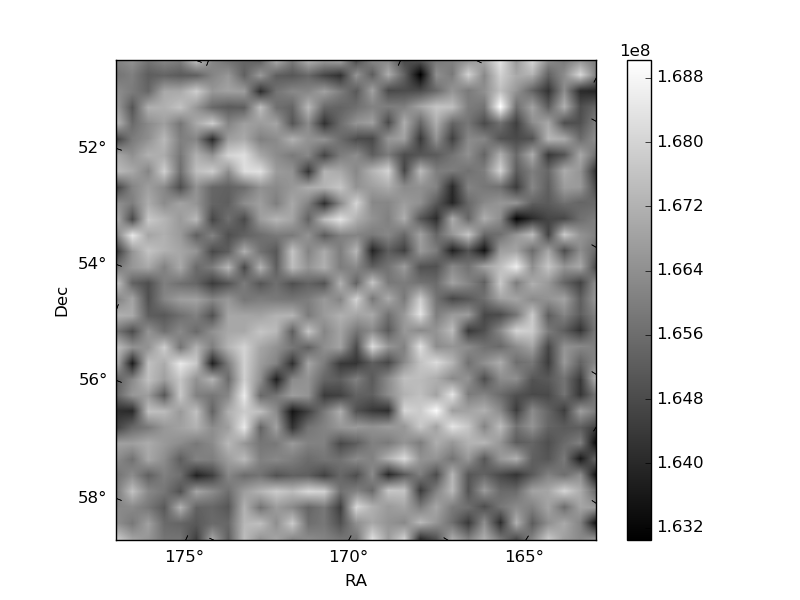
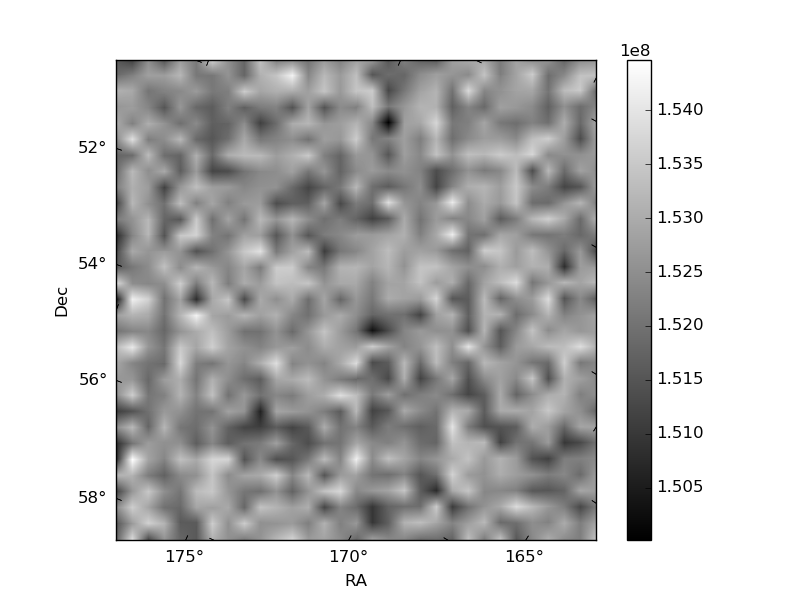
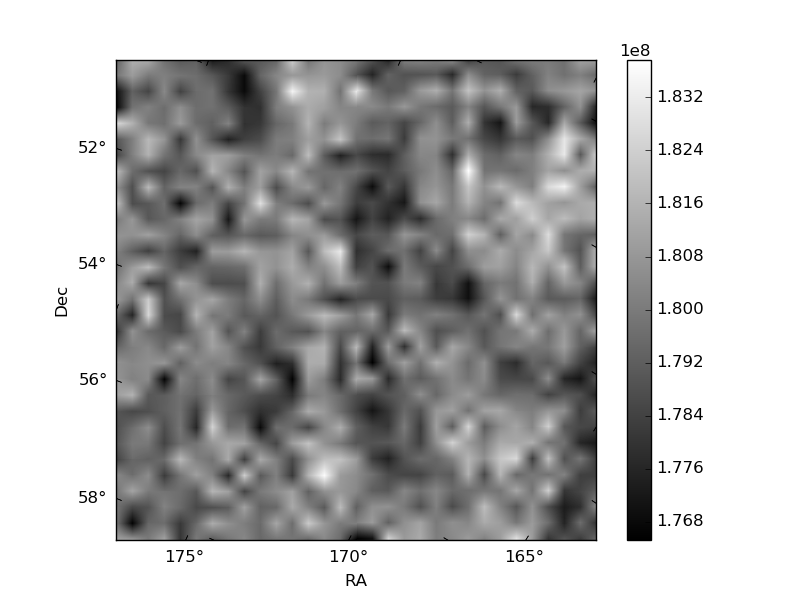
Histogram calculated using DETX and DETY for each event in the final _common_clean file
| Quadrant A | 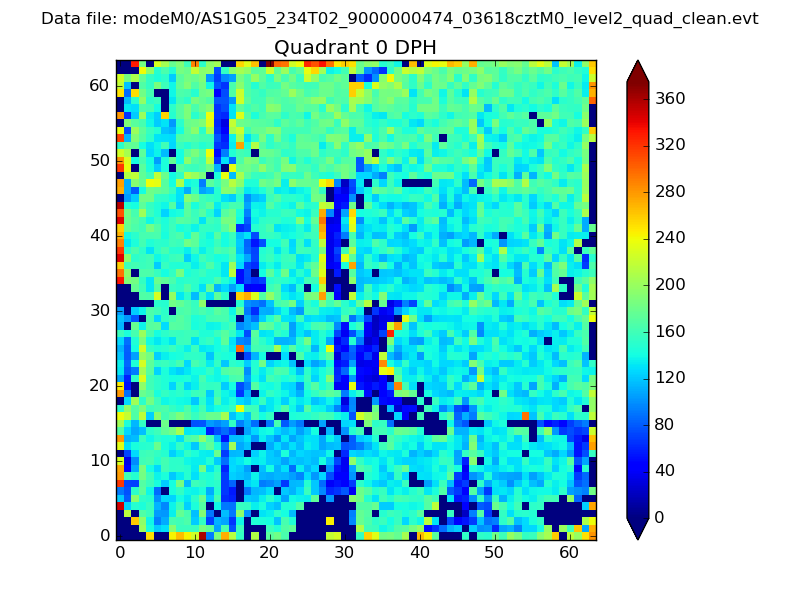 |
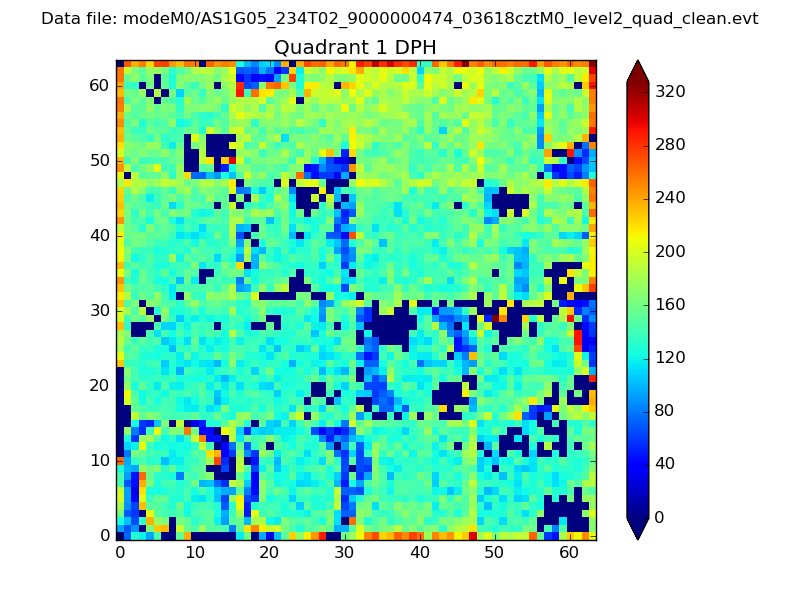 |
Quadrant B |
|---|---|---|---|
| Quadrant D | 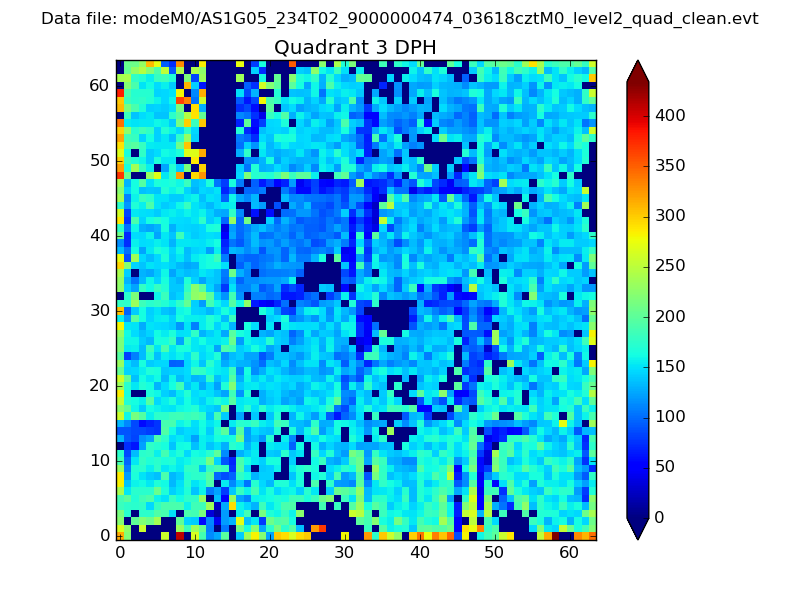 |
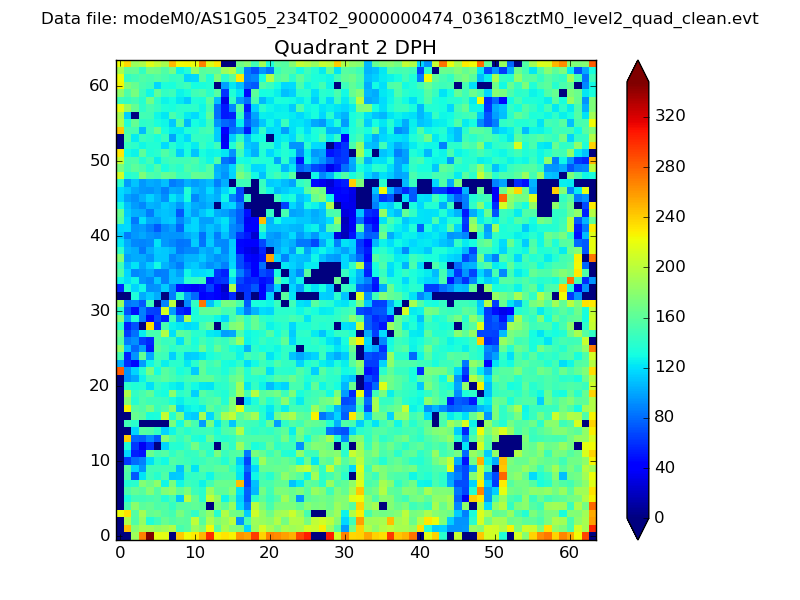 |
Quadrant C |
| Plot type | Count rate plots | Images |
|---|---|---|
| Comparison with Poisson distribution Blue bars denote a histogram of data divided into 1 sec bins. Red curve is a Poisson curve with rate = median count rate of data. |
 |
 |
| Quadrant-wise count rates Data is divided into 100 sec bins |
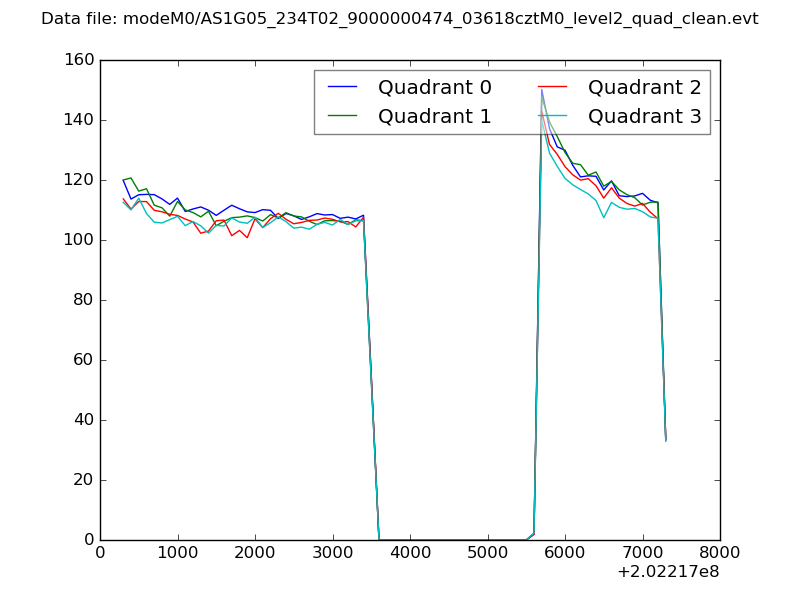 |
|
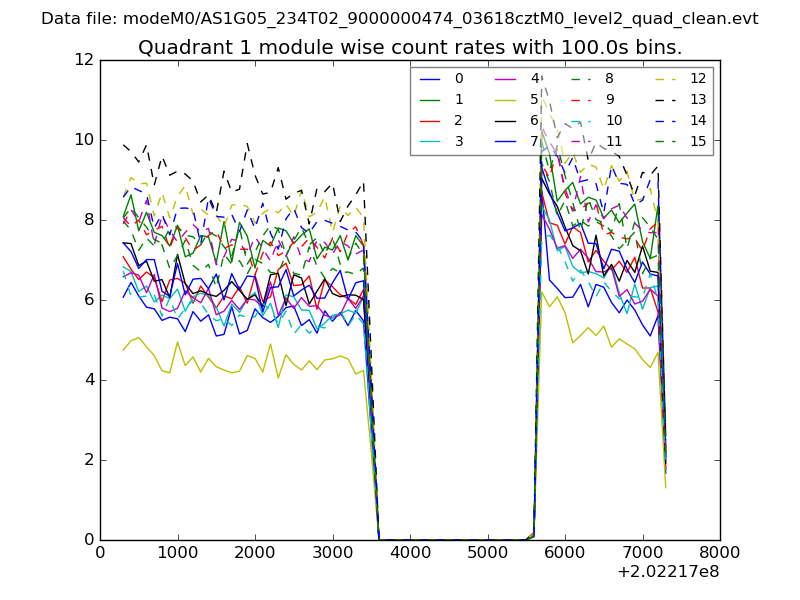
| Module-wise count rates for Quadrant A Data is divided into 100 sec bins |
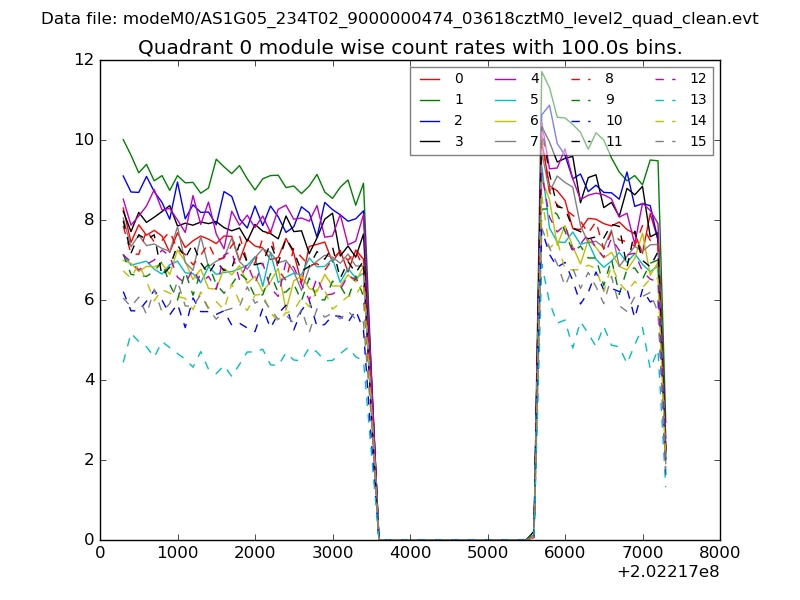 |
 |
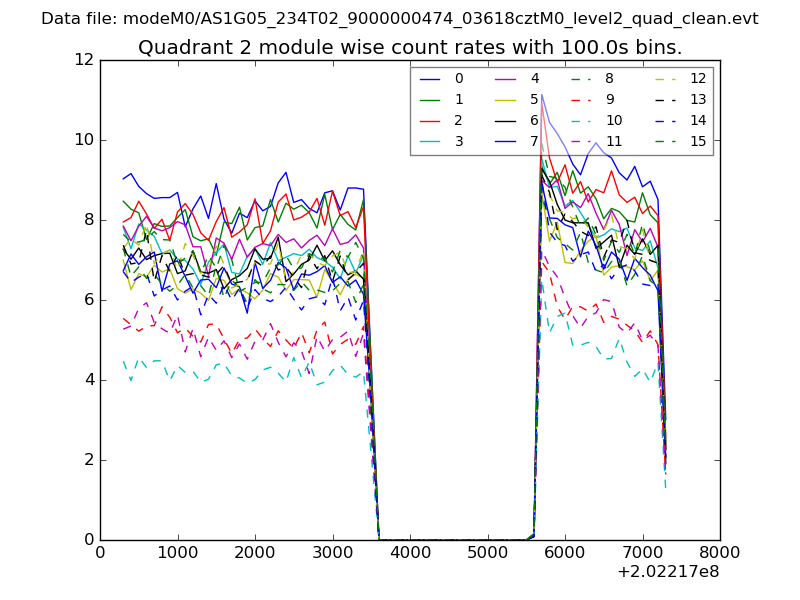
| Module-wise count rates for Quadrant B Data is divided into 100 sec bins |
 |
 |
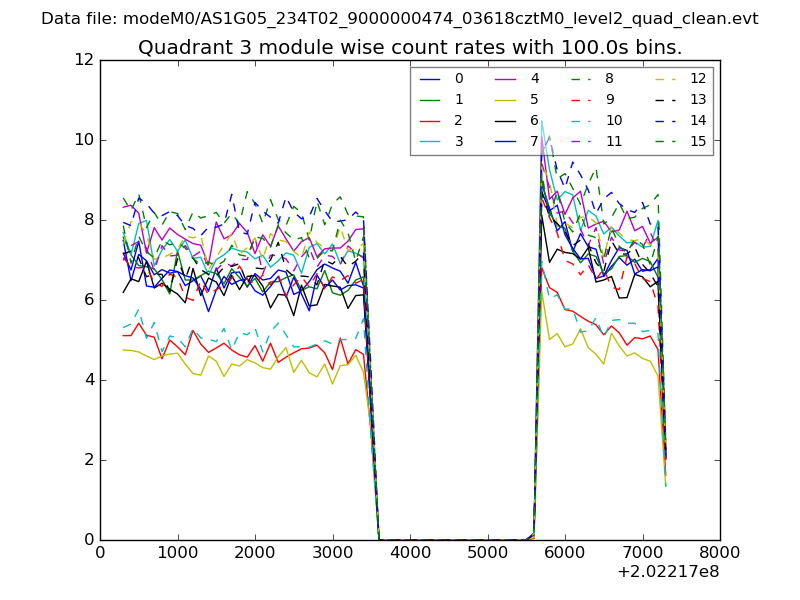
| Module-wise count rates for Quadrant C Data is divided into 100 sec bins |
 |
 |
| Module-wise count rates for Quadrant D Data is divided into 100 sec bins |
 |
 |
| Parameter | Plot |
|---|---|
| CZT HV Monitor | 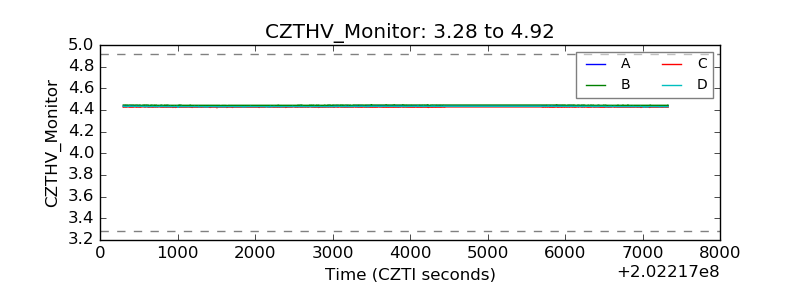 |
| D_VDD | 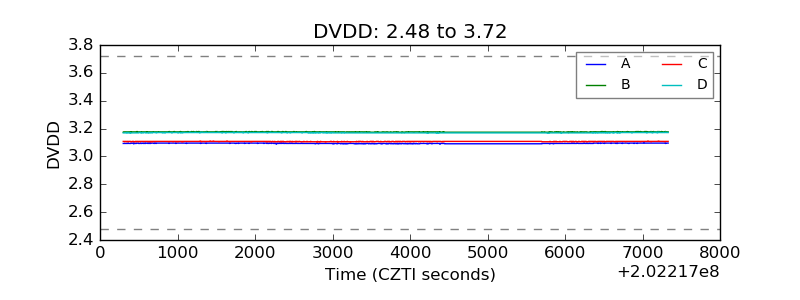 |
| Temperature 1 | 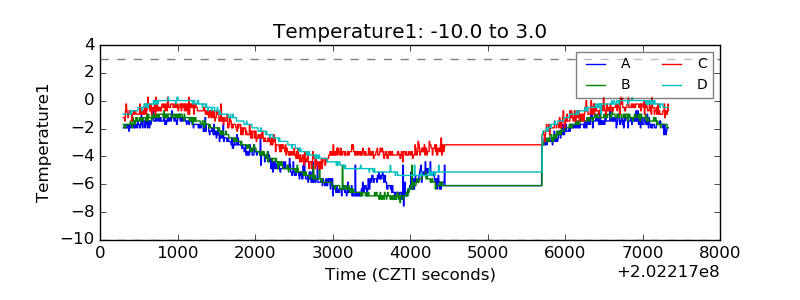 |
| Veto HV Monitor | 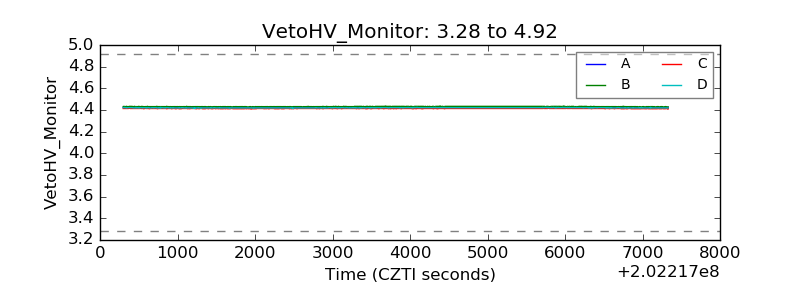 |
| Veto LLD | 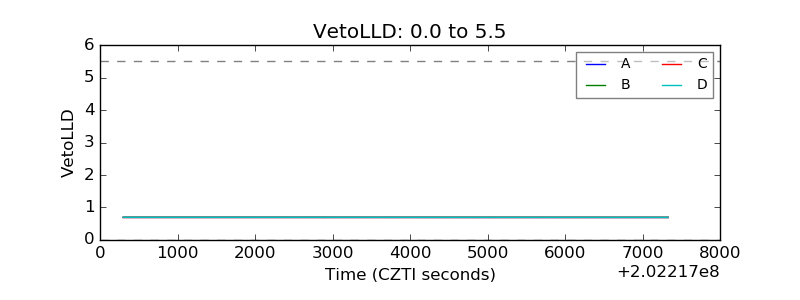 |
| Alpha Counter | 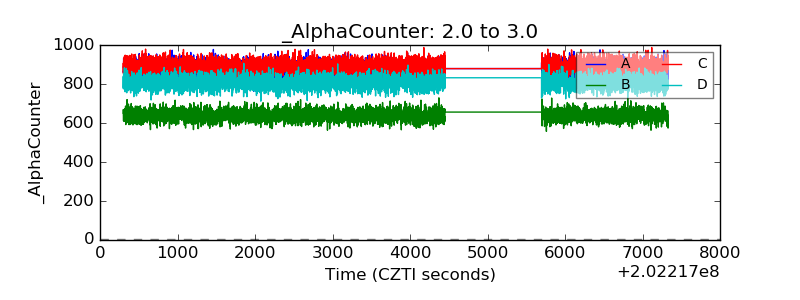 |
| _CPM_Rate | 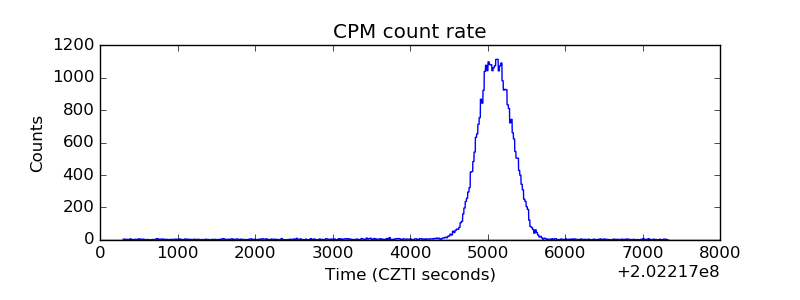 |
| CZT Counter | 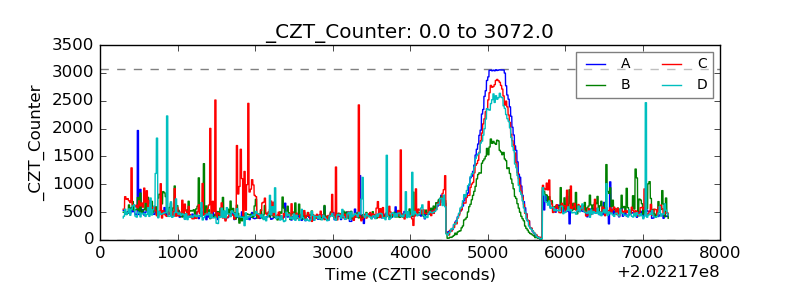 |
| +2.5 Volts monitor |  |
| +5 Volts monitor |  |
| Veto Counter | 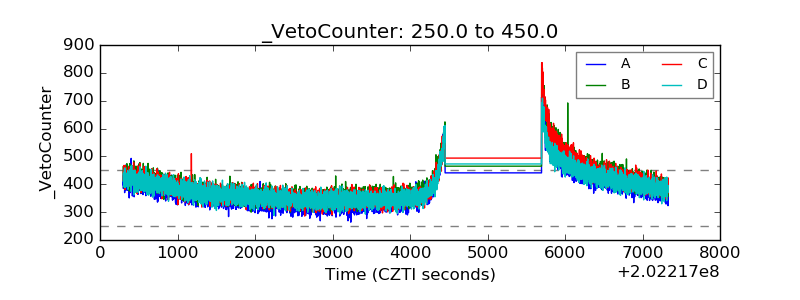 |