| Param | Original file | Final file |
|---|---|---|
| Filename | modeM0/AS1G05_234T02_9000000474_03619cztM0_level2.evt | modeM0/AS1G05_234T02_9000000474_03619cztM0_level2_quad_clean.evt |
| Size (bytes) | 408,303,360 | 80,369,280 |
| Size | 389.4 MB | 76.6 MB |
| Events in quadrant A | 2,794,650 | 512,413 |
| Events in quadrant B | 3,084,502 | 511,245 |
| Events in quadrant C | 3,241,275 | 503,622 |
| Events in quadrant D | 2,843,875 | 494,318 |
| Mode M9 | |||
|---|---|---|---|
| Quadrant | BADHDUFLAG | Total packets | Discarded packets |
| A | 0 | 13 | 0 |
| B | 0 | 13 | 0 |
| C | 0 | 13 | 0 |
| D | 0 | 13 | 0 |
| Mode SS | |||
|---|---|---|---|
| Quadrant | BADHDUFLAG | Total packets | Discarded packets |
| A | 0 | 120 | 0 |
| B | 0 | 120 | 0 |
| C | 0 | 120 | 0 |
| D | 0 | 120 | 0 |
| Mode M0 | |||
|---|---|---|---|
| Quadrant | BADHDUFLAG | Total packets | Discarded packets |
| A | 0 | 12369 | 2 |
| B | 0 | 13085 | 1 |
| C | 0 | 13591 | 1 |
| D | 0 | 12595 | 1 |
| Quadrant | Total seconds | Saturated seconds | Saturation percentage |
|---|---|---|---|
| A | 5897 | 75 | 1.271833% |
| B | 5897 | 45 | 0.763100% |
| C | 5897 | 97 | 1.644904% |
| D | 5897 | 74 | 1.254875% |
Noise dominated data is calculated using 1-second bins in cleaned event files. If a bin has >2000 counts, and if more than 50% of those come from <1% of pixels, then it is considered to be noise-dominated and hence unusable.
| Quadrant | # 1 sec bins | Bins with >0 counts | Bins with >2000 counts | High rate bins dominated by noise | Noise dominated (total time) | Noise dominated (detector-on time) | Marked lightcurve |
|---|---|---|---|---|---|---|---|
| A | 7177 | 5898 | 8 | 8 | 0.11% | 0.14% | 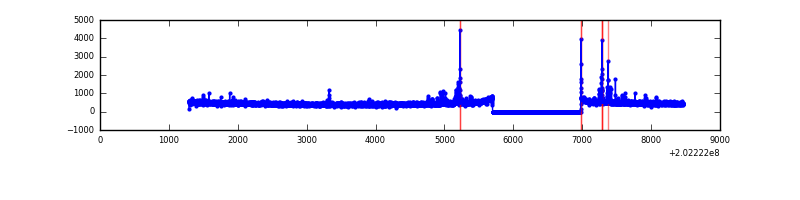 |
| B | 7177 | 5898 | 3 | 3 | 0.04% | 0.05% | 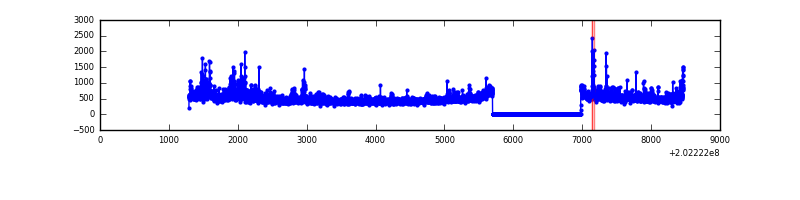 |
| C | 7177 | 5898 | 54 | 54 | 0.75% | 0.92% | 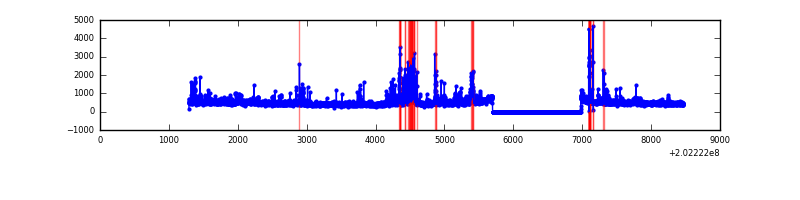 |
| D | 7177 | 5898 | 24 | 24 | 0.33% | 0.41% | 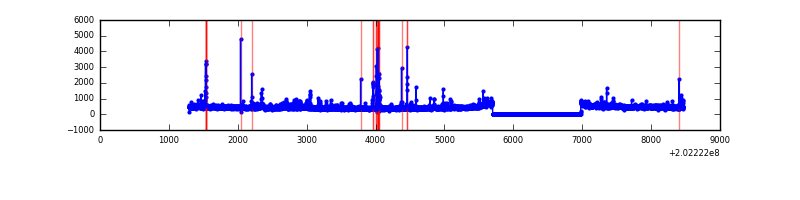 |
Top three noisy pixels from each quadrant. If the there are fewer than three noisy pixels in the level2.evt file, extra rows are filled as -1
| Pixel properties | Quadrant properties | ||||||
|---|---|---|---|---|---|---|---|
| Quadrant | DetID | PixID | Counts | Sigma | Mean | Median | Sigma |
| A | 0 | 50 | 94382 | 673.11 | 688 | 673 | 139.2 |
| A | 14 | 191 | 13598 | 92.84 | 688 | 673 | 139.2 |
| A | 0 | 31 | 12568 | 85.44 | 688 | 673 | 139.2 |
| B | 15 | 204 | 129920 | 972.47 | 696 | 680 | 132.9 |
| B | 4 | 81 | 97150 | 725.89 | 696 | 680 | 132.9 |
| B | 0 | 182 | 43122 | 319.36 | 696 | 680 | 132.9 |
| C | 9 | 247 | 336420 | 2155.74 | 672 | 674 | 155.7 |
| C | 2 | 53 | 266955 | 1709.72 | 672 | 674 | 155.7 |
| C | 13 | 61 | 5624 | 31.78 | 672 | 674 | 155.7 |
| D | 13 | 223 | 94940 | 585.16 | 676 | 657 | 161.1 |
| D | 8 | 195 | 42214 | 257.92 | 676 | 657 | 161.1 |
| D | 13 | 46 | 29149 | 176.83 | 676 | 657 | 161.1 |
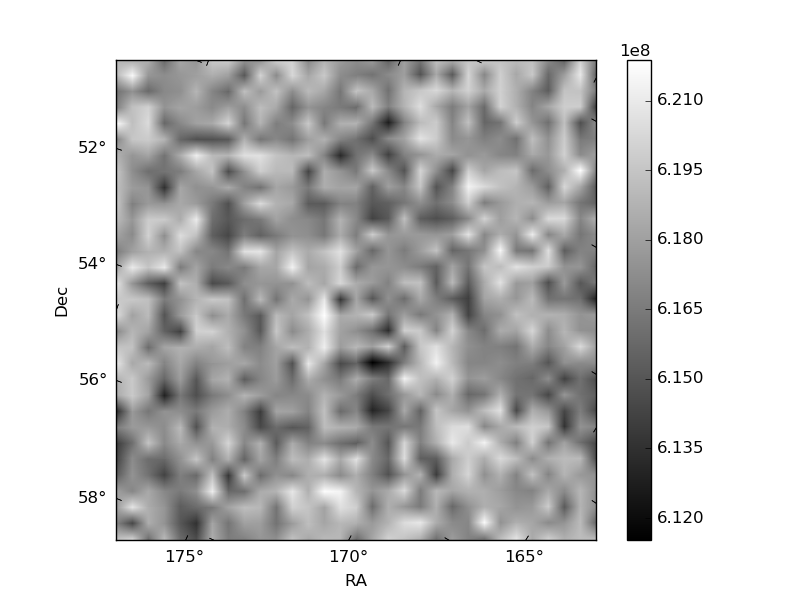
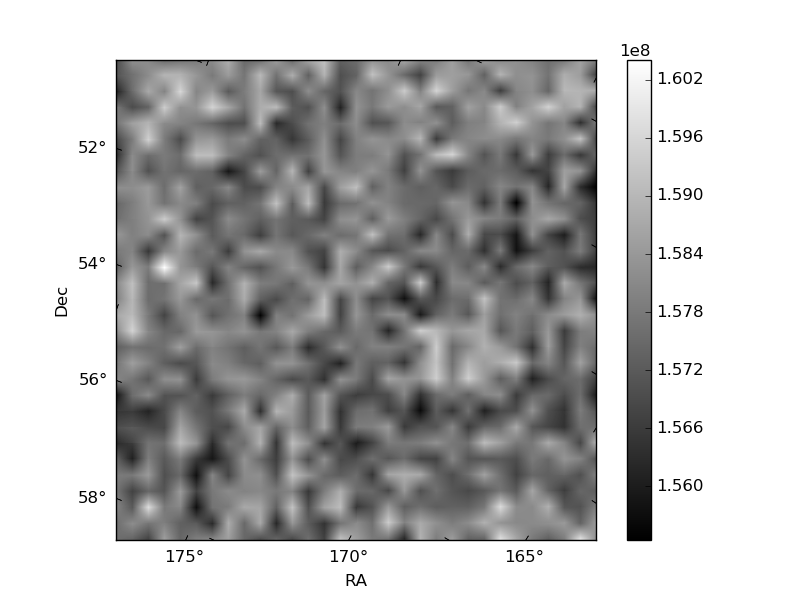
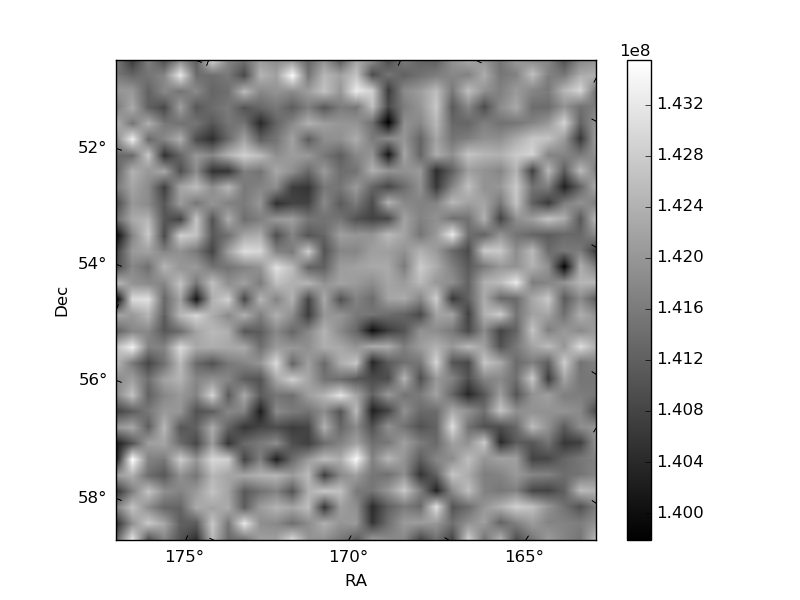
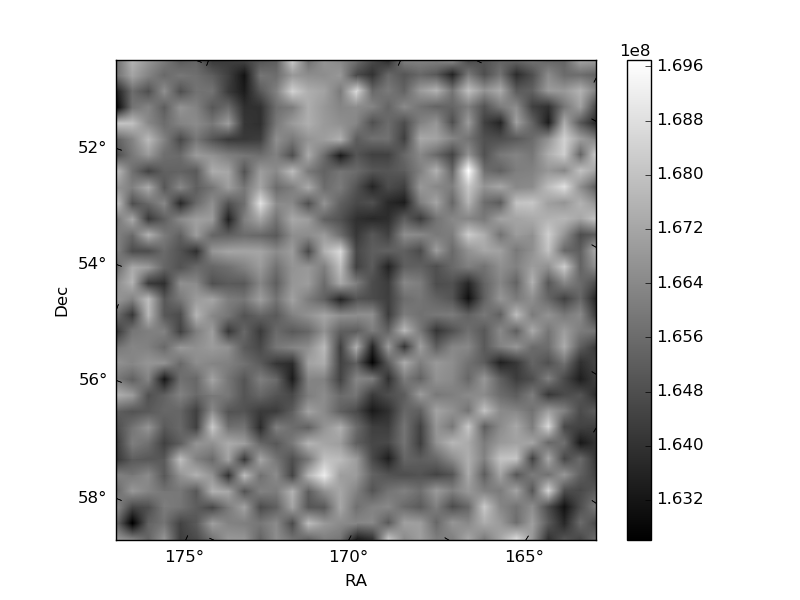
Histogram calculated using DETX and DETY for each event in the final _common_clean file
| Quadrant A | 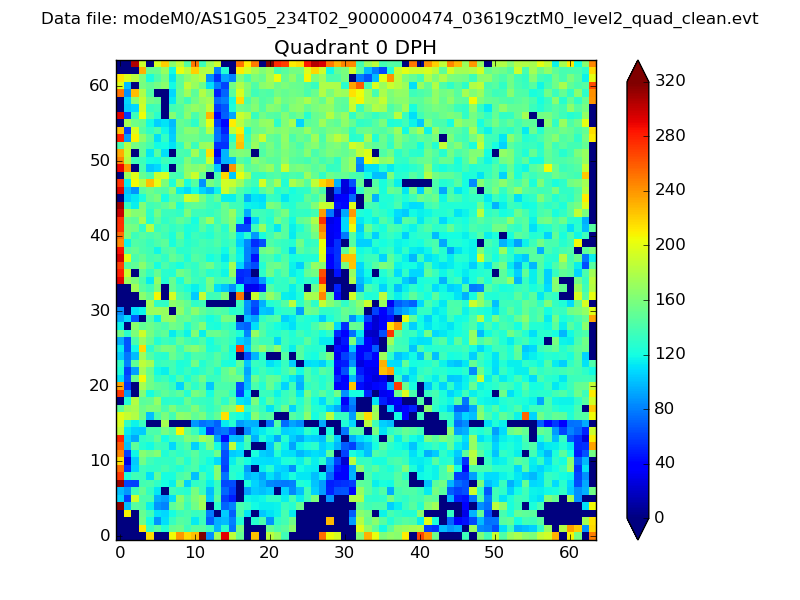 |
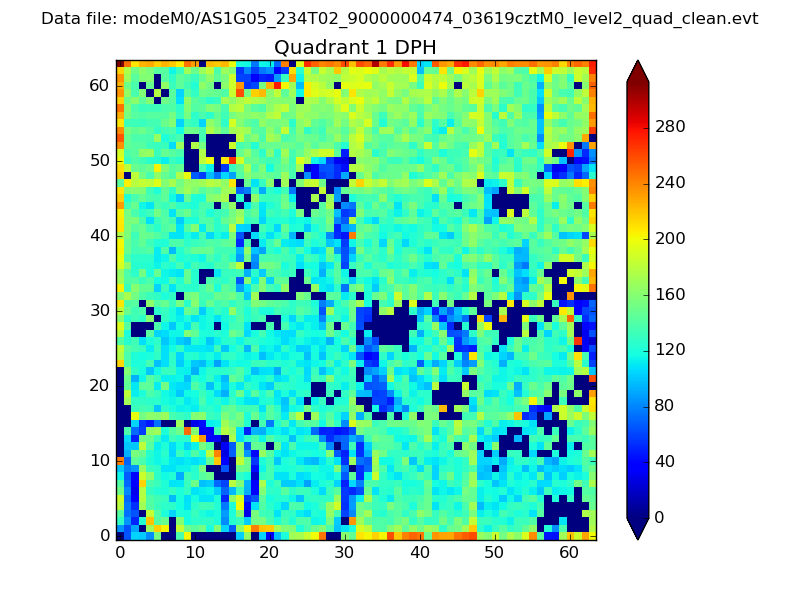 |
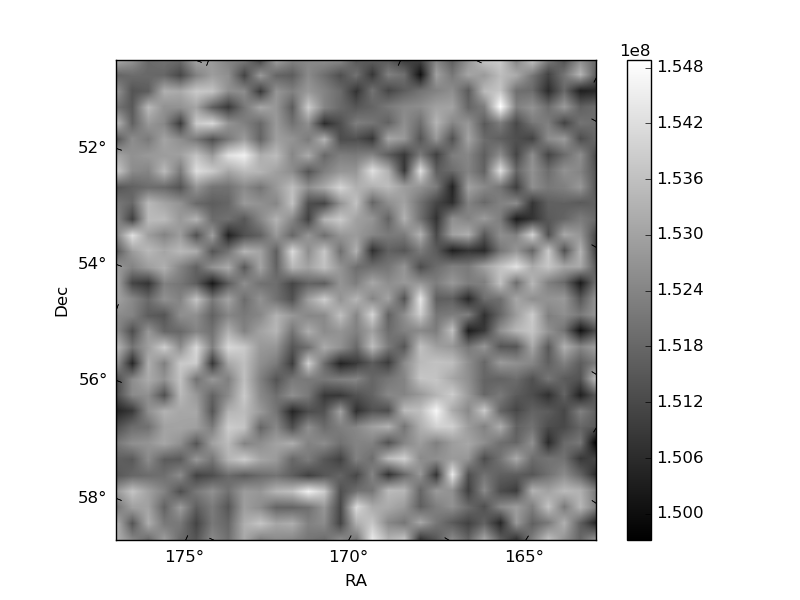
Quadrant B |
|---|---|---|---|
| Quadrant D | 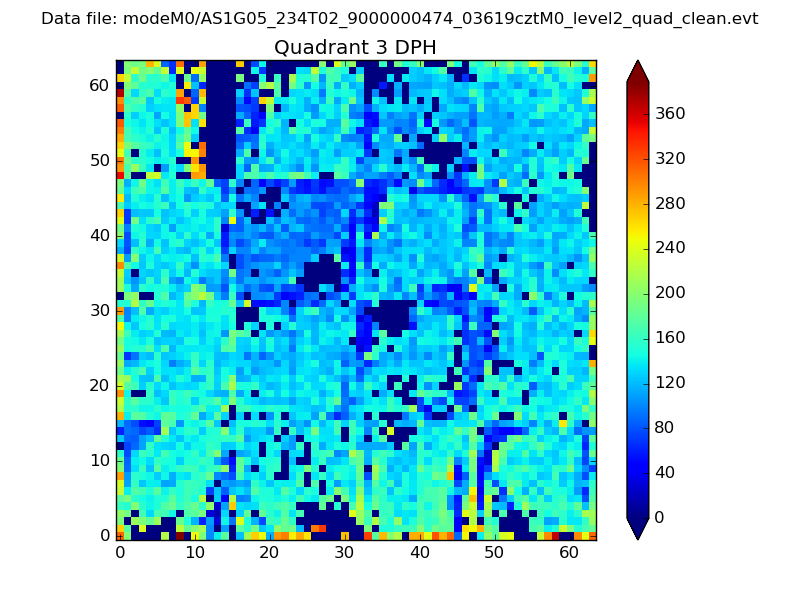 |
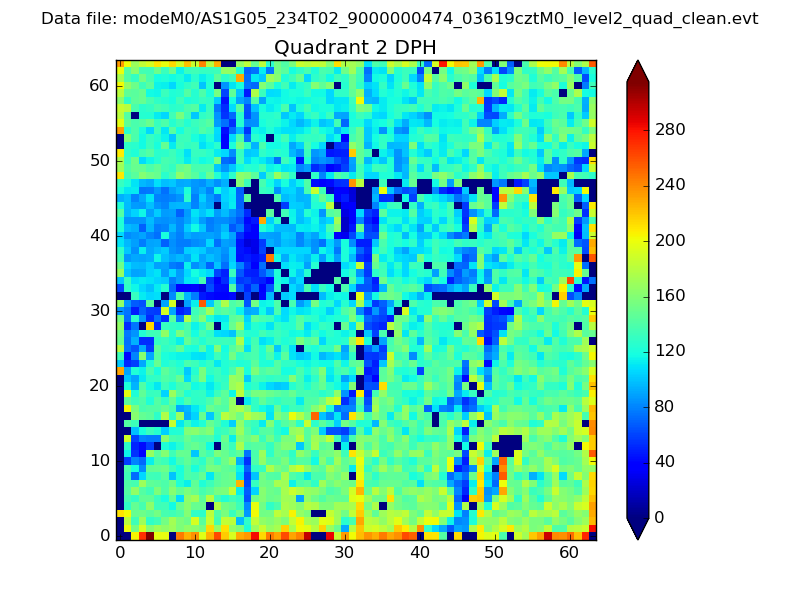 |
Quadrant C |
| Plot type | Count rate plots | Images |
|---|---|---|
| Comparison with Poisson distribution Blue bars denote a histogram of data divided into 1 sec bins. Red curve is a Poisson curve with rate = median count rate of data. |
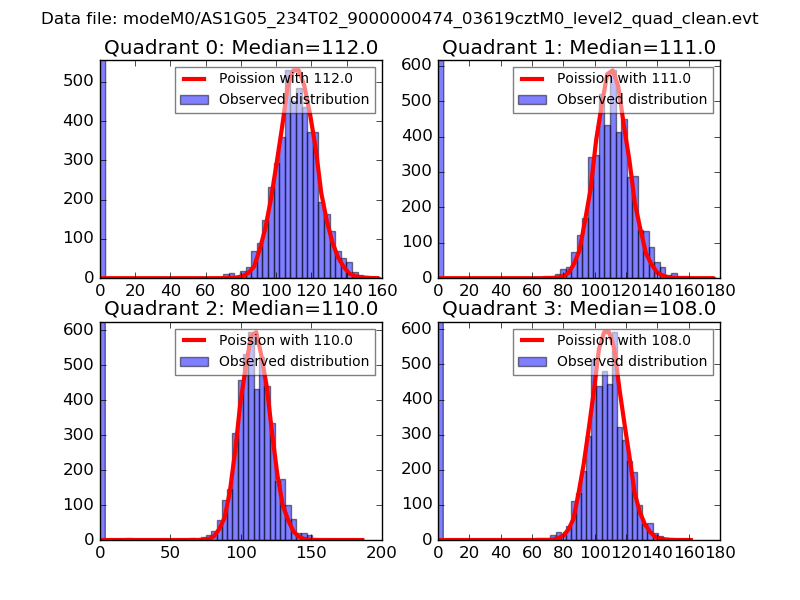 |
 |
| Quadrant-wise count rates Data is divided into 100 sec bins |
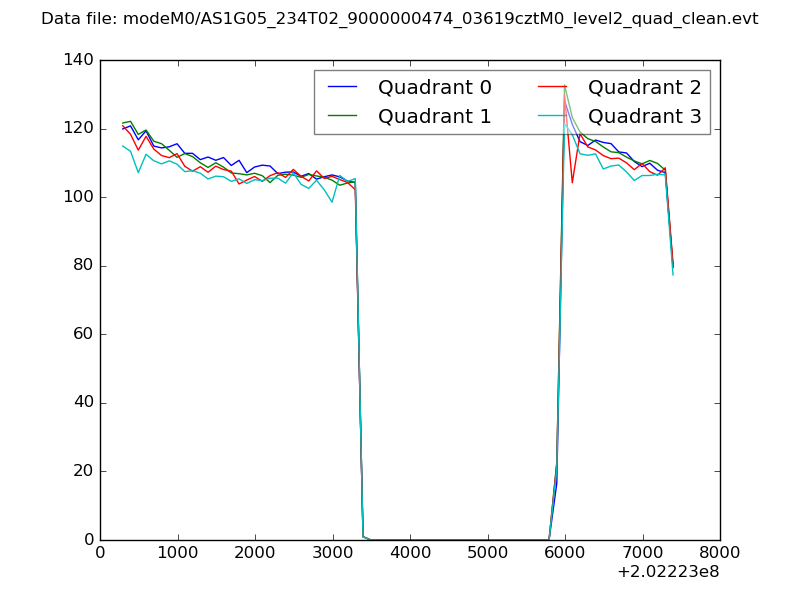 |
|
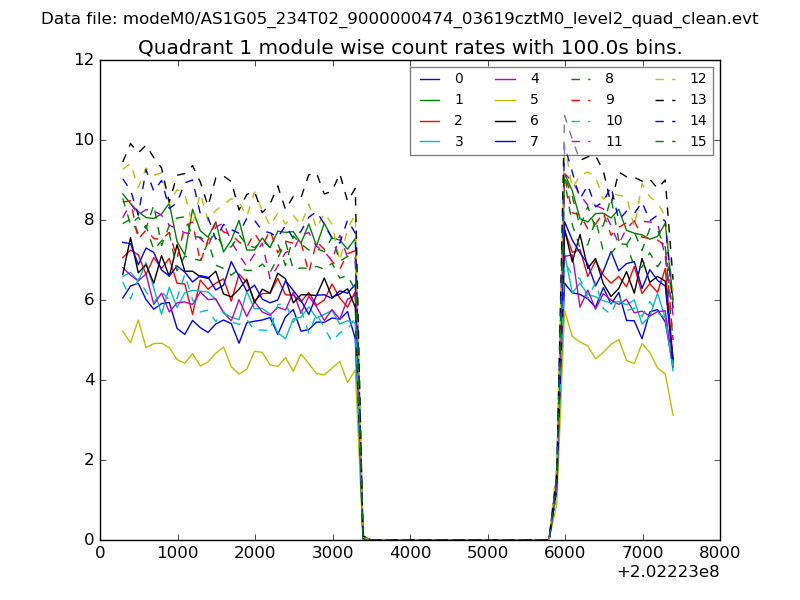
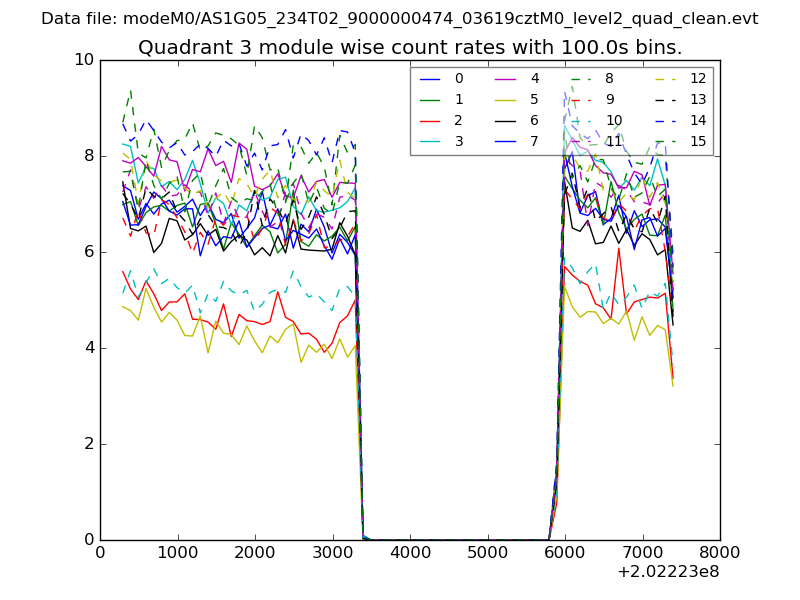
| Module-wise count rates for Quadrant A Data is divided into 100 sec bins |
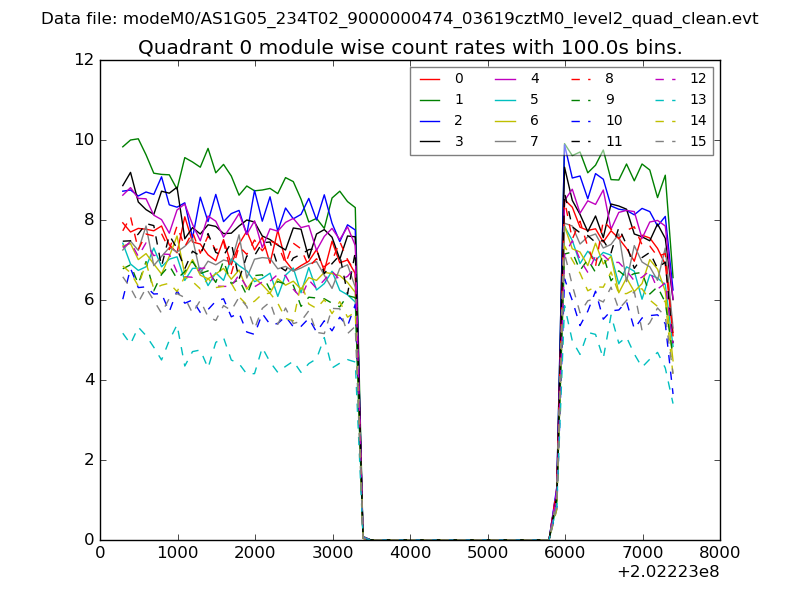 |
 |
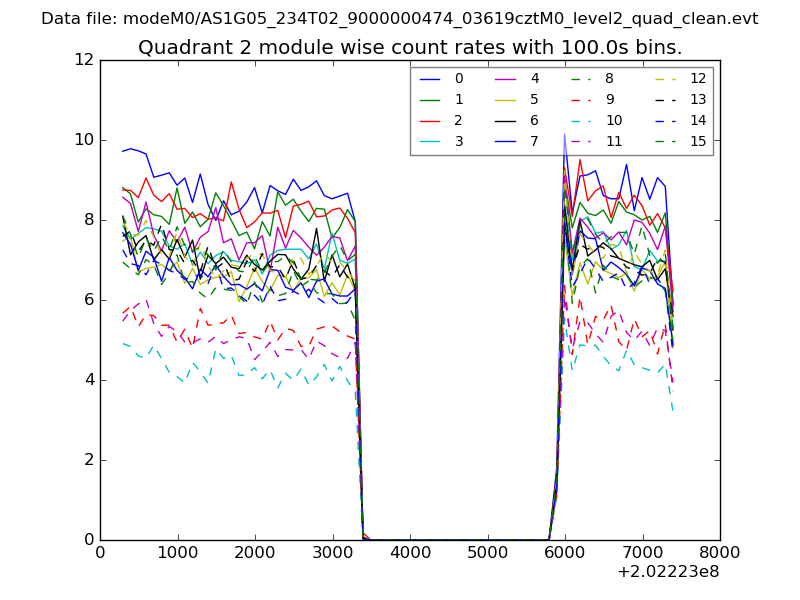
| Module-wise count rates for Quadrant B Data is divided into 100 sec bins |
 |
 |
| Module-wise count rates for Quadrant C Data is divided into 100 sec bins |
 |
 |
| Module-wise count rates for Quadrant D Data is divided into 100 sec bins |
 |
 |
| Parameter | Plot |
|---|---|
| CZT HV Monitor | 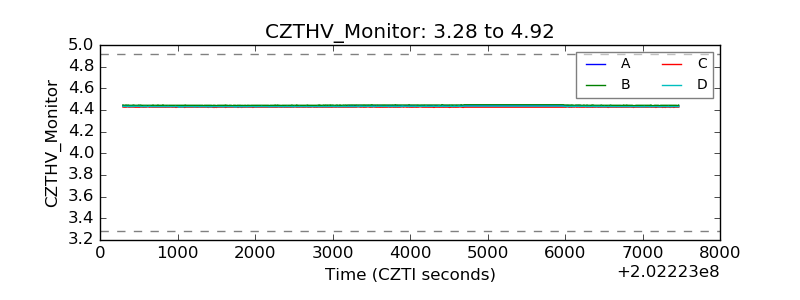 |
| D_VDD | 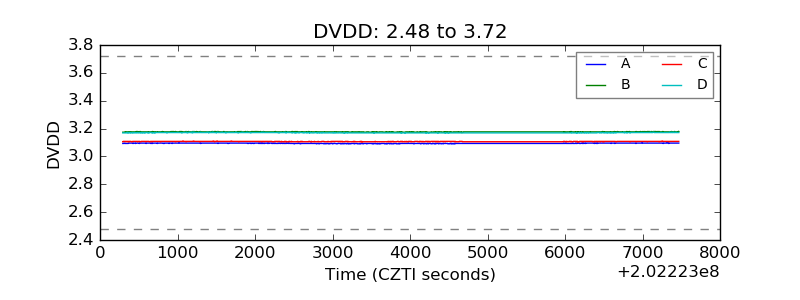 |
| Temperature 1 | 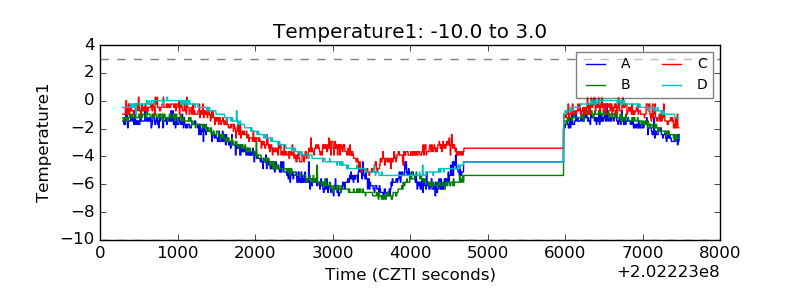 |
| Veto HV Monitor | 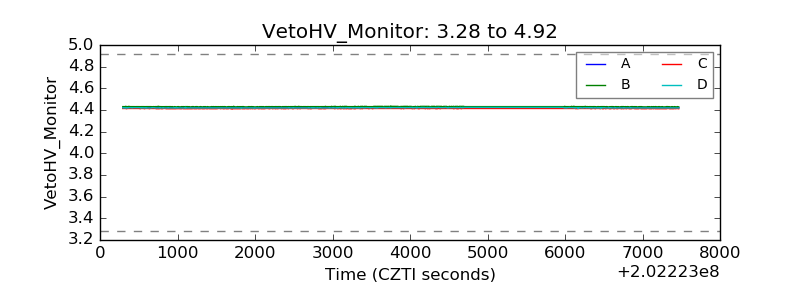 |
| Veto LLD | 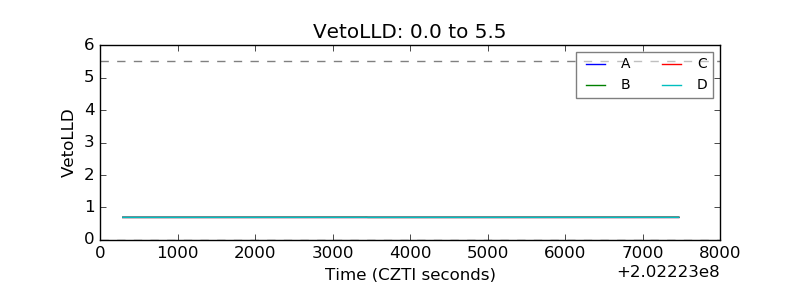 |
| Alpha Counter | 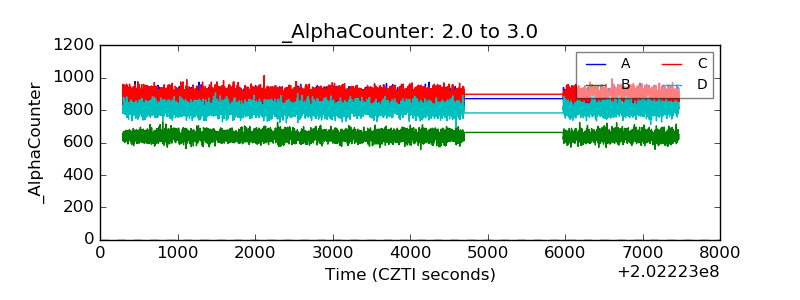 |
| _CPM_Rate | 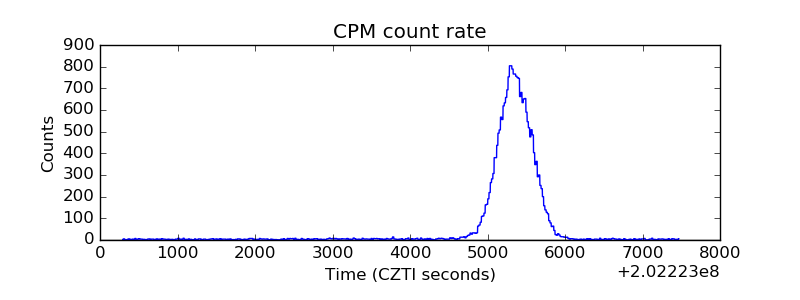 |
| CZT Counter | 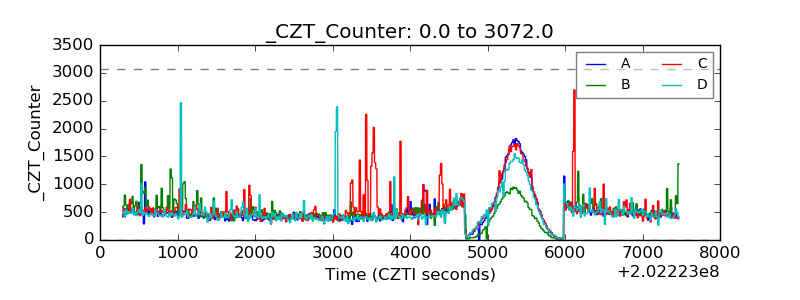 |
| +2.5 Volts monitor |  |
| +5 Volts monitor |  |
| Veto Counter | 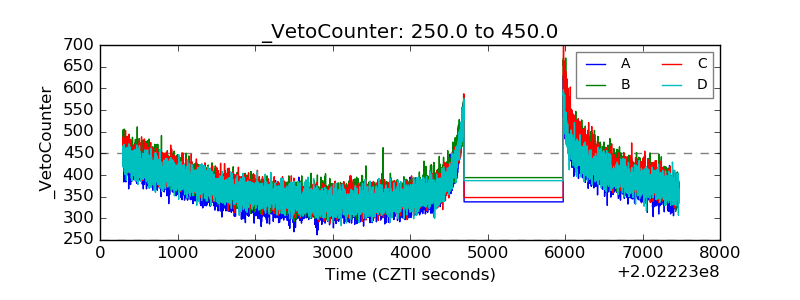 |