| Param | Original file | Final file |
|---|---|---|
| Filename | modeM0/AS1G05_234T02_9000000474_03620cztM0_level2.evt | modeM0/AS1G05_234T02_9000000474_03620cztM0_level2_quad_clean.evt |
| Size (bytes) | 406,823,040 | 76,029,120 |
| Size | 388.0 MB | 72.5 MB |
| Events in quadrant A | 2,871,741 | 472,356 |
| Events in quadrant B | 3,110,141 | 469,042 |
| Events in quadrant C | 2,985,550 | 468,296 |
| Events in quadrant D | 2,930,095 | 458,605 |
| Mode M9 | |||
|---|---|---|---|
| Quadrant | BADHDUFLAG | Total packets | Discarded packets |
| A | 0 | 12 | 0 |
| B | 0 | 12 | 0 |
| C | 0 | 12 | 0 |
| D | 0 | 12 | 0 |
| Mode SS | |||
|---|---|---|---|
| Quadrant | BADHDUFLAG | Total packets | Discarded packets |
| A | 0 | 124 | 0 |
| B | 0 | 124 | 0 |
| C | 0 | 124 | 0 |
| D | 0 | 124 | 0 |
| Mode M0 | |||
|---|---|---|---|
| Quadrant | BADHDUFLAG | Total packets | Discarded packets |
| A | 0 | 12957 | 2 |
| B | 0 | 13369 | 1 |
| C | 0 | 13270 | 1 |
| D | 0 | 13200 | 1 |
| Quadrant | Total seconds | Saturated seconds | Saturation percentage |
|---|---|---|---|
| A | 6225 | 58 | 0.931727% |
| B | 6225 | 41 | 0.658635% |
| C | 6225 | 68 | 1.092369% |
| D | 6225 | 57 | 0.915663% |
Noise dominated data is calculated using 1-second bins in cleaned event files. If a bin has >2000 counts, and if more than 50% of those come from <1% of pixels, then it is considered to be noise-dominated and hence unusable.
| Quadrant | # 1 sec bins | Bins with >0 counts | Bins with >2000 counts | High rate bins dominated by noise | Noise dominated (total time) | Noise dominated (detector-on time) | Marked lightcurve |
|---|---|---|---|---|---|---|---|
| A | 7340 | 6226 | 6 | 6 | 0.08% | 0.10% | 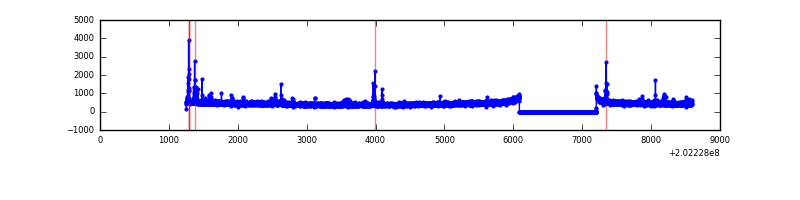 |
| B | 7340 | 6226 | 2 | 2 | 0.03% | 0.03% | 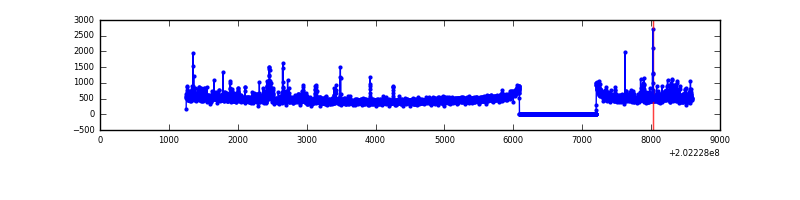 |
| C | 7340 | 6226 | 15 | 15 | 0.20% | 0.24% | 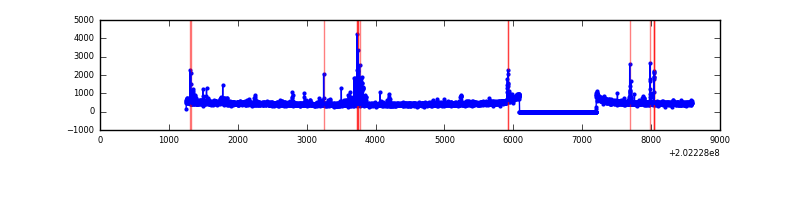 |
| D | 7340 | 6226 | 14 | 14 | 0.19% | 0.22% | 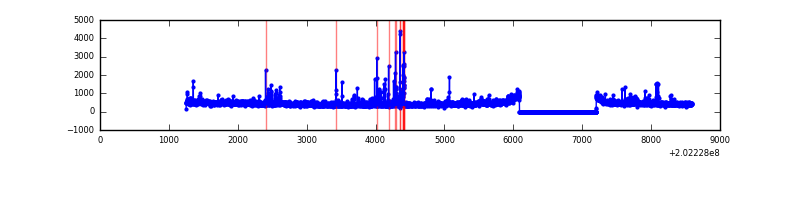 |
Top three noisy pixels from each quadrant. If the there are fewer than three noisy pixels in the level2.evt file, extra rows are filled as -1
| Pixel properties | Quadrant properties | ||||||
|---|---|---|---|---|---|---|---|
| Quadrant | DetID | PixID | Counts | Sigma | Mean | Median | Sigma |
| A | 0 | 50 | 50242 | 337.95 | 716 | 699 | 146.6 |
| A | 0 | 31 | 30792 | 205.27 | 716 | 699 | 146.6 |
| A | 0 | 118 | 9410 | 59.42 | 716 | 699 | 146.6 |
| B | 15 | 204 | 80774 | 577.66 | 725 | 708 | 138.6 |
| B | 3 | 249 | 45950 | 326.41 | 725 | 708 | 138.6 |
| B | 0 | 182 | 35166 | 248.61 | 725 | 708 | 138.6 |
| C | 9 | 247 | 113702 | 693.41 | 706 | 708 | 163.0 |
| C | 2 | 53 | 98500 | 600.12 | 706 | 708 | 163.0 |
| C | 13 | 61 | 6103 | 33.11 | 706 | 708 | 163.0 |
| D | 13 | 223 | 82039 | 478.34 | 706 | 685 | 170.1 |
| D | 12 | 79 | 37679 | 217.52 | 706 | 685 | 170.1 |
| D | 8 | 195 | 32536 | 187.28 | 706 | 685 | 170.1 |
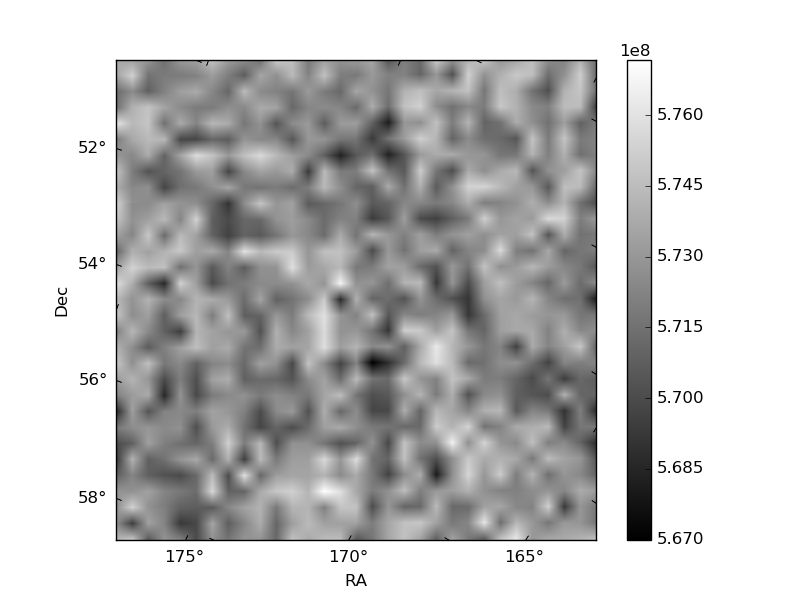
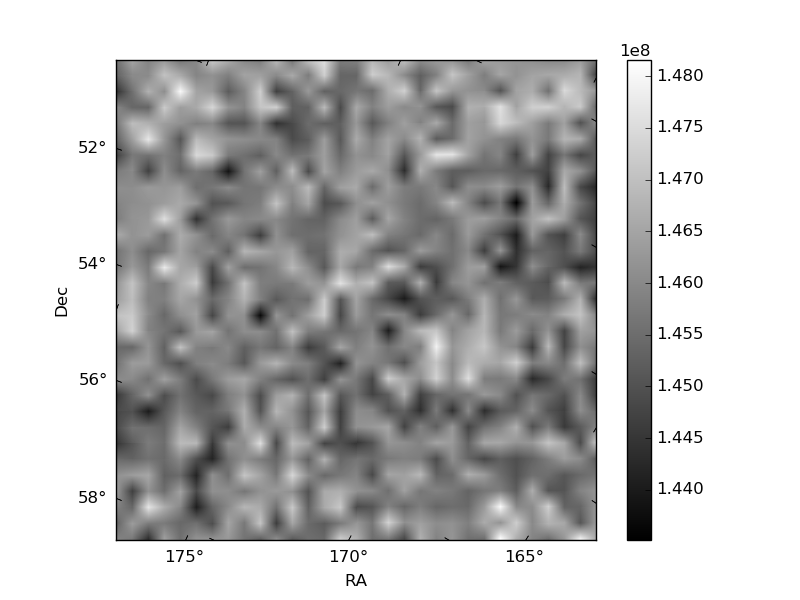
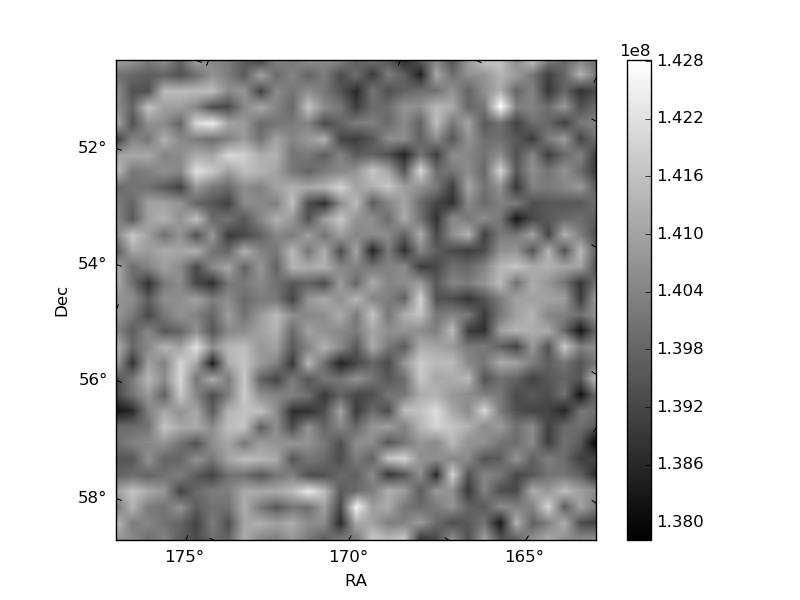
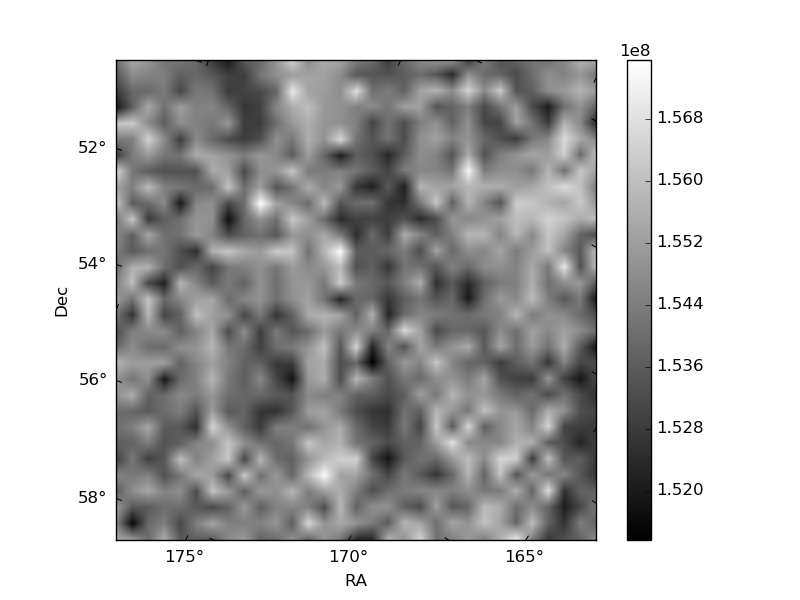
Histogram calculated using DETX and DETY for each event in the final _common_clean file
| Quadrant A |  |
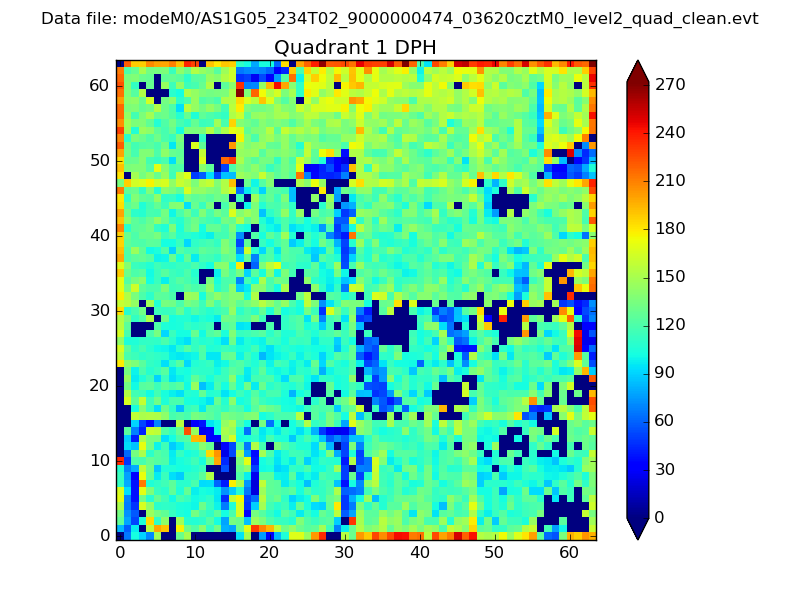 |
Quadrant B |
|---|---|---|---|
| Quadrant D | 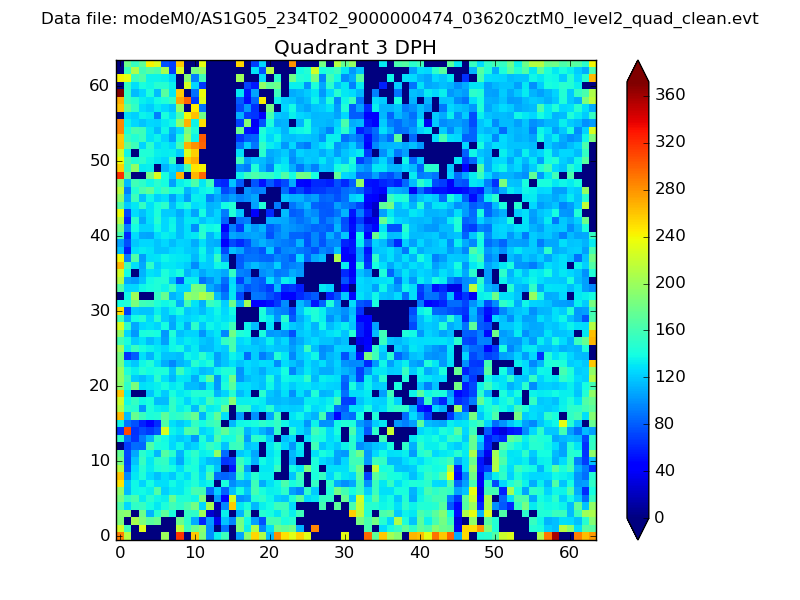 |
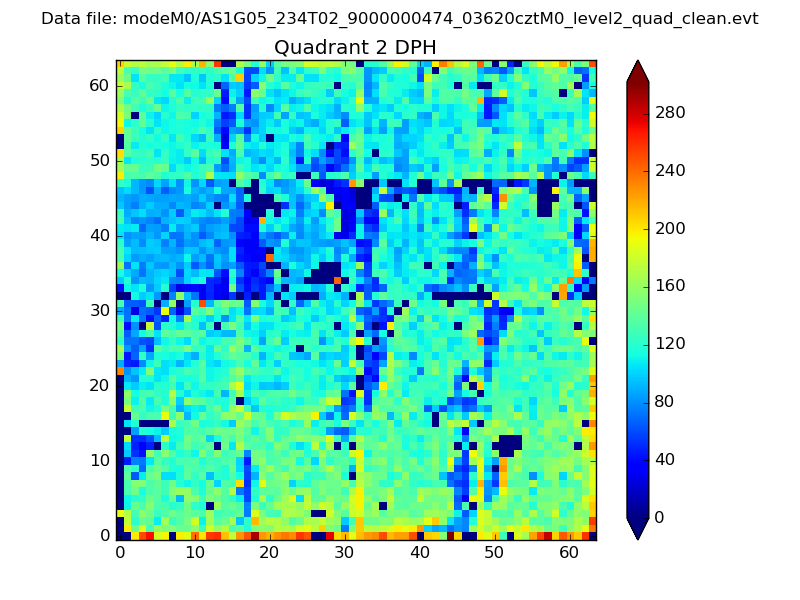 |
Quadrant C |
| Plot type | Count rate plots | Images |
|---|---|---|
| Comparison with Poisson distribution Blue bars denote a histogram of data divided into 1 sec bins. Red curve is a Poisson curve with rate = median count rate of data. |
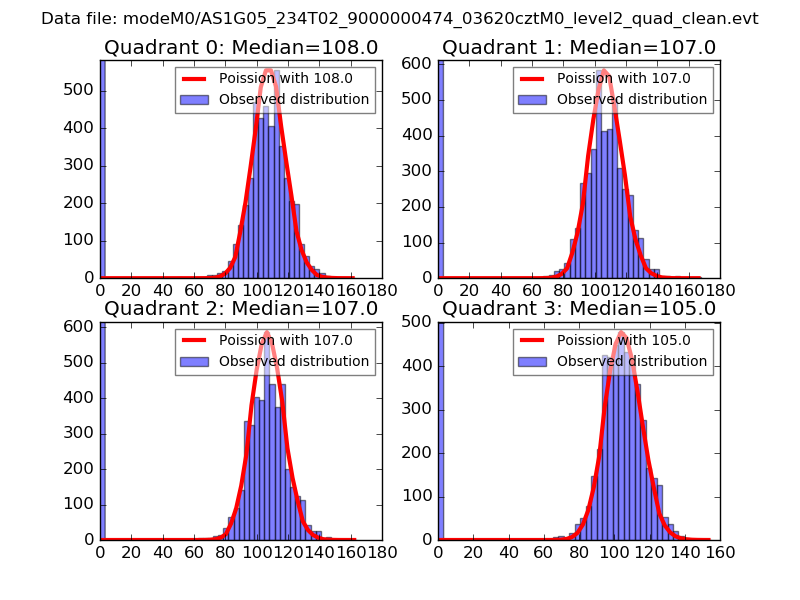 |
 |
| Quadrant-wise count rates Data is divided into 100 sec bins |
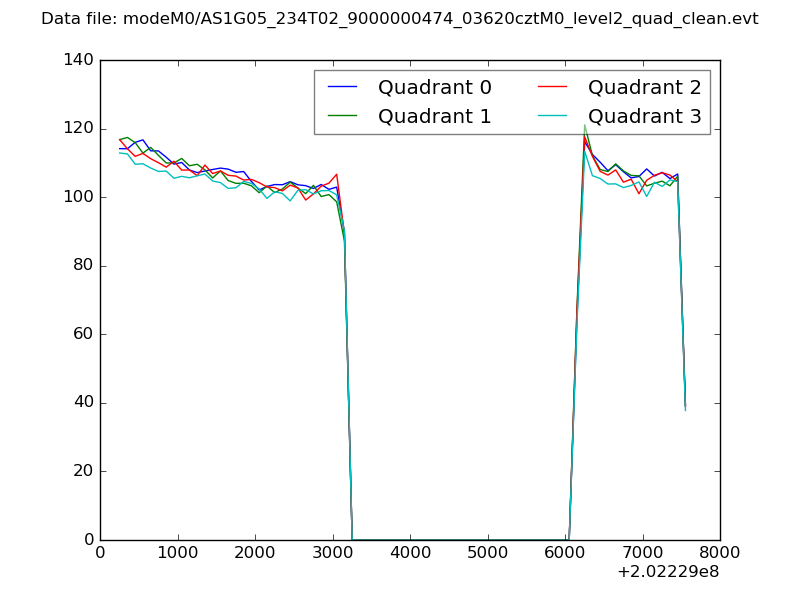 |
|
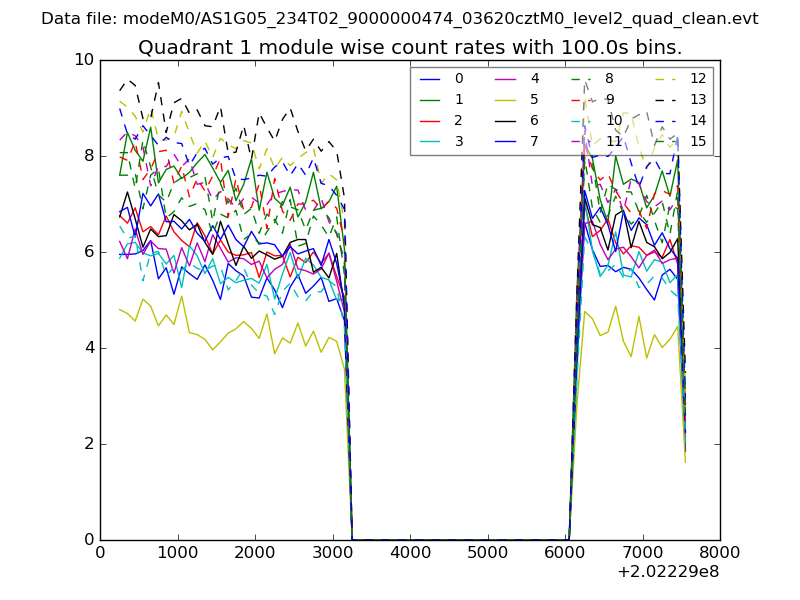
| Module-wise count rates for Quadrant A Data is divided into 100 sec bins |
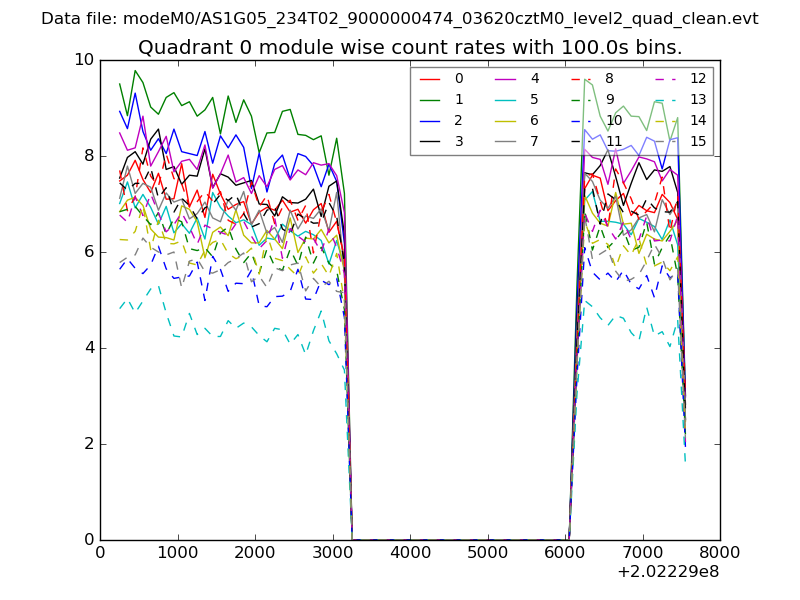 |
 |
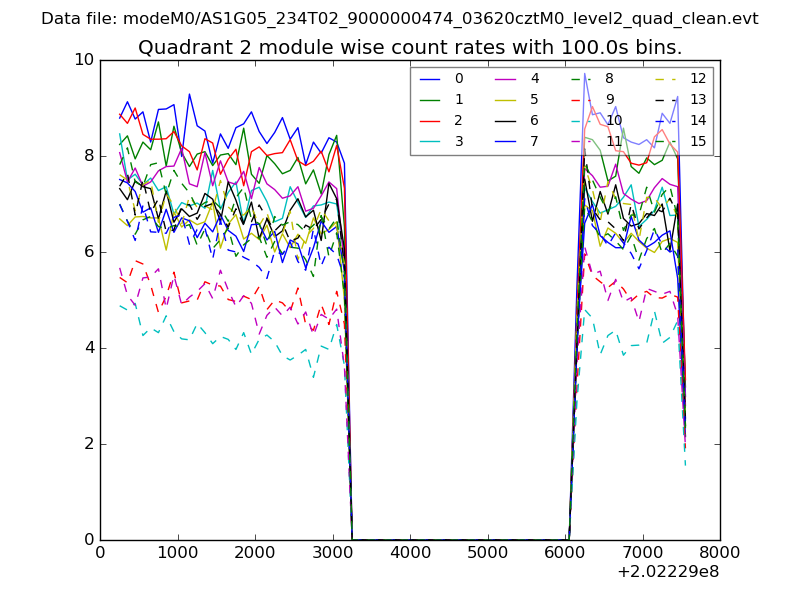
| Module-wise count rates for Quadrant B Data is divided into 100 sec bins |
 |
 |
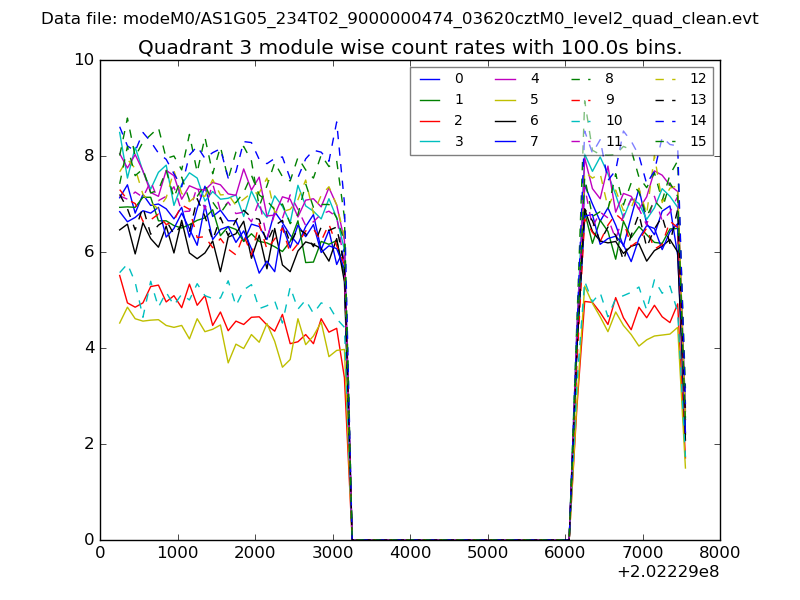
| Module-wise count rates for Quadrant C Data is divided into 100 sec bins |
 |
 |
| Module-wise count rates for Quadrant D Data is divided into 100 sec bins |
 |
 |
| Parameter | Plot |
|---|---|
| CZT HV Monitor | 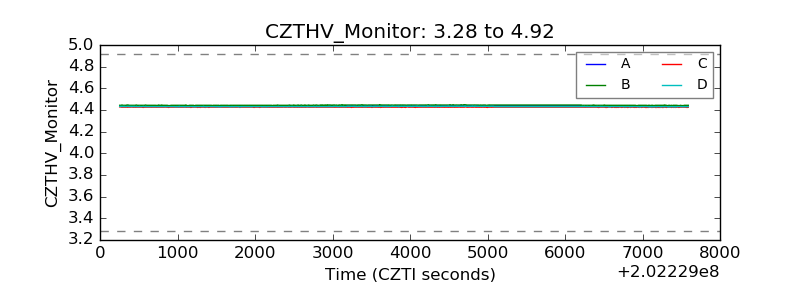 |
| D_VDD | 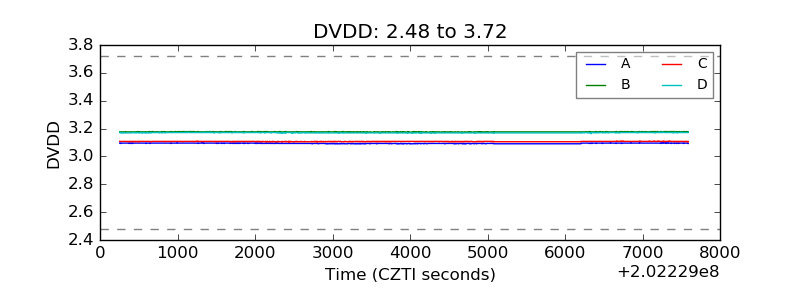 |
| Temperature 1 | 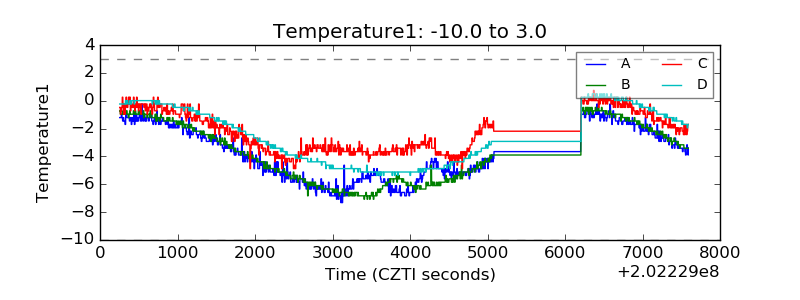 |
| Veto HV Monitor | 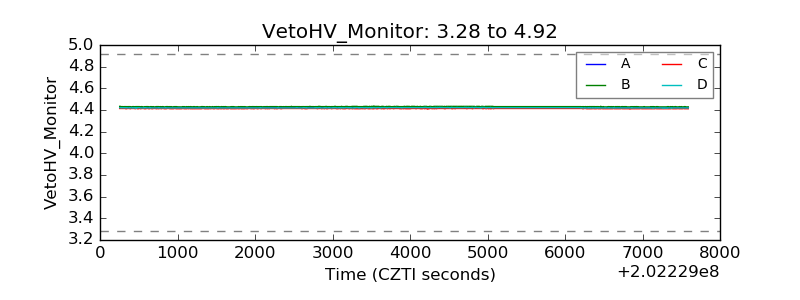 |
| Veto LLD | 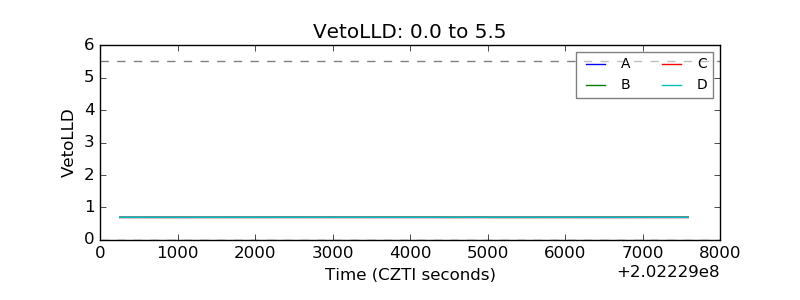 |
| Alpha Counter | 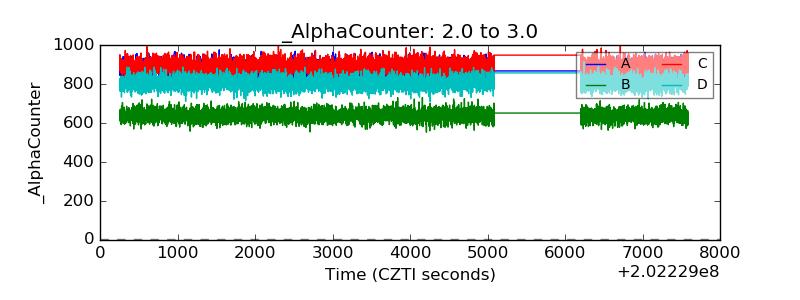 |
| _CPM_Rate | 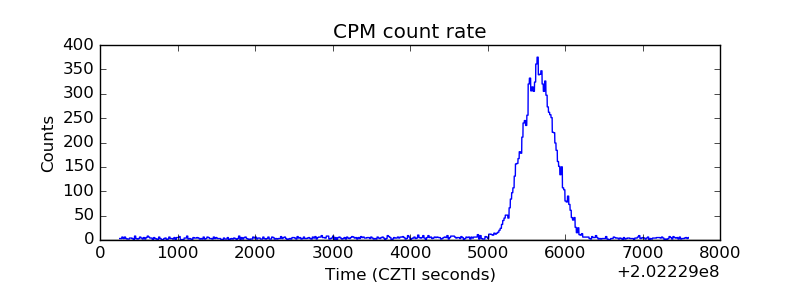 |
| CZT Counter |  |
| +2.5 Volts monitor |  |
| +5 Volts monitor |  |
| Veto Counter | 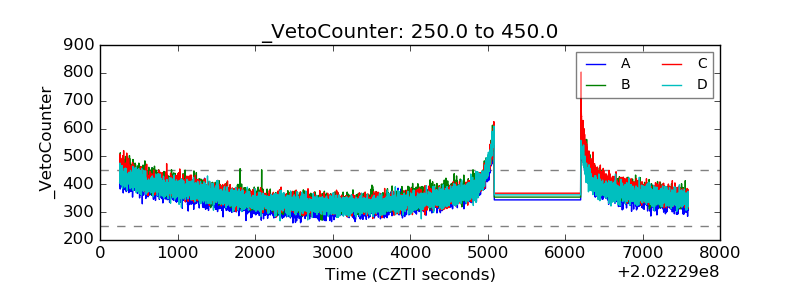 |