| Param | Original file | Final file |
|---|---|---|
| Filename | modeM0/AS1G05_234T02_9000000474_03621cztM0_level2.evt | modeM0/AS1G05_234T02_9000000474_03621cztM0_level2_quad_clean.evt |
| Size (bytes) | 506,868,480 | 82,428,480 |
| Size | 483.4 MB | 78.6 MB |
| Events in quadrant A | 3,124,226 | 513,523 |
| Events in quadrant B | 4,249,505 | 507,799 |
| Events in quadrant C | 4,051,656 | 500,260 |
| Events in quadrant D | 3,461,680 | 498,505 |
| Mode M9 | |||
|---|---|---|---|
| Quadrant | BADHDUFLAG | Total packets | Discarded packets |
| A | 0 | 9 | 0 |
| B | 0 | 9 | 0 |
| C | 0 | 9 | 0 |
| D | 0 | 10 | 0 |
| Mode SS | |||
|---|---|---|---|
| Quadrant | BADHDUFLAG | Total packets | Discarded packets |
| A | 0 | 136 | 0 |
| B | 0 | 136 | 0 |
| C | 0 | 136 | 0 |
| D | 0 | 136 | 0 |
| Mode M0 | |||
|---|---|---|---|
| Quadrant | BADHDUFLAG | Total packets | Discarded packets |
| A | 0 | 14290 | 3 |
| B | 0 | 17192 | 2 |
| C | 0 | 16979 | 2 |
| D | 0 | 15381 | 2 |
| Quadrant | Total seconds | Saturated seconds | Saturation percentage |
|---|---|---|---|
| A | 6836 | 40 | 0.585138% |
| B | 6836 | 70 | 1.023991% |
| C | 6836 | 304 | 4.447045% |
| D | 6836 | 93 | 1.360445% |
Noise dominated data is calculated using 1-second bins in cleaned event files. If a bin has >2000 counts, and if more than 50% of those come from <1% of pixels, then it is considered to be noise-dominated and hence unusable.
| Quadrant | # 1 sec bins | Bins with >0 counts | Bins with >2000 counts | High rate bins dominated by noise | Noise dominated (total time) | Noise dominated (detector-on time) | Marked lightcurve |
|---|---|---|---|---|---|---|---|
| A | 7676 | 6837 | 6 | 6 | 0.08% | 0.09% | 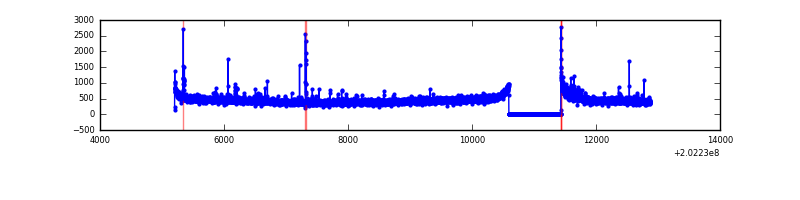 |
| B | 7676 | 6837 | 7 | 7 | 0.09% | 0.10% | 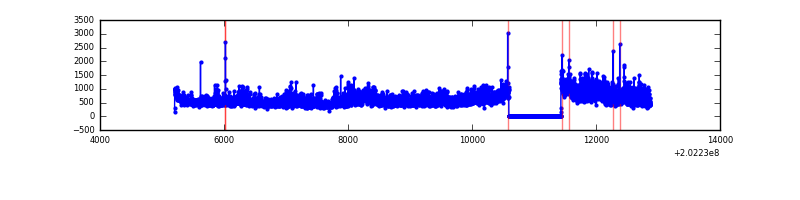 |
| C | 7676 | 6836 | 148 | 148 | 1.93% | 2.17% | 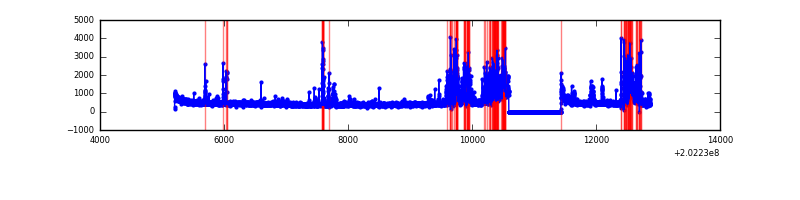 |
| D | 7676 | 6837 | 68 | 68 | 0.89% | 0.99% | 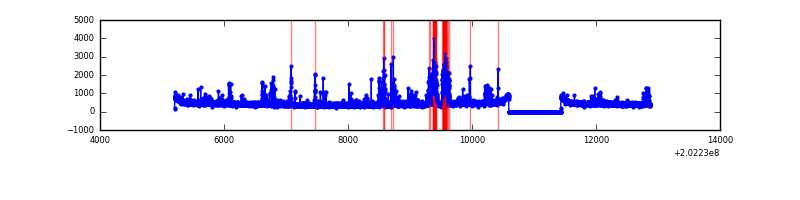 |
Top three noisy pixels from each quadrant. If the there are fewer than three noisy pixels in the level2.evt file, extra rows are filled as -1
| Pixel properties | Quadrant properties | ||||||
|---|---|---|---|---|---|---|---|
| Quadrant | DetID | PixID | Counts | Sigma | Mean | Median | Sigma |
| A | 7 | 16 | 35689 | 218.99 | 778 | 760 | 159.5 |
| A | 0 | 128 | 20153 | 121.58 | 778 | 760 | 159.5 |
| A | 0 | 118 | 19179 | 115.48 | 778 | 760 | 159.5 |
| B | 3 | 0 | 609097 | 4036.11 | 787 | 766 | 150.7 |
| B | 15 | 204 | 299155 | 1979.73 | 787 | 766 | 150.7 |
| B | 14 | 167 | 129763 | 855.86 | 787 | 766 | 150.7 |
| C | 9 | 247 | 971031 | 5525.18 | 752 | 754 | 175.6 |
| C | 2 | 53 | 102694 | 580.49 | 752 | 754 | 175.6 |
| C | 14 | 67 | 12894 | 69.13 | 752 | 754 | 175.6 |
| D | 7 | 223 | 243469 | 1340.79 | 759 | 737 | 181.0 |
| D | 14 | 34 | 88900 | 486.99 | 759 | 737 | 181.0 |
| D | 13 | 239 | 53451 | 291.18 | 759 | 737 | 181.0 |
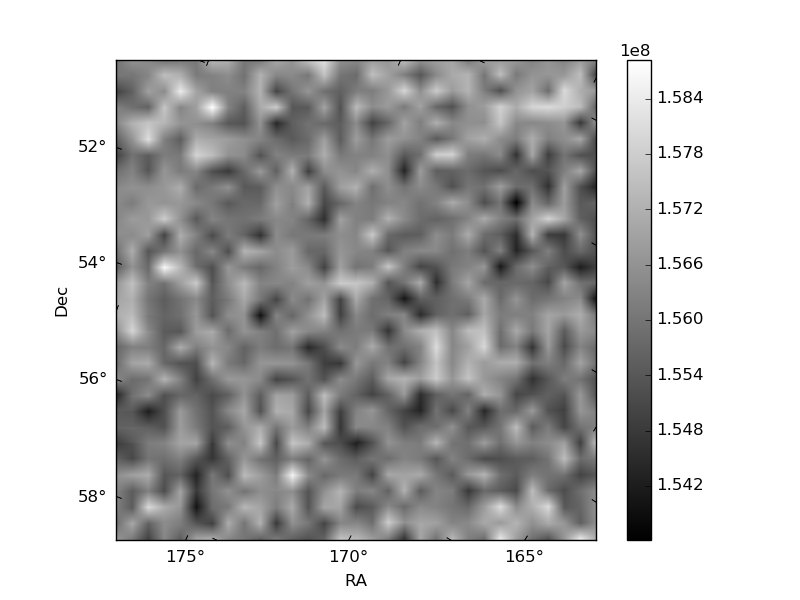
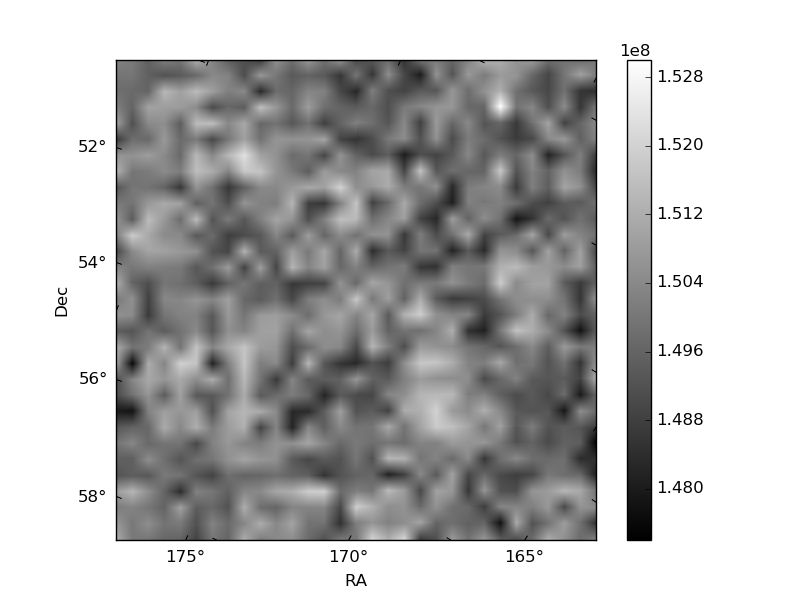
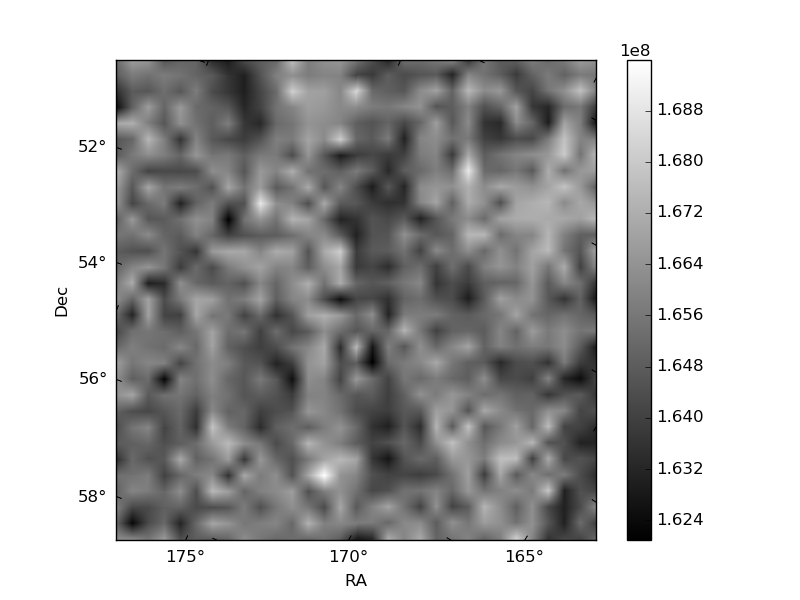
Histogram calculated using DETX and DETY for each event in the final _common_clean file
| Quadrant A |  |
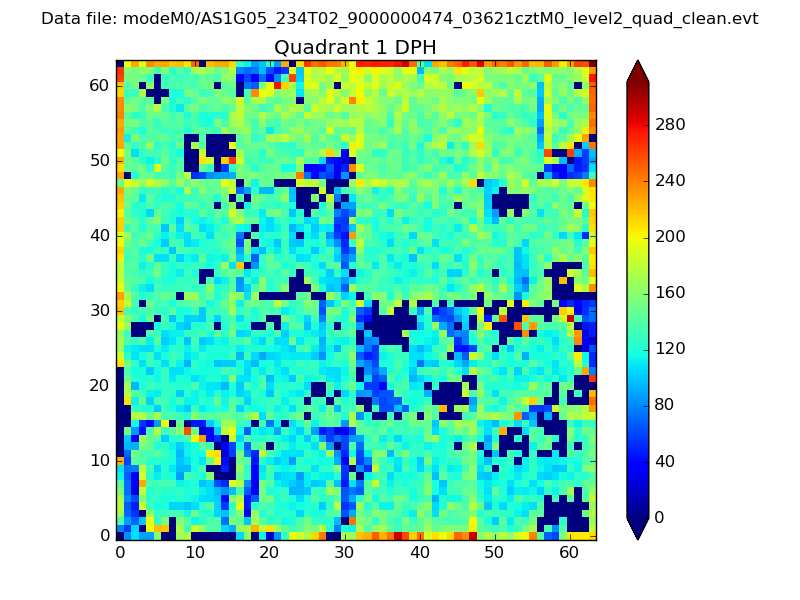 |
Quadrant B |
|---|---|---|---|
| Quadrant D | 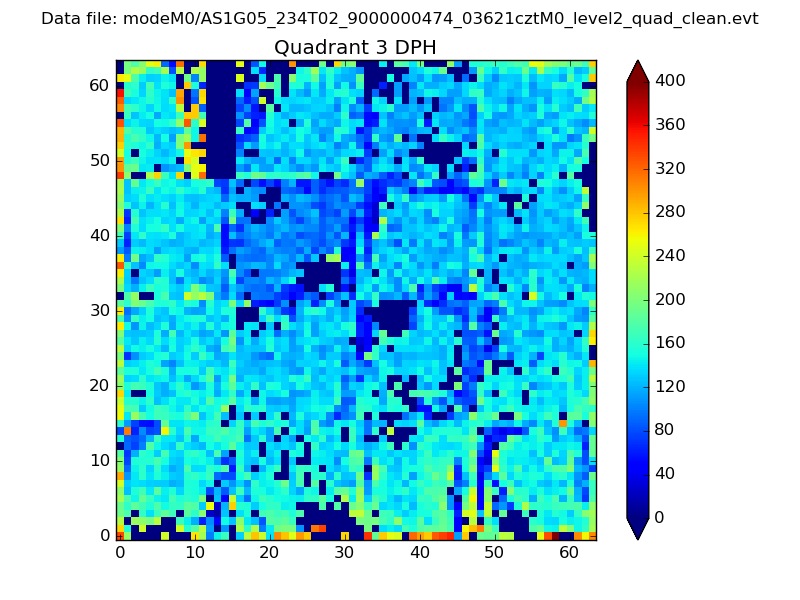 |
 |
Quadrant C |
| Plot type | Count rate plots | Images |
|---|---|---|
| Comparison with Poisson distribution Blue bars denote a histogram of data divided into 1 sec bins. Red curve is a Poisson curve with rate = median count rate of data. |
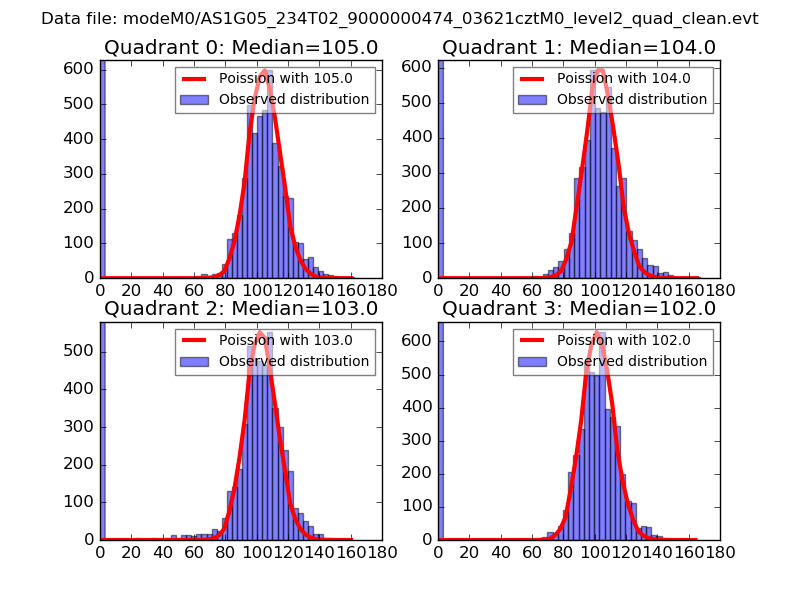 |
 |
| Quadrant-wise count rates Data is divided into 100 sec bins |
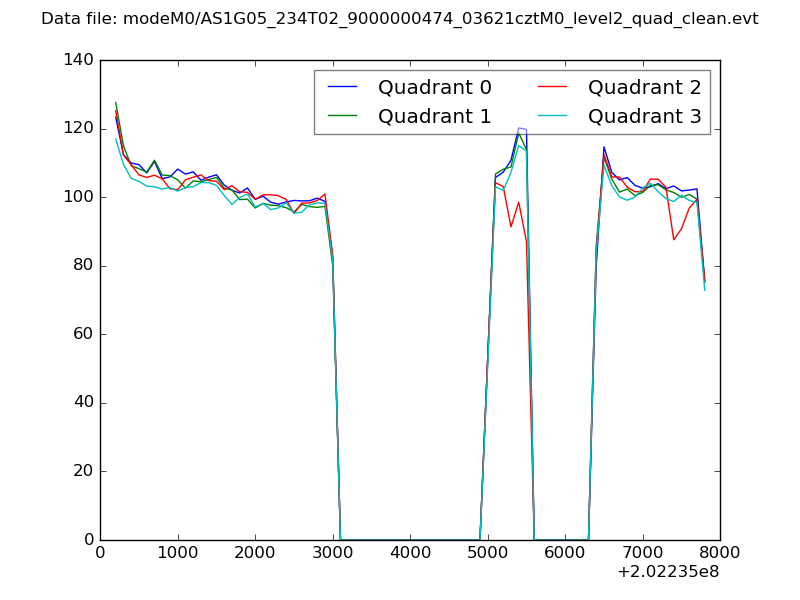 |
|
| Module-wise count rates for Quadrant A Data is divided into 100 sec bins |
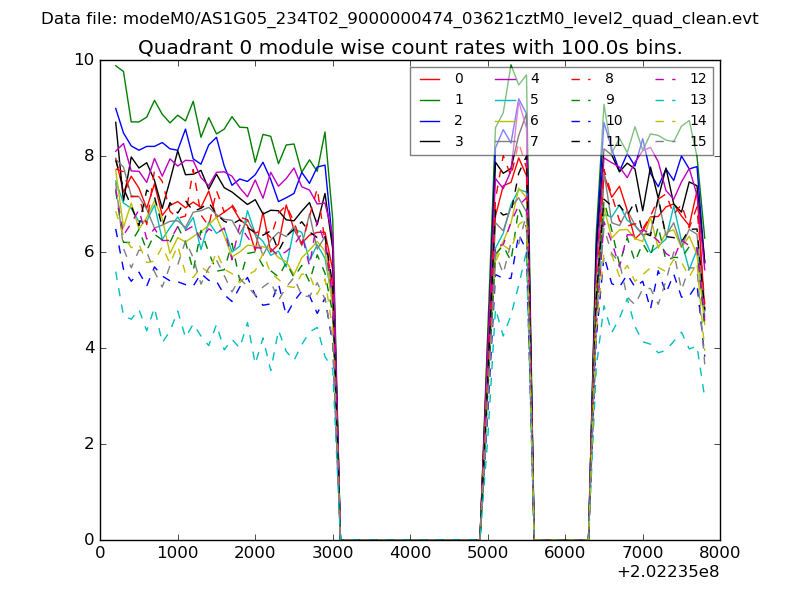 |
 |
| Module-wise count rates for Quadrant B Data is divided into 100 sec bins |
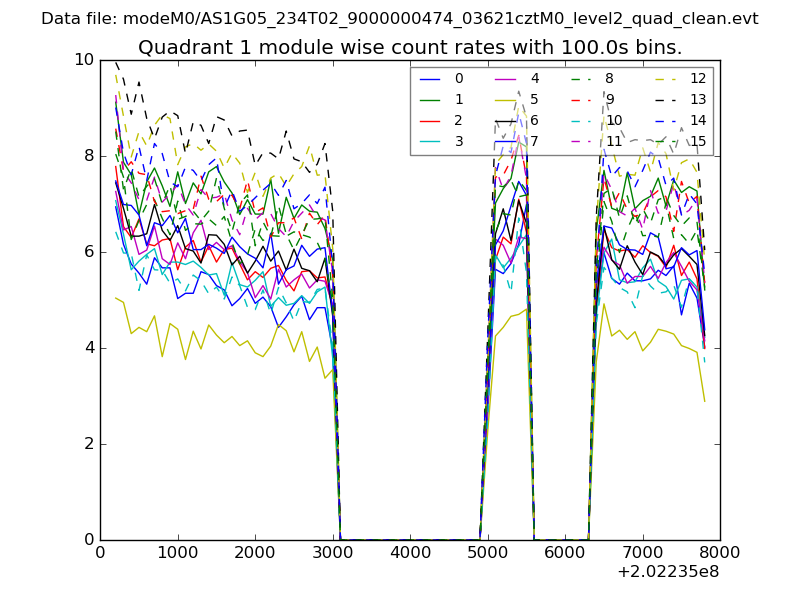 |
 |
| Module-wise count rates for Quadrant C Data is divided into 100 sec bins |
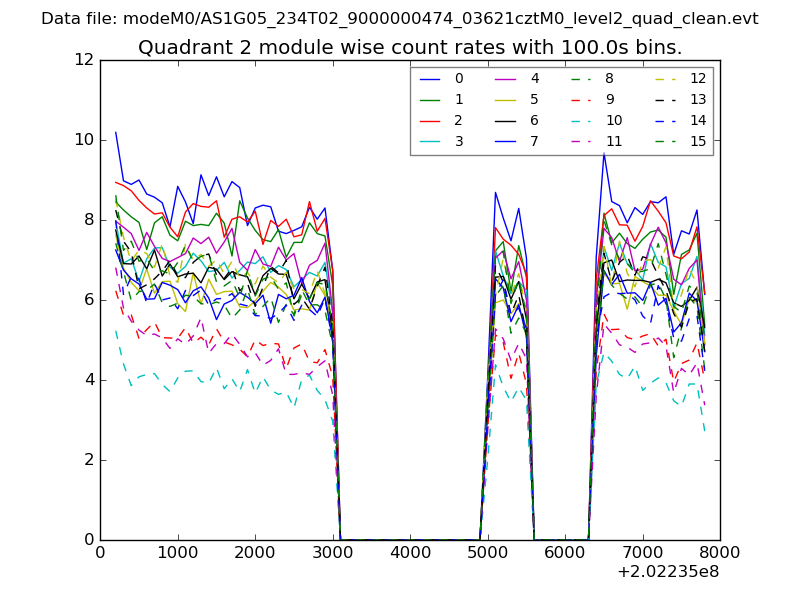 |
 |
| Module-wise count rates for Quadrant D Data is divided into 100 sec bins |
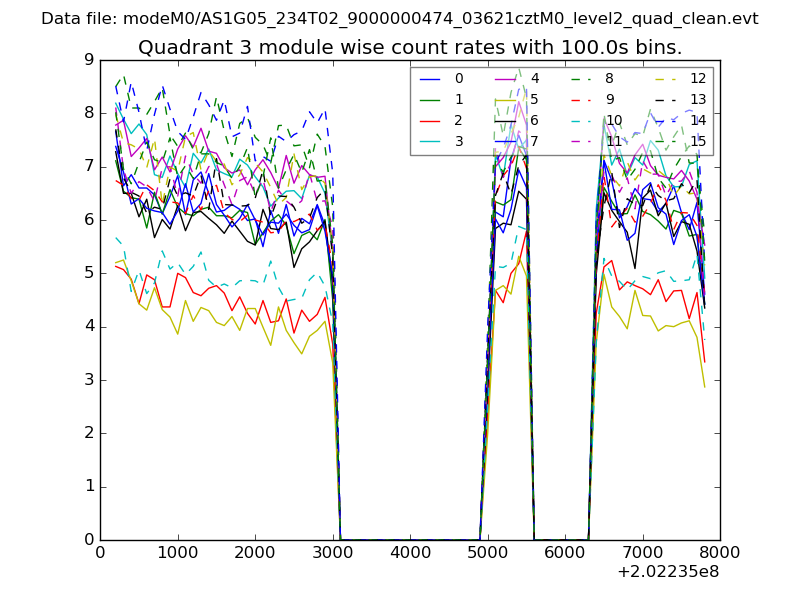 |
 |
| Parameter | Plot |
|---|---|
| CZT HV Monitor | 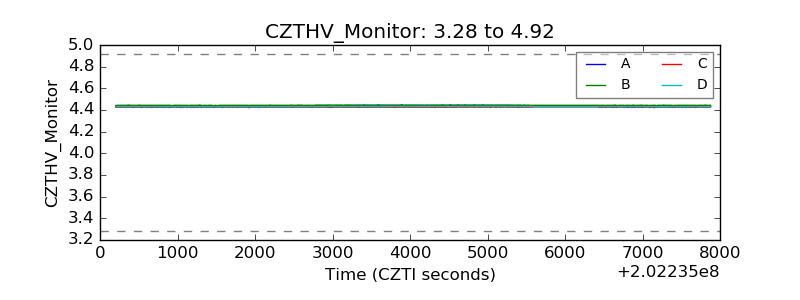 |
| D_VDD | 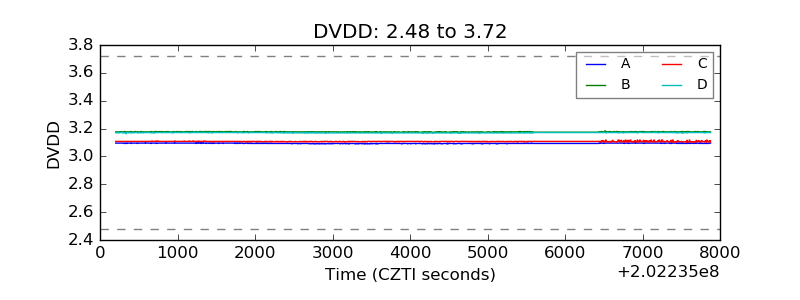 |
| Temperature 1 | 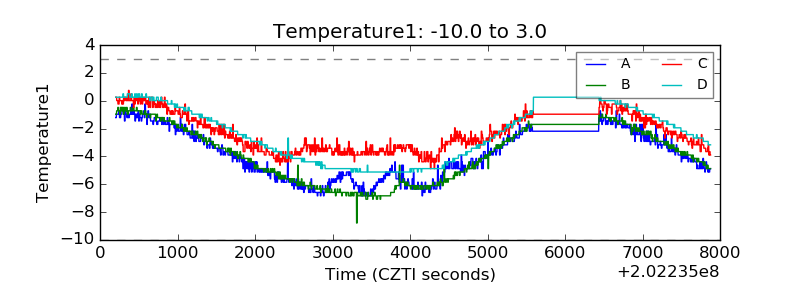 |
| Veto HV Monitor | 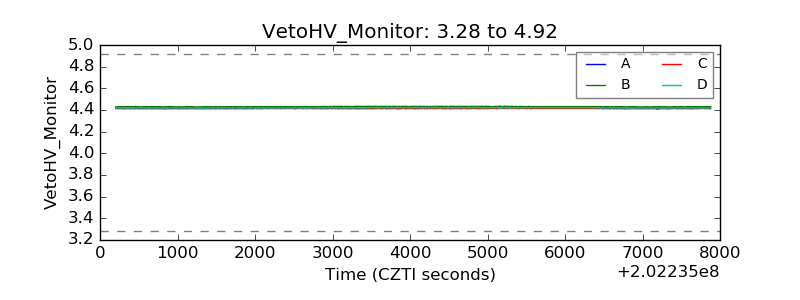 |
| Veto LLD | 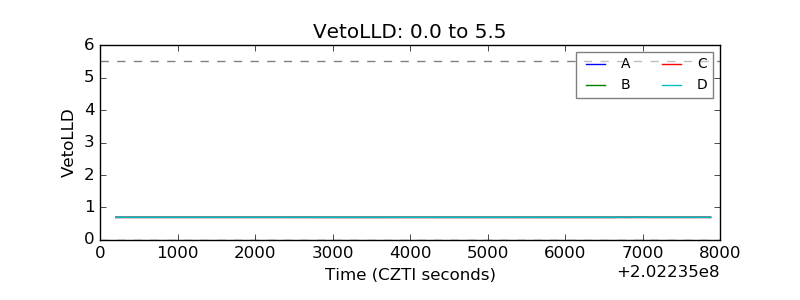 |
| Alpha Counter | 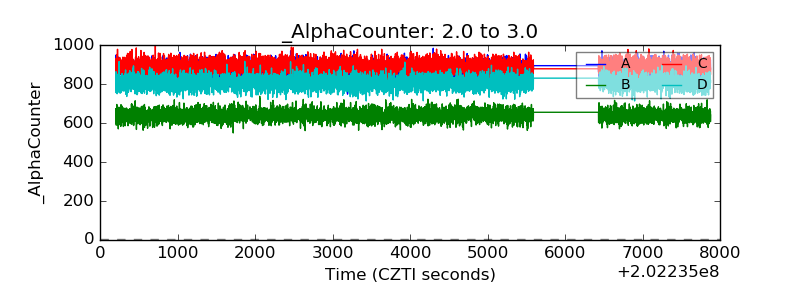 |
| _CPM_Rate | 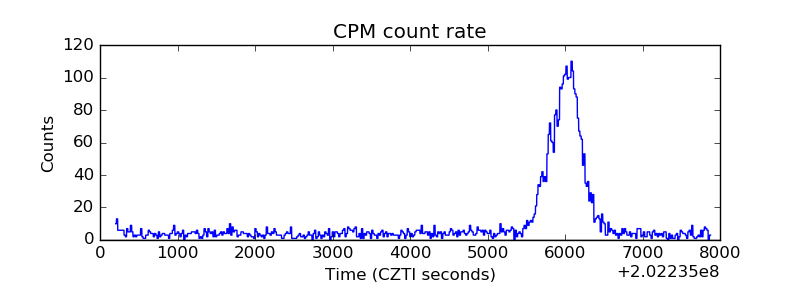 |
| CZT Counter | 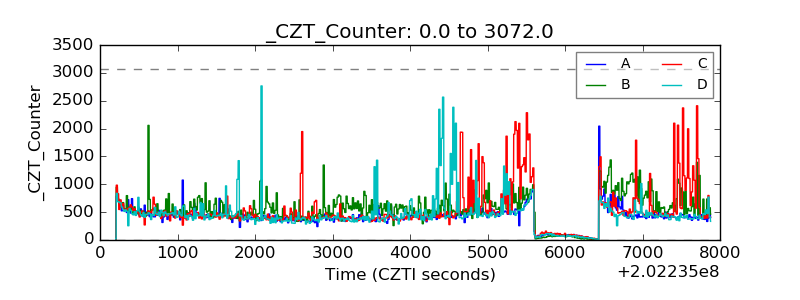 |
| +2.5 Volts monitor |  |
| +5 Volts monitor |  |
| Veto Counter | 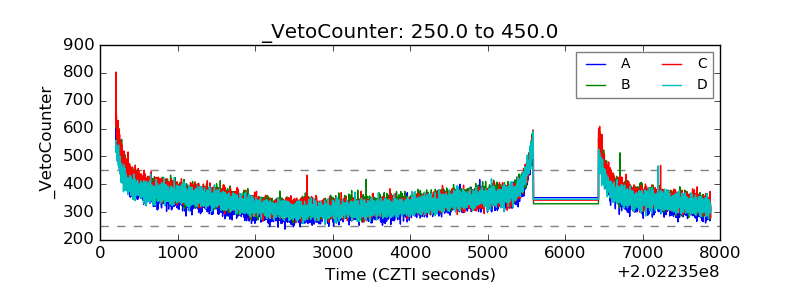 |