| Param | Original file | Final file |
|---|---|---|
| Filename | modeM0/AS1G05_234T02_9000000474_03627cztM0_level2.evt | modeM0/AS1G05_234T02_9000000474_03627cztM0_level2_quad_clean.evt |
| Size (bytes) | 1,590,684,480 | 239,019,840 |
| Size | 1.5 GB | 227.9 MB |
| Events in quadrant A | 10,963,608 | 1,424,499 |
| Events in quadrant B | 12,791,122 | 1,420,665 |
| Events in quadrant C | 12,057,730 | 1,407,708 |
| Events in quadrant D | 10,782,450 | 1,377,731 |
| Mode M9 | |||
|---|---|---|---|
| Quadrant | BADHDUFLAG | Total packets | Discarded packets |
| A | 0 | 20 | 0 |
| B | 0 | 20 | 0 |
| C | 0 | 20 | 0 |
| D | 0 | 21 | 0 |
| Mode SS | |||
|---|---|---|---|
| Quadrant | BADHDUFLAG | Total packets | Discarded packets |
| A | 0 | 476 | 0 |
| B | 0 | 476 | 0 |
| C | 0 | 476 | 0 |
| D | 0 | 476 | 0 |
| Mode M0 | |||
|---|---|---|---|
| Quadrant | BADHDUFLAG | Total packets | Discarded packets |
| A | 0 | 49482 | 5 |
| B | 0 | 53866 | 10 |
| C | 0 | 52680 | 4 |
| D | 0 | 49719 | 4 |
| Quadrant | Total seconds | Saturated seconds | Saturation percentage |
|---|---|---|---|
| A | 23359 | 235 | 1.006036% |
| B | 23357 | 226 | 0.967590% |
| C | 23359 | 300 | 1.284302% |
| D | 23359 | 227 | 0.971788% |
Noise dominated data is calculated using 1-second bins in cleaned event files. If a bin has >2000 counts, and if more than 50% of those come from <1% of pixels, then it is considered to be noise-dominated and hence unusable.
| Quadrant | # 1 sec bins | Bins with >0 counts | Bins with >2000 counts | High rate bins dominated by noise | Noise dominated (total time) | Noise dominated (detector-on time) | Marked lightcurve |
|---|---|---|---|---|---|---|---|
| A | 38825 | 23364 | 74 | 74 | 0.19% | 0.32% | 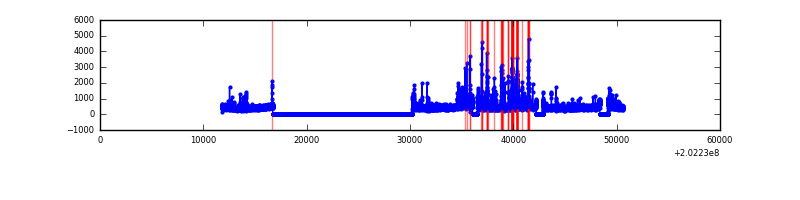 |
| B | 38825 | 23364 | 33 | 33 | 0.08% | 0.14% | 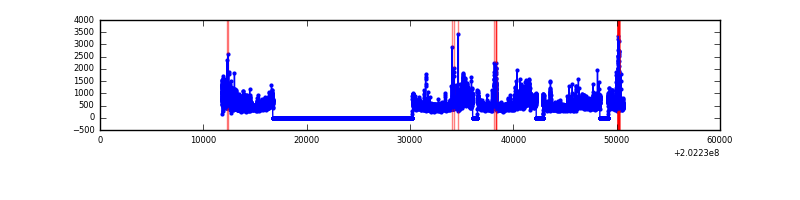 |
| C | 38825 | 23363 | 141 | 141 | 0.36% | 0.60% | 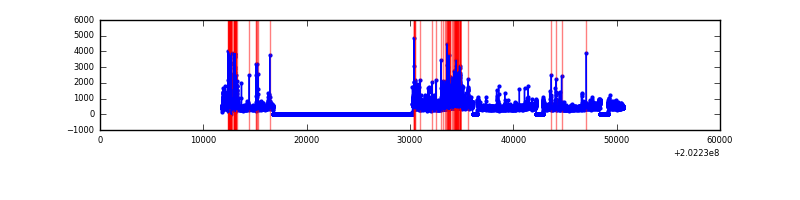 |
| D | 38825 | 23364 | 126 | 126 | 0.32% | 0.54% | 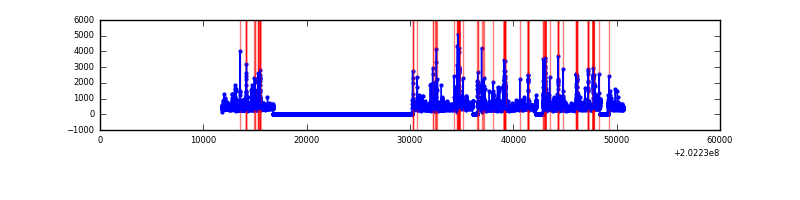 |
Top three noisy pixels from each quadrant. If the there are fewer than three noisy pixels in the level2.evt file, extra rows are filled as -1
| Pixel properties | Quadrant properties | ||||||
|---|---|---|---|---|---|---|---|
| Quadrant | DetID | PixID | Counts | Sigma | Mean | Median | Sigma |
| A | 0 | 31 | 560985 | 1056.69 | 2596 | 2534 | 528.5 |
| A | 0 | 50 | 145387 | 270.3 | 2596 | 2534 | 528.5 |
| A | 0 | 199 | 104740 | 193.39 | 2596 | 2534 | 528.5 |
| B | 15 | 204 | 1141614 | 2240.72 | 2645 | 2578 | 508.3 |
| B | 3 | 0 | 437414 | 855.41 | 2645 | 2578 | 508.3 |
| B | 0 | 182 | 255336 | 497.23 | 2645 | 2578 | 508.3 |
| C | 2 | 53 | 1156107 | 1958.12 | 2535 | 2542 | 589.1 |
| C | 9 | 247 | 812623 | 1375.07 | 2535 | 2542 | 589.1 |
| C | 1 | 16 | 85759 | 141.26 | 2535 | 2542 | 589.1 |
| D | 13 | 239 | 237671 | 384.52 | 2526 | 2451 | 611.7 |
| D | 13 | 25 | 157353 | 253.22 | 2526 | 2451 | 611.7 |
| D | 7 | 223 | 141085 | 226.63 | 2526 | 2451 | 611.7 |
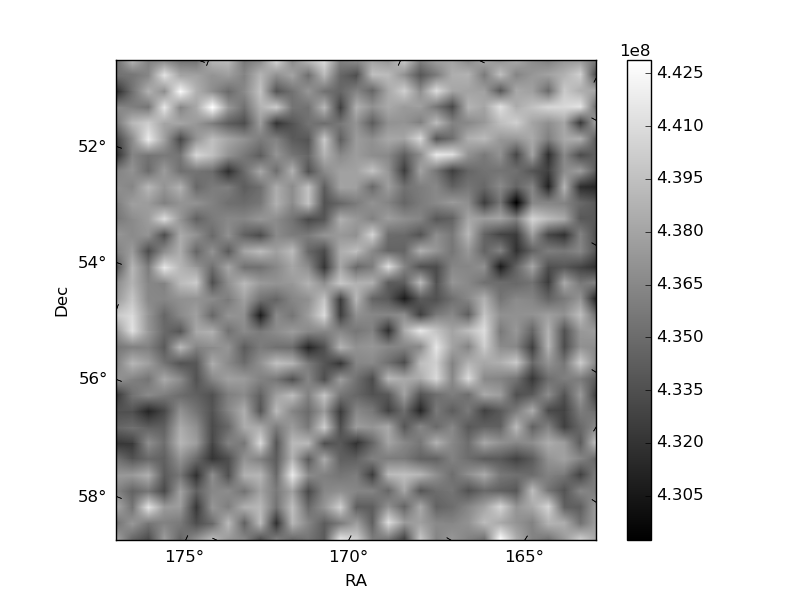
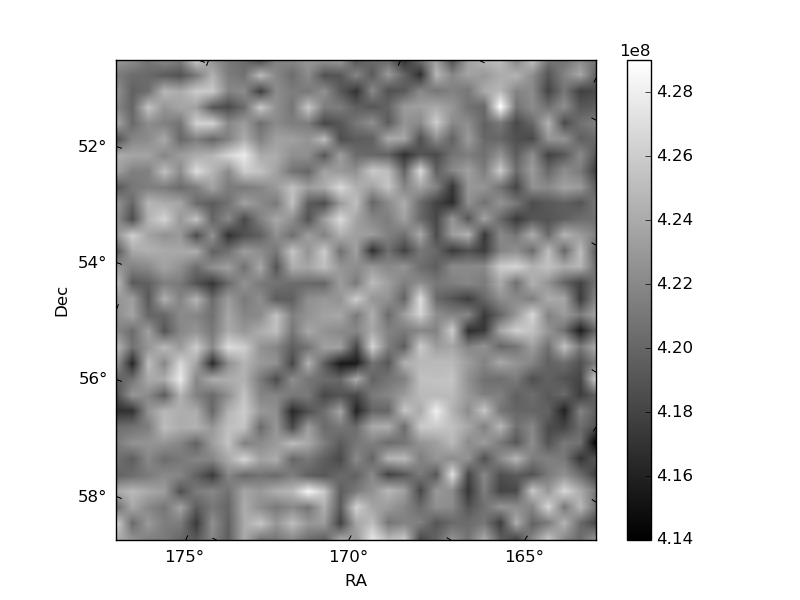
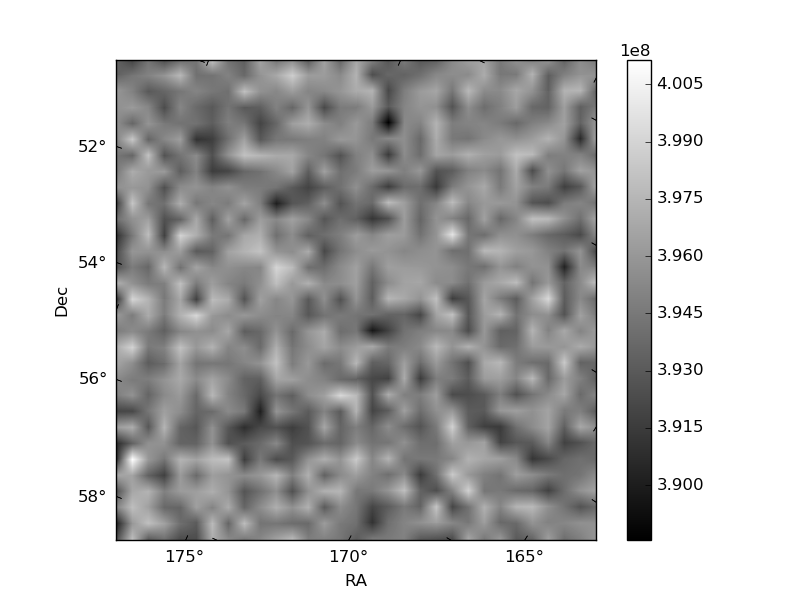
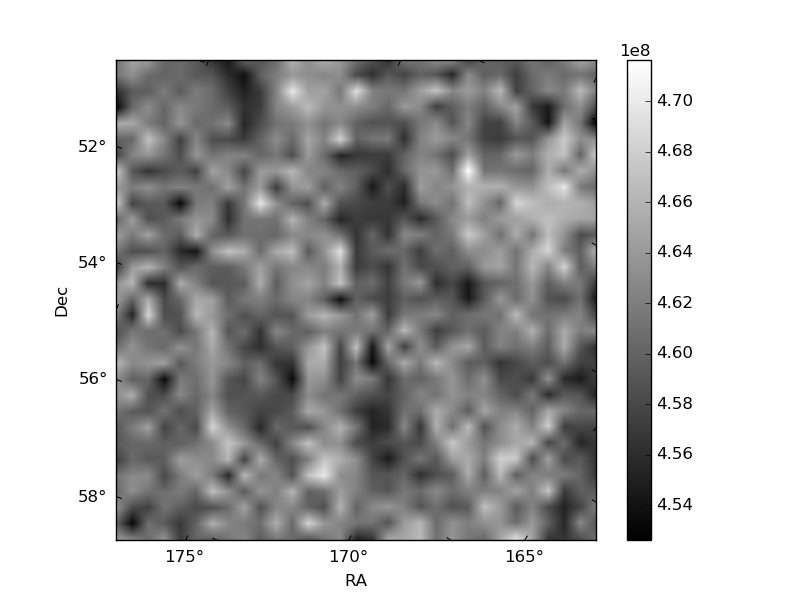
Histogram calculated using DETX and DETY for each event in the final _common_clean file
| Quadrant A |  |
 |
Quadrant B |
|---|---|---|---|
| Quadrant D | 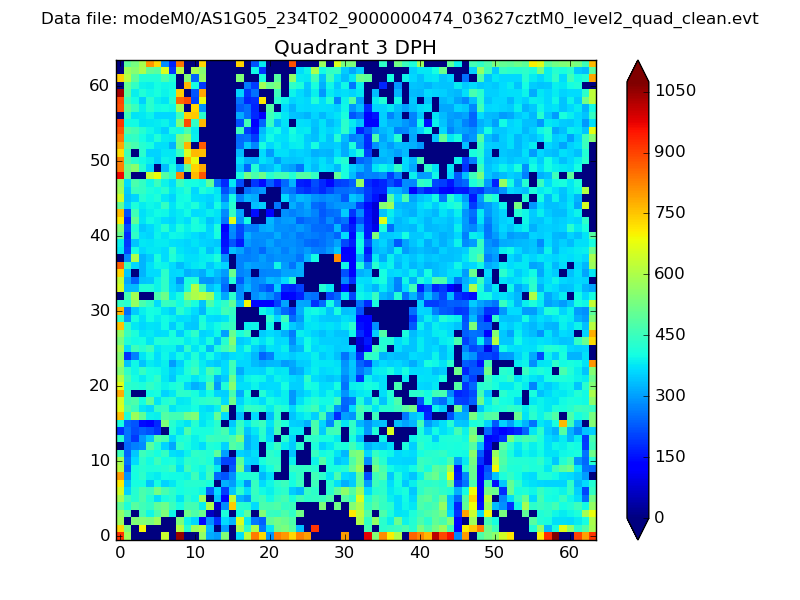 |
 |
Quadrant C |
| Plot type | Count rate plots | Images |
|---|---|---|
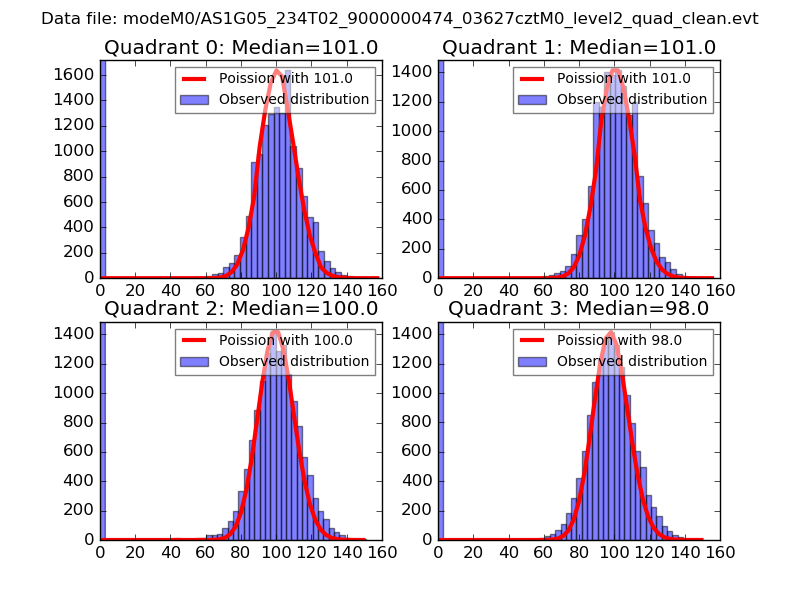
| Comparison with Poisson distribution Blue bars denote a histogram of data divided into 1 sec bins. Red curve is a Poisson curve with rate = median count rate of data. |
 |
 |
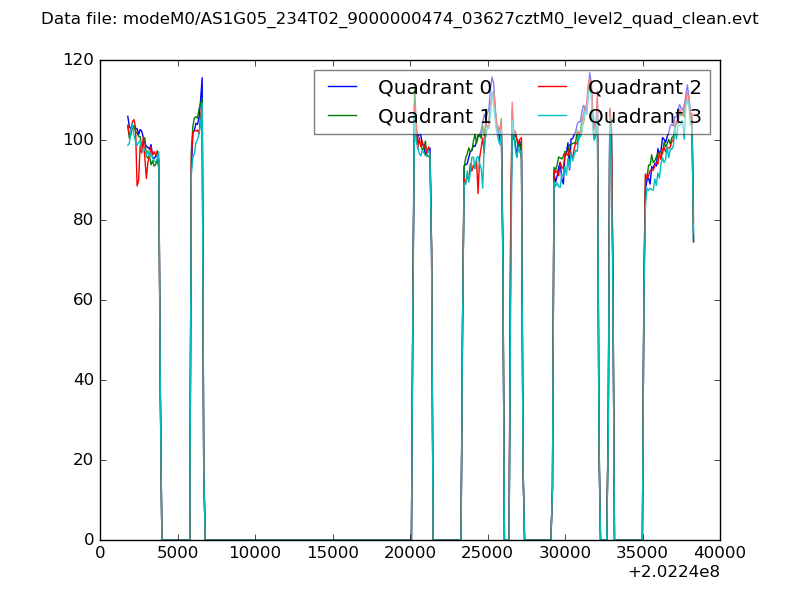
| Quadrant-wise count rates Data is divided into 100 sec bins |
 |
|
| Module-wise count rates for Quadrant A Data is divided into 100 sec bins |
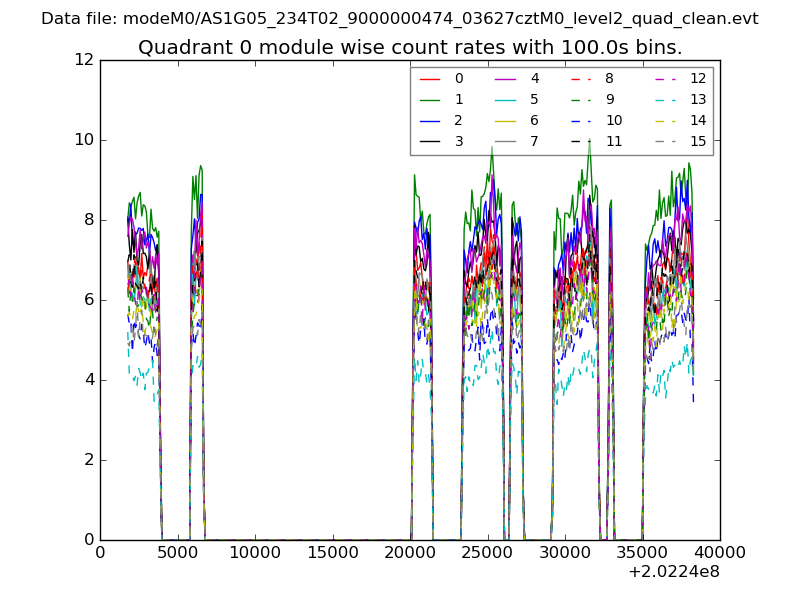 |
 |
| Module-wise count rates for Quadrant B Data is divided into 100 sec bins |
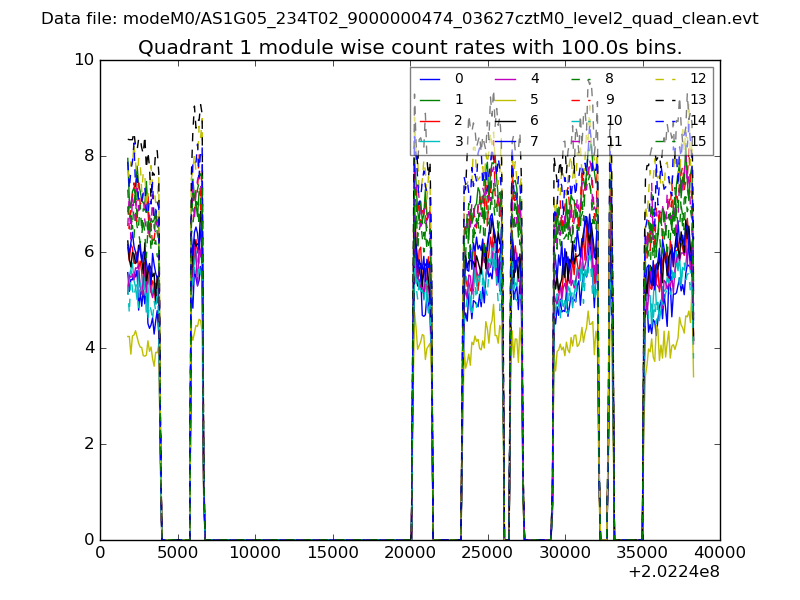 |
 |
| Module-wise count rates for Quadrant C Data is divided into 100 sec bins |
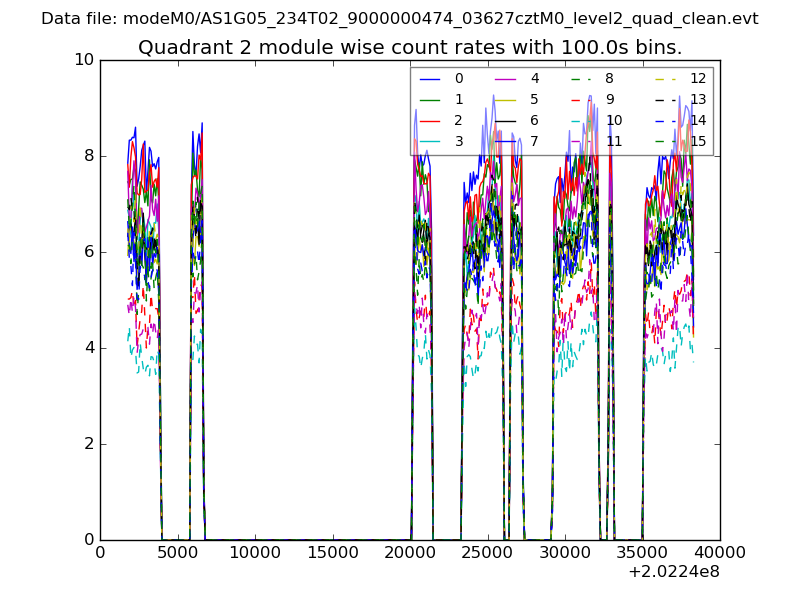 |
 |
| Module-wise count rates for Quadrant D Data is divided into 100 sec bins |
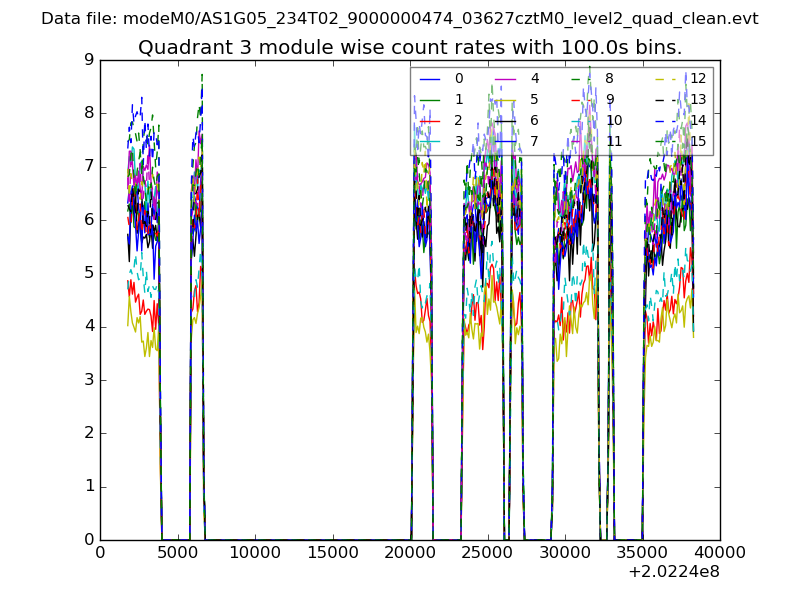 |
 |
| Parameter | Plot |
|---|---|
| CZT HV Monitor | 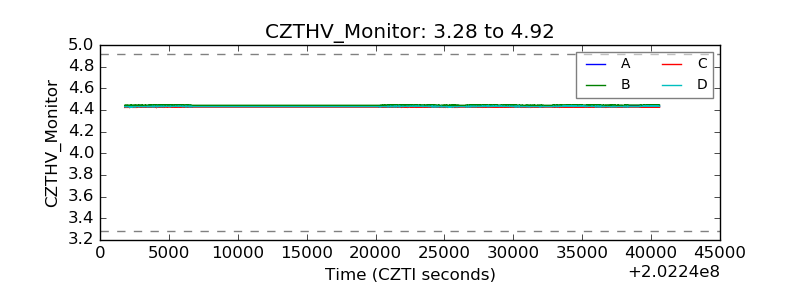 |
| D_VDD | 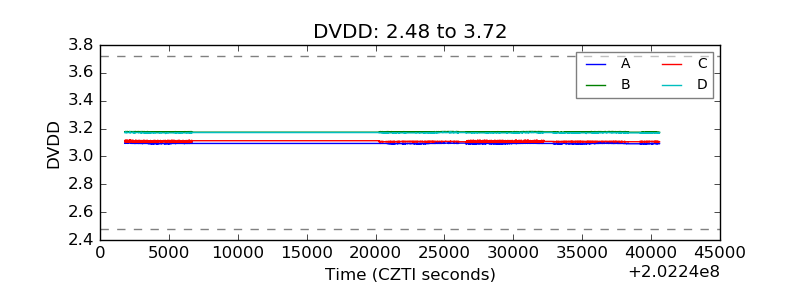 |
| Temperature 1 | 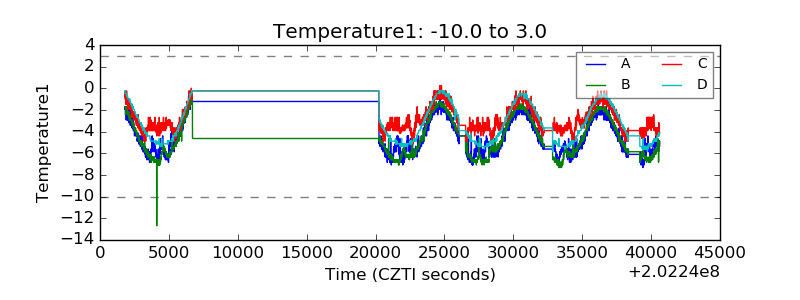 |
| Veto HV Monitor | 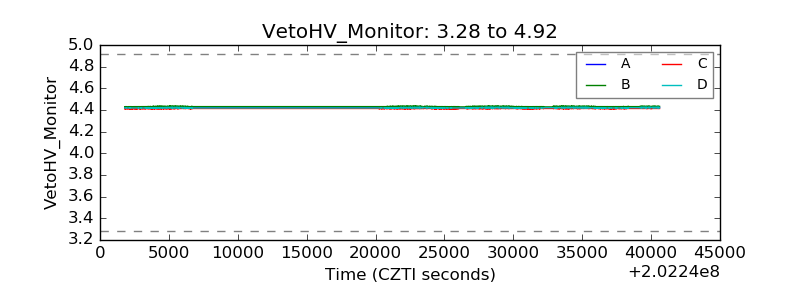 |
| Veto LLD | 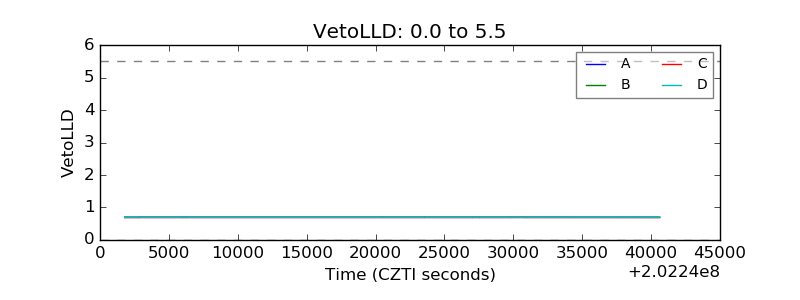 |
| Alpha Counter | 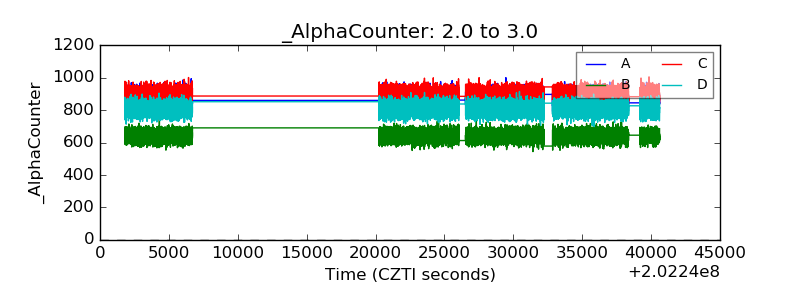 |
| _CPM_Rate | 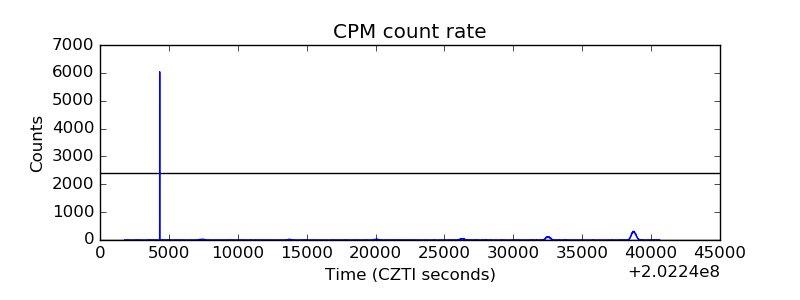 |
| CZT Counter | 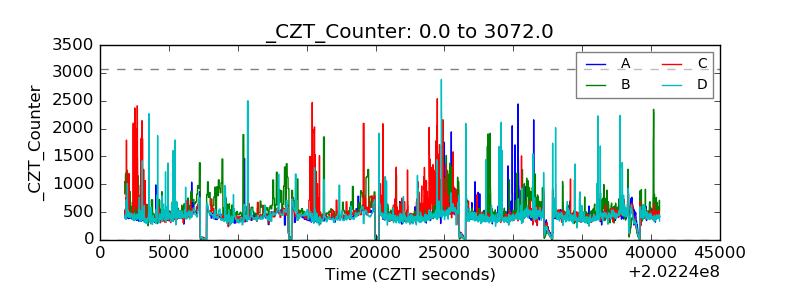 |
| +2.5 Volts monitor |  |
| +5 Volts monitor |  |
| Veto Counter | 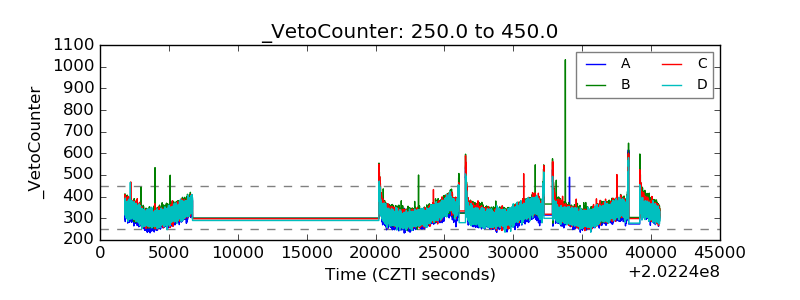 |