| Param | Original file | Final file |
|---|---|---|
| Filename | modeM0/AS1G05_234T02_9000000474_03628cztM0_level2.evt | modeM0/AS1G05_234T02_9000000474_03628cztM0_level2_quad_clean.evt |
| Size (bytes) | 451,362,240 | 61,758,720 |
| Size | 430.5 MB | 58.9 MB |
| Events in quadrant A | 2,969,424 | 360,783 |
| Events in quadrant B | 3,725,101 | 356,496 |
| Events in quadrant C | 3,305,470 | 354,268 |
| Events in quadrant D | 3,224,506 | 341,920 |
| Mode M9 | |||
|---|---|---|---|
| Quadrant | BADHDUFLAG | Total packets | Discarded packets |
| A | 0 | 10 | 0 |
| B | 0 | 10 | 0 |
| C | 0 | 10 | 0 |
| D | 0 | 10 | 0 |
| Mode SS | |||
|---|---|---|---|
| Quadrant | BADHDUFLAG | Total packets | Discarded packets |
| A | 0 | 132 | 0 |
| B | 0 | 132 | 0 |
| C | 0 | 132 | 0 |
| D | 0 | 132 | 0 |
| Mode M0 | |||
|---|---|---|---|
| Quadrant | BADHDUFLAG | Total packets | Discarded packets |
| A | 0 | 13381 | 2 |
| B | 0 | 15196 | 1 |
| C | 0 | 14462 | 1 |
| D | 0 | 14501 | 1 |
| Quadrant | Total seconds | Saturated seconds | Saturation percentage |
|---|---|---|---|
| A | 6546 | 61 | 0.931867% |
| B | 6546 | 118 | 1.802628% |
| C | 6546 | 118 | 1.802628% |
| D | 6546 | 141 | 2.153987% |
Noise dominated data is calculated using 1-second bins in cleaned event files. If a bin has >2000 counts, and if more than 50% of those come from <1% of pixels, then it is considered to be noise-dominated and hence unusable.
| Quadrant | # 1 sec bins | Bins with >0 counts | Bins with >2000 counts | High rate bins dominated by noise | Noise dominated (total time) | Noise dominated (detector-on time) | Marked lightcurve |
|---|---|---|---|---|---|---|---|
| A | 7501 | 6547 | 8 | 8 | 0.11% | 0.12% | 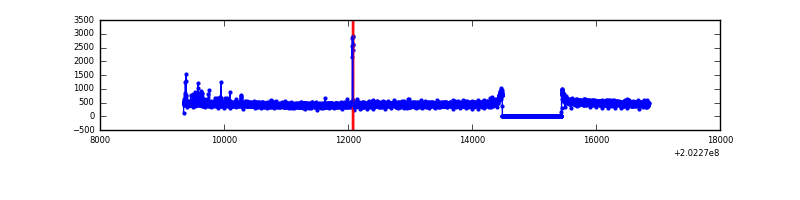 |
| B | 7501 | 6547 | 36 | 36 | 0.48% | 0.55% | 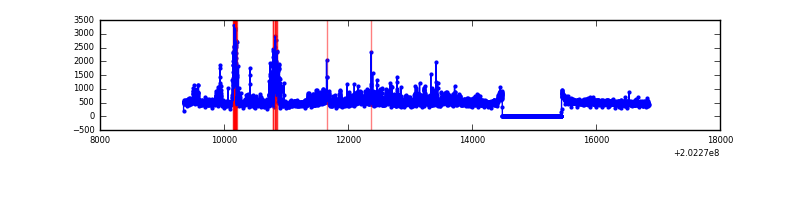 |
| C | 7501 | 6547 | 59 | 59 | 0.79% | 0.90% | 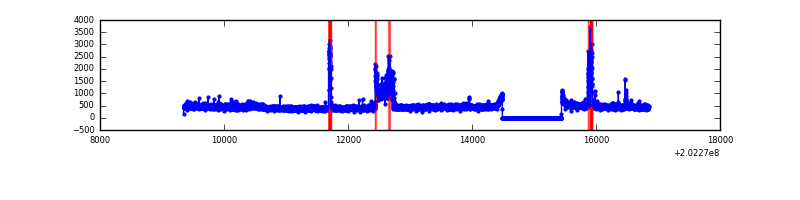 |
| D | 7501 | 6547 | 82 | 82 | 1.09% | 1.25% | 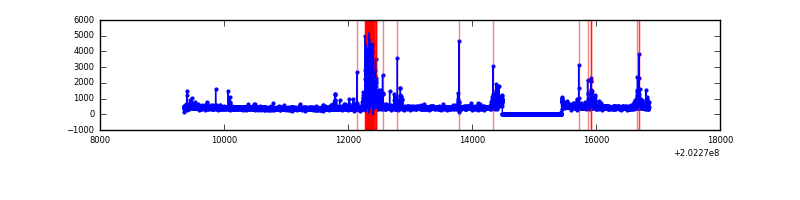 |
Top three noisy pixels from each quadrant. If the there are fewer than three noisy pixels in the level2.evt file, extra rows are filled as -1
| Pixel properties | Quadrant properties | ||||||
|---|---|---|---|---|---|---|---|
| Quadrant | DetID | PixID | Counts | Sigma | Mean | Median | Sigma |
| A | 0 | 31 | 26640 | 166.05 | 752 | 733 | 156.0 |
| A | 15 | 174 | 20946 | 129.55 | 752 | 733 | 156.0 |
| A | 13 | 14 | 14918 | 90.92 | 752 | 733 | 156.0 |
| B | 15 | 204 | 350232 | 2366.91 | 759 | 739 | 147.7 |
| B | 4 | 81 | 165781 | 1117.73 | 759 | 739 | 147.7 |
| B | 5 | 171 | 81809 | 549.04 | 759 | 739 | 147.7 |
| C | 2 | 53 | 359538 | 2116.41 | 725 | 727 | 169.5 |
| C | 9 | 247 | 103989 | 609.08 | 725 | 727 | 169.5 |
| C | 13 | 61 | 6277 | 32.74 | 725 | 727 | 169.5 |
| D | 9 | 35 | 287716 | 1646.81 | 722 | 701 | 174.3 |
| D | 13 | 223 | 97675 | 556.41 | 722 | 701 | 174.3 |
| D | 2 | 232 | 37950 | 213.72 | 722 | 701 | 174.3 |
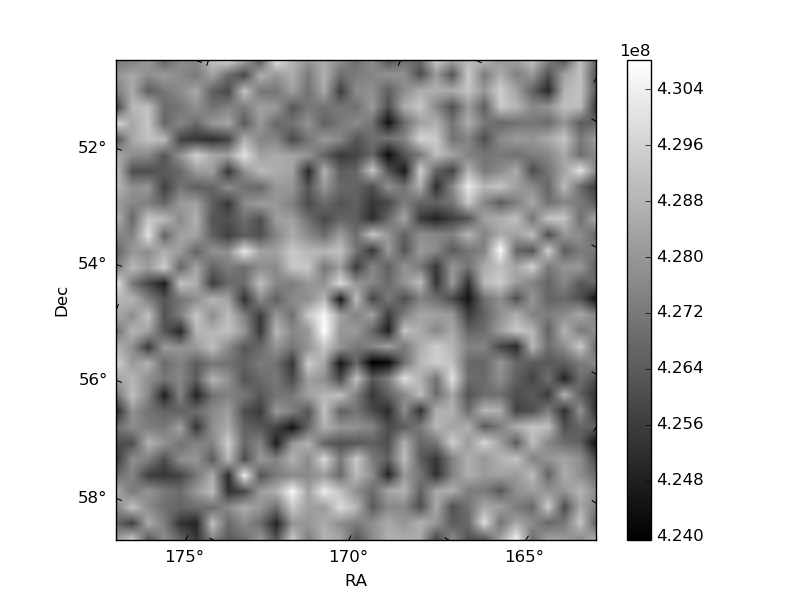
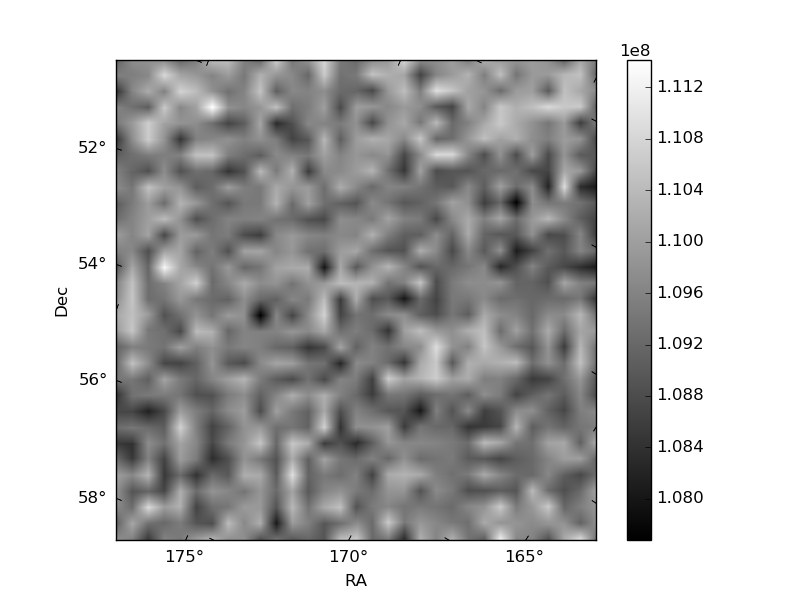
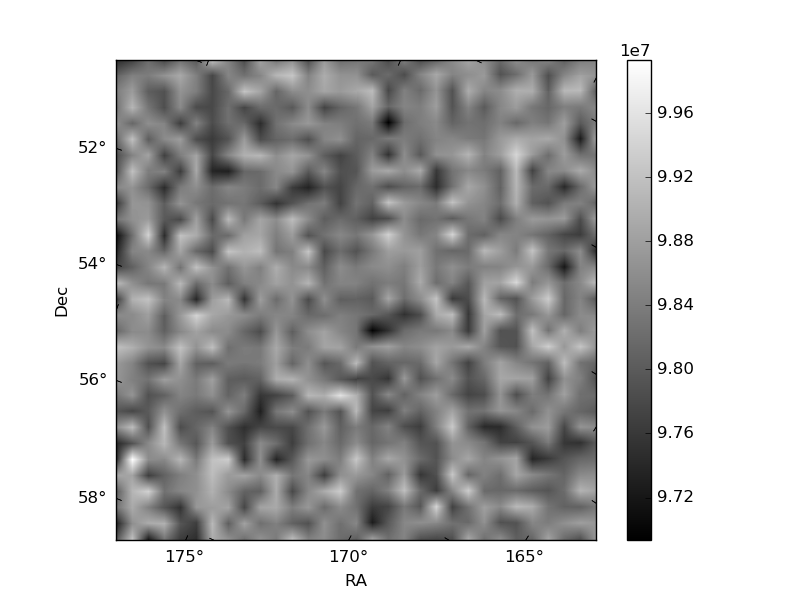
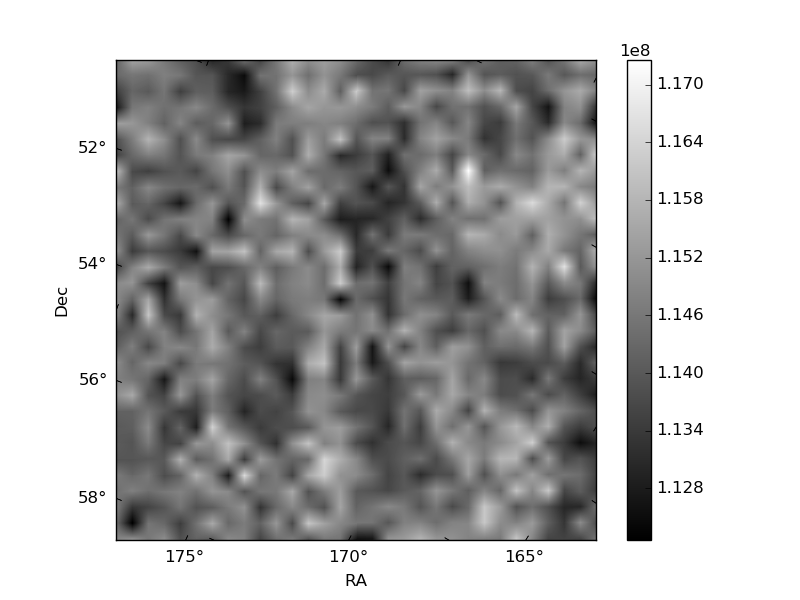
Histogram calculated using DETX and DETY for each event in the final _common_clean file
| Quadrant A | 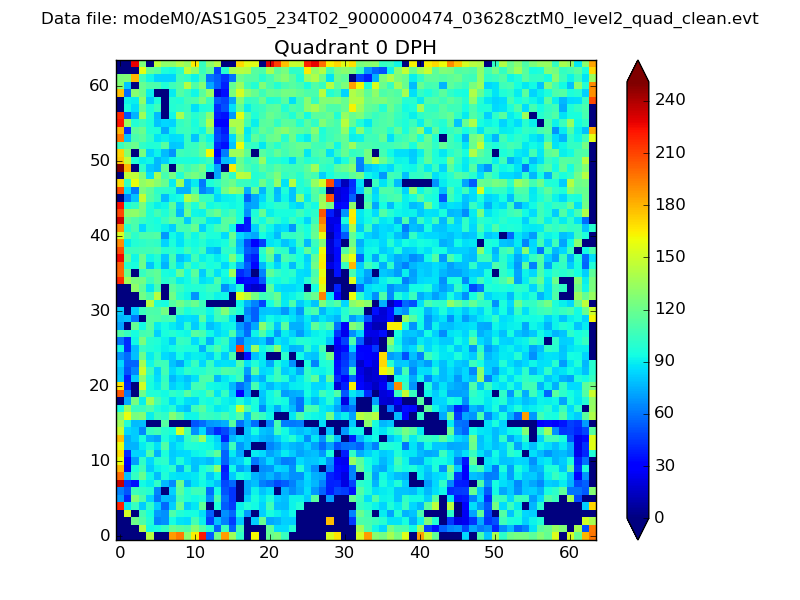 |
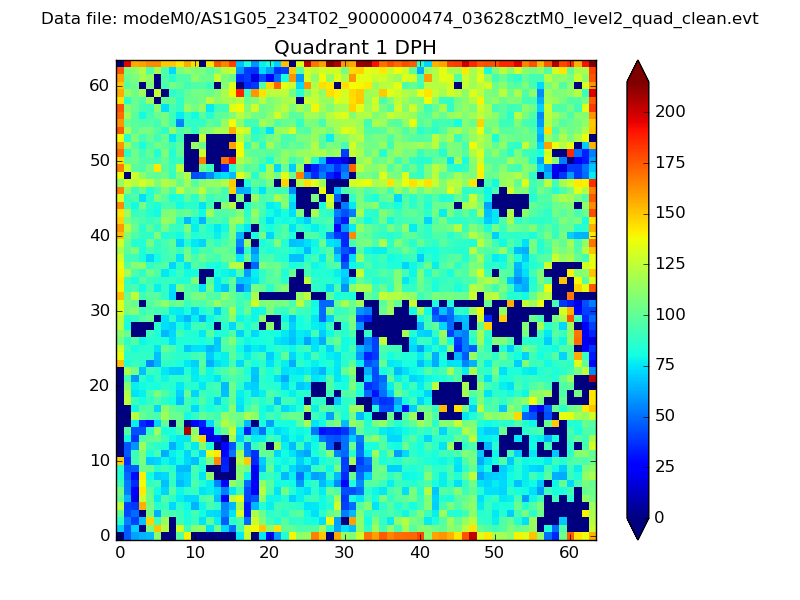 |
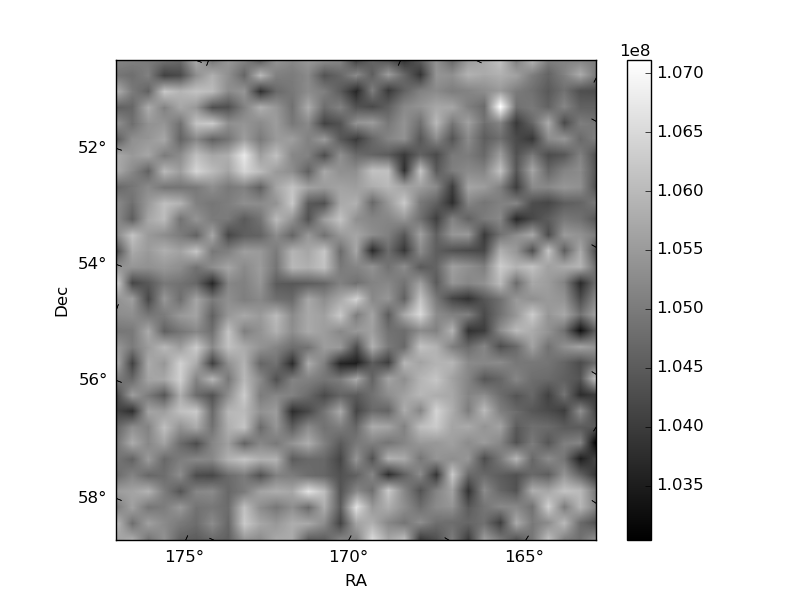
Quadrant B |
|---|---|---|---|
| Quadrant D | 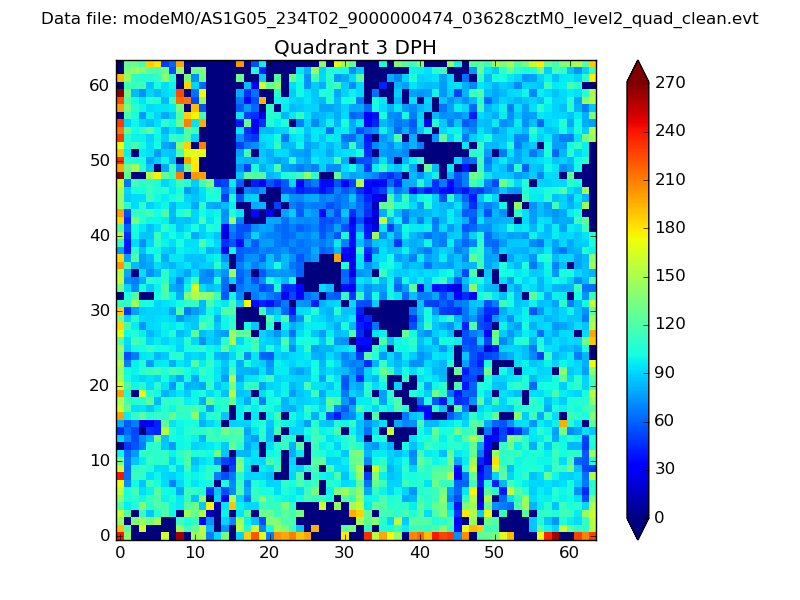 |
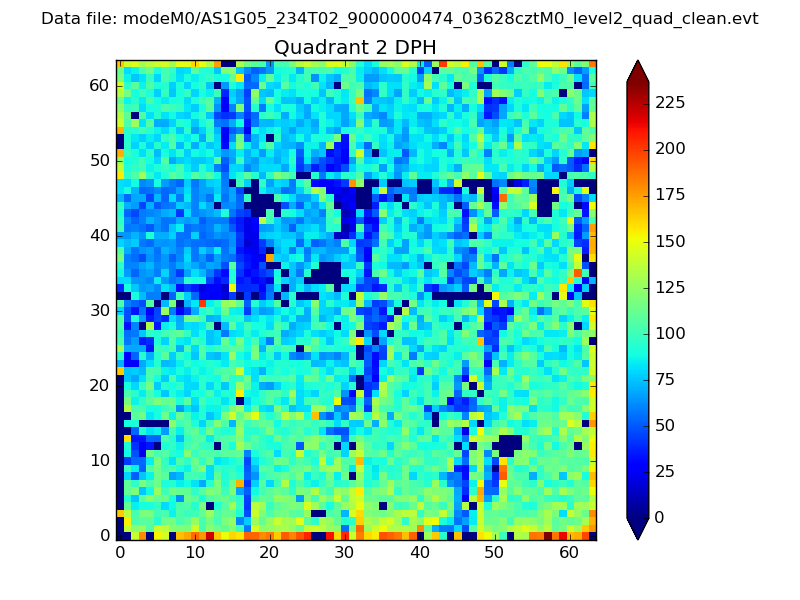 |
Quadrant C |
| Plot type | Count rate plots | Images |
|---|---|---|
| Comparison with Poisson distribution Blue bars denote a histogram of data divided into 1 sec bins. Red curve is a Poisson curve with rate = median count rate of data. |
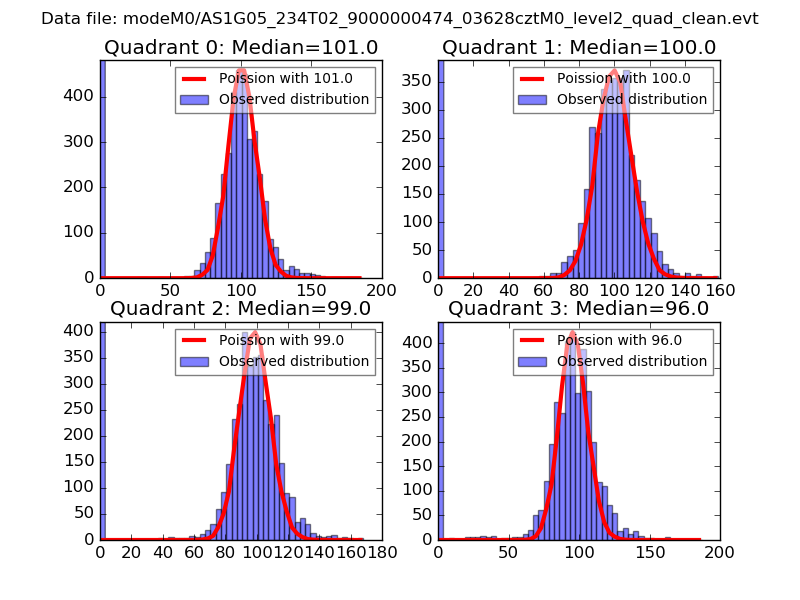 |
 |
| Quadrant-wise count rates Data is divided into 100 sec bins |
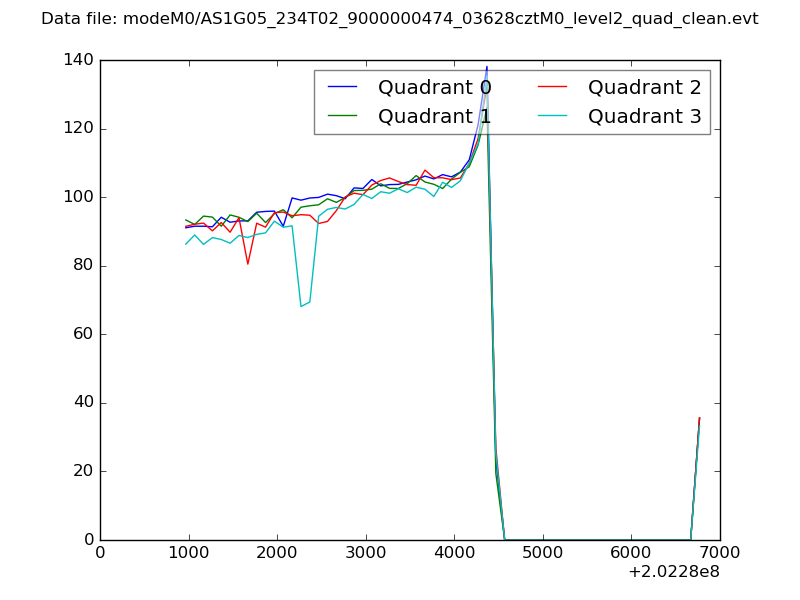 |
|
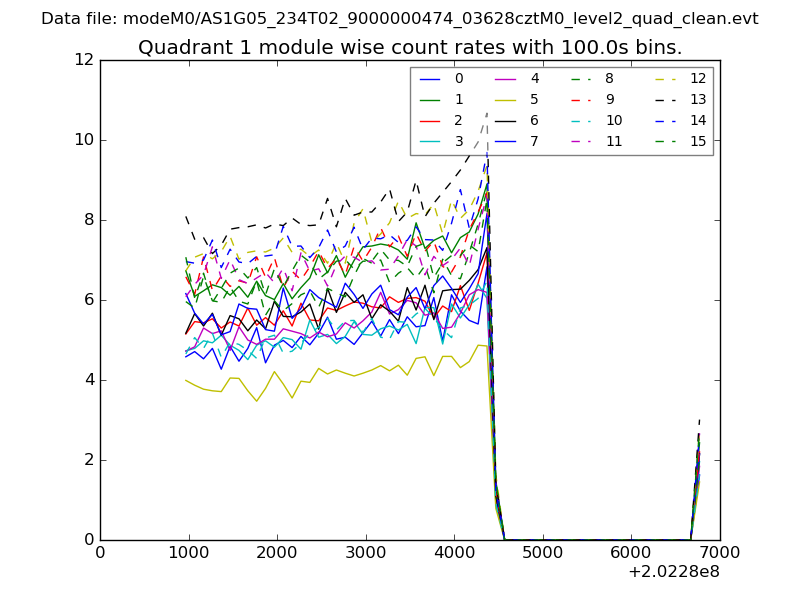
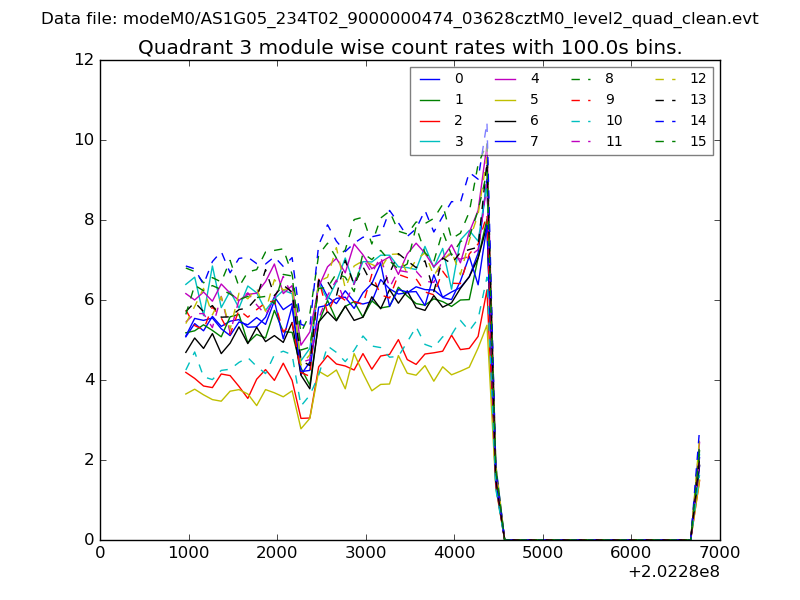
| Module-wise count rates for Quadrant A Data is divided into 100 sec bins |
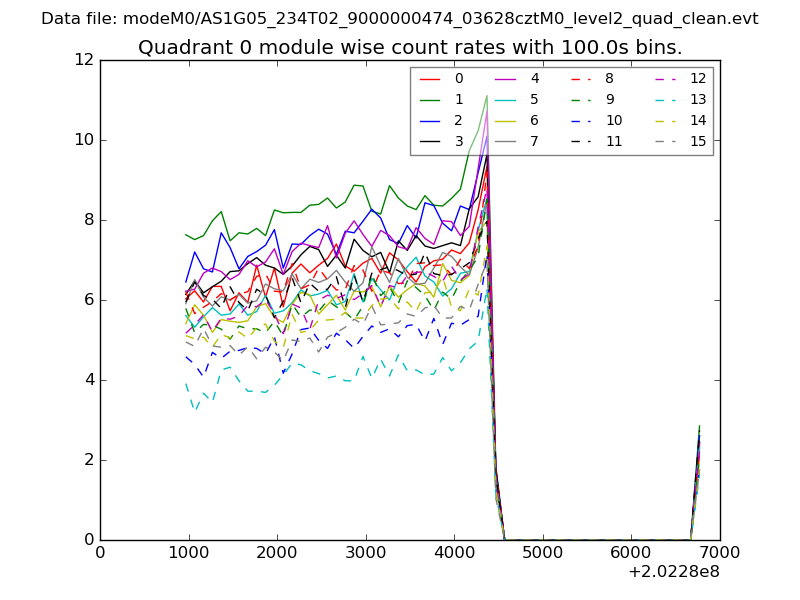 |
 |
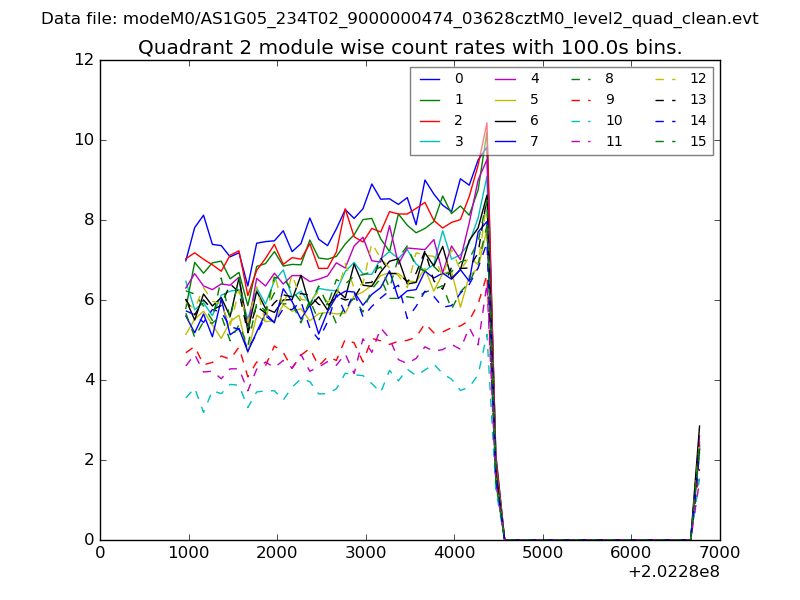
| Module-wise count rates for Quadrant B Data is divided into 100 sec bins |
 |
 |
| Module-wise count rates for Quadrant C Data is divided into 100 sec bins |
 |
 |
| Module-wise count rates for Quadrant D Data is divided into 100 sec bins |
 |
 |
| Parameter | Plot |
|---|---|
| CZT HV Monitor | 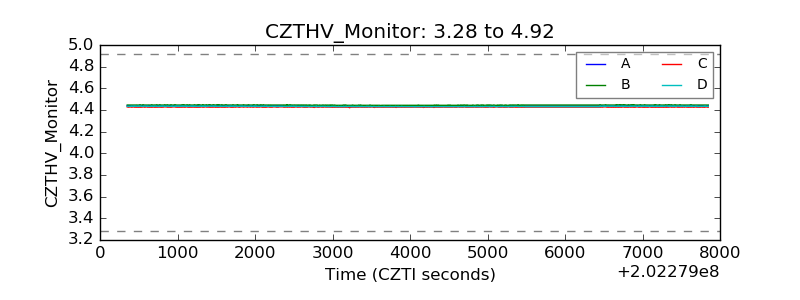 |
| D_VDD |  |
| Temperature 1 | 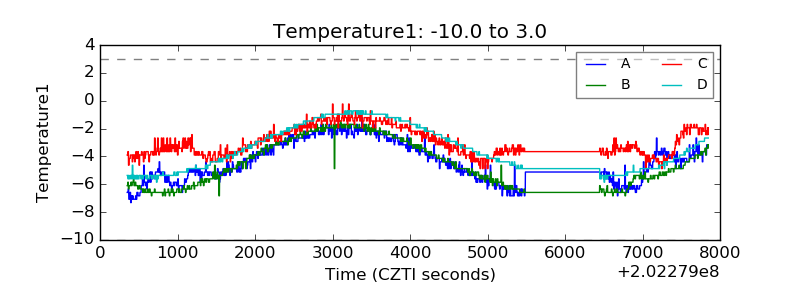 |
| Veto HV Monitor |  |
| Veto LLD | 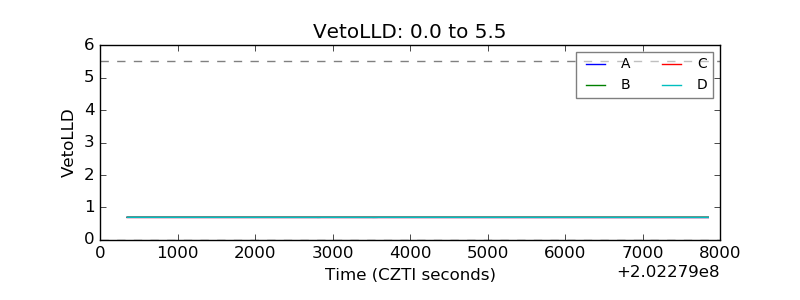 |
| Alpha Counter | 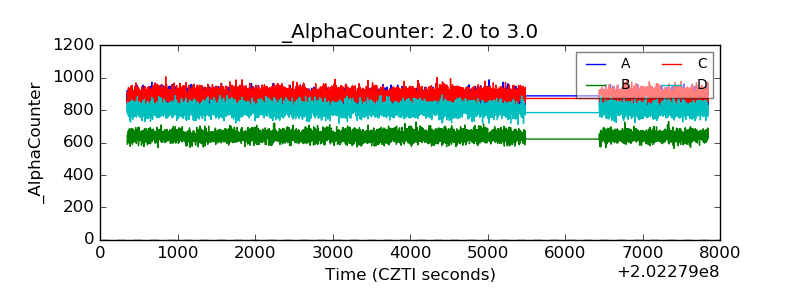 |
| _CPM_Rate | 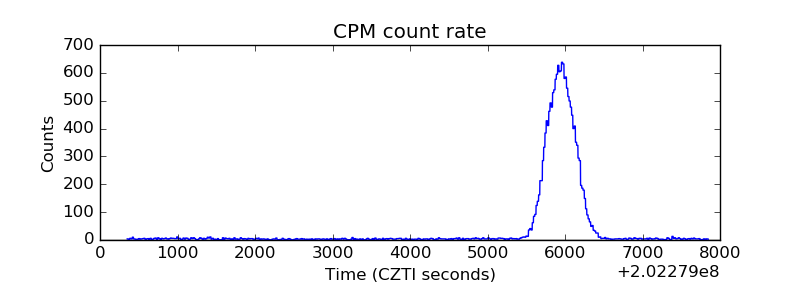 |
| CZT Counter | 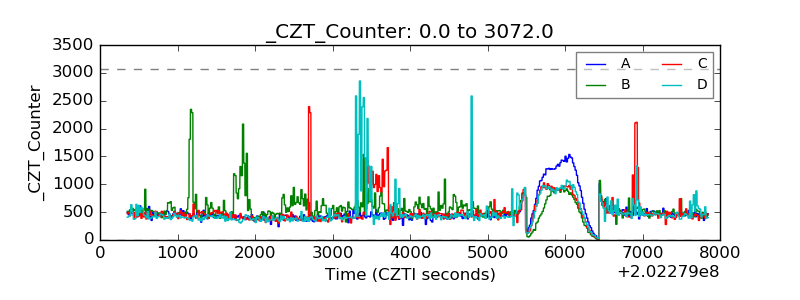 |
| +2.5 Volts monitor |  |
| +5 Volts monitor |  |
| Veto Counter | 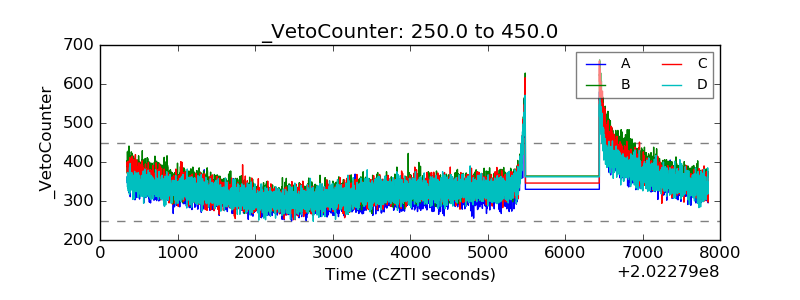 |