| Param | Original file | Final file |
|---|---|---|
| Filename | modeM0/AS1G05_234T02_9000000474_03633cztM0_level2.evt | modeM0/AS1G05_234T02_9000000474_03633cztM0_level2_quad_clean.evt |
| Size (bytes) | 431,573,760 | 83,908,800 |
| Size | 411.6 MB | 80.0 MB |
| Events in quadrant A | 2,862,595 | 548,564 |
| Events in quadrant B | 3,376,149 | 540,564 |
| Events in quadrant C | 3,461,982 | 520,662 |
| Events in quadrant D | 2,970,415 | 521,276 |
| Mode M9 | |||
|---|---|---|---|
| Quadrant | BADHDUFLAG | Total packets | Discarded packets |
| A | 0 | 12 | 0 |
| B | 0 | 12 | 0 |
| C | 0 | 12 | 0 |
| D | 0 | 12 | 0 |
| Mode SS | |||
|---|---|---|---|
| Quadrant | BADHDUFLAG | Total packets | Discarded packets |
| A | 0 | 120 | 0 |
| B | 0 | 120 | 0 |
| C | 0 | 120 | 0 |
| D | 0 | 120 | 0 |
| Mode M0 | |||
|---|---|---|---|
| Quadrant | BADHDUFLAG | Total packets | Discarded packets |
| A | 0 | 12397 | 2 |
| B | 0 | 13829 | 1 |
| C | 0 | 14194 | 1 |
| D | 0 | 12665 | 1 |
| Quadrant | Total seconds | Saturated seconds | Saturation percentage |
|---|---|---|---|
| A | 5864 | 134 | 2.285130% |
| B | 5864 | 140 | 2.387449% |
| C | 5864 | 318 | 5.422920% |
| D | 5864 | 102 | 1.739427% |
Noise dominated data is calculated using 1-second bins in cleaned event files. If a bin has >2000 counts, and if more than 50% of those come from <1% of pixels, then it is considered to be noise-dominated and hence unusable.
| Quadrant | # 1 sec bins | Bins with >0 counts | Bins with >2000 counts | High rate bins dominated by noise | Noise dominated (total time) | Noise dominated (detector-on time) | Marked lightcurve |
|---|---|---|---|---|---|---|---|
| A | 7079 | 5865 | 5 | 5 | 0.07% | 0.09% | 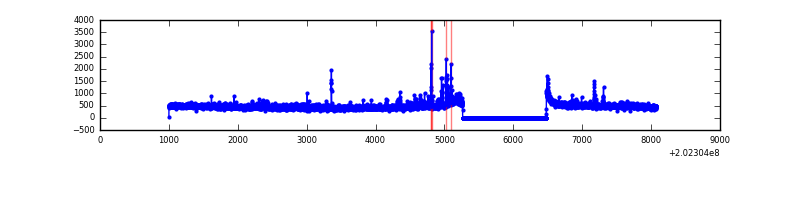 |
| B | 7079 | 5865 | 16 | 16 | 0.23% | 0.27% | 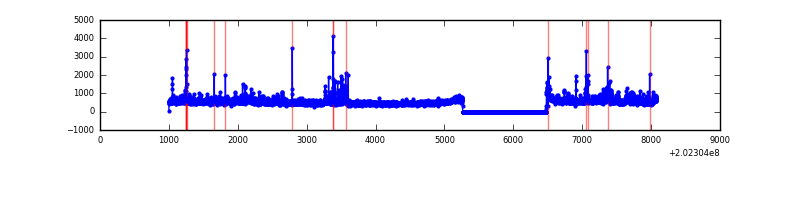 |
| C | 7079 | 5865 | 181 | 181 | 2.56% | 3.09% | 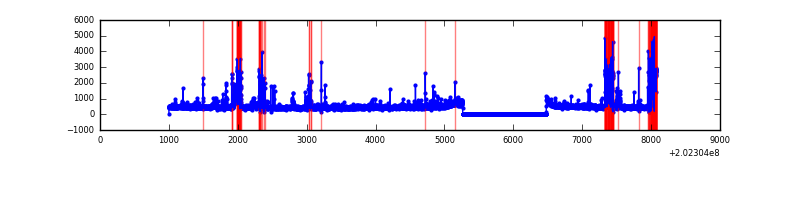 |
| D | 7079 | 5865 | 17 | 17 | 0.24% | 0.29% | 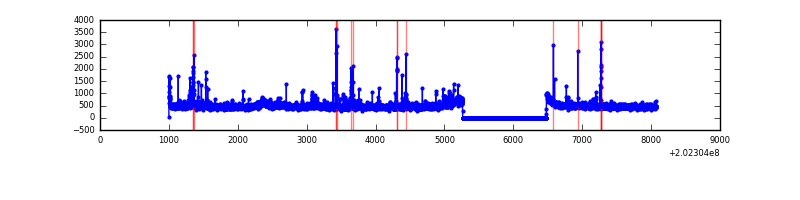 |
Top three noisy pixels from each quadrant. If the there are fewer than three noisy pixels in the level2.evt file, extra rows are filled as -1
| Pixel properties | Quadrant properties | ||||||
|---|---|---|---|---|---|---|---|
| Quadrant | DetID | PixID | Counts | Sigma | Mean | Median | Sigma |
| A | 0 | 50 | 95748 | 673.07 | 700 | 685 | 141.2 |
| A | 3 | 1 | 38678 | 269.0 | 700 | 685 | 141.2 |
| A | 14 | 238 | 18411 | 125.5 | 700 | 685 | 141.2 |
| B | 15 | 204 | 301217 | 2268.06 | 702 | 685 | 132.5 |
| B | 4 | 239 | 89015 | 666.61 | 702 | 685 | 132.5 |
| B | 4 | 81 | 45259 | 336.39 | 702 | 685 | 132.5 |
| C | 2 | 53 | 679379 | 4388.4 | 668 | 670 | 154.7 |
| C | 9 | 247 | 145383 | 935.69 | 668 | 670 | 154.7 |
| C | 1 | 16 | 21883 | 137.16 | 668 | 670 | 154.7 |
| D | 8 | 195 | 126547 | 772.78 | 685 | 666 | 162.9 |
| D | 13 | 223 | 43473 | 262.79 | 685 | 666 | 162.9 |
| D | 14 | 34 | 35099 | 211.38 | 685 | 666 | 162.9 |
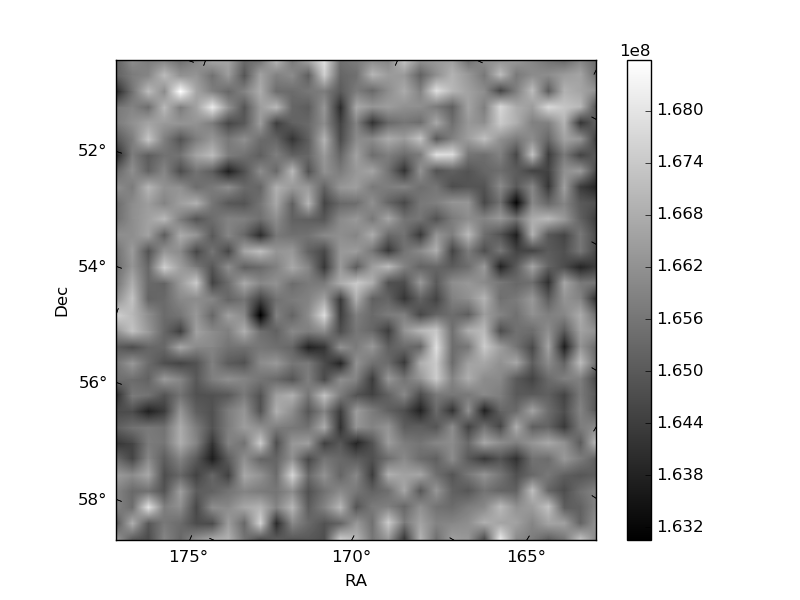
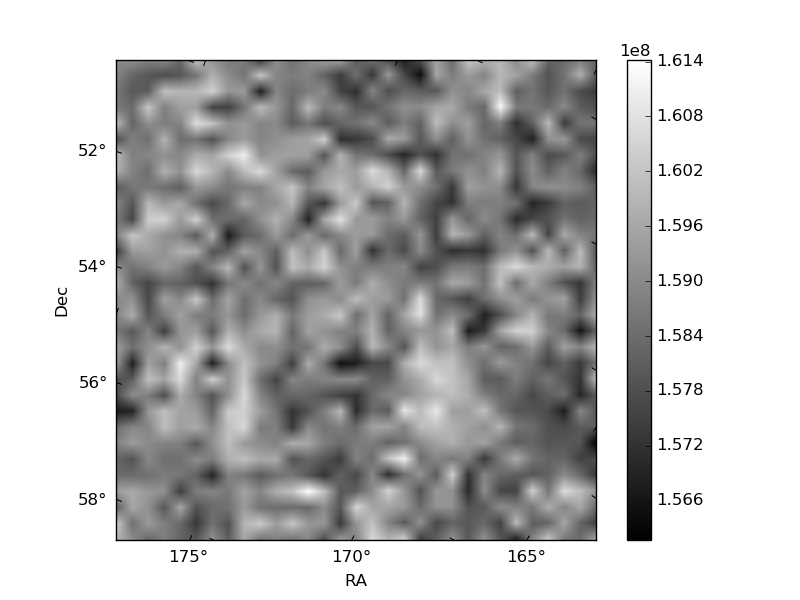
Histogram calculated using DETX and DETY for each event in the final _common_clean file
| Quadrant A | 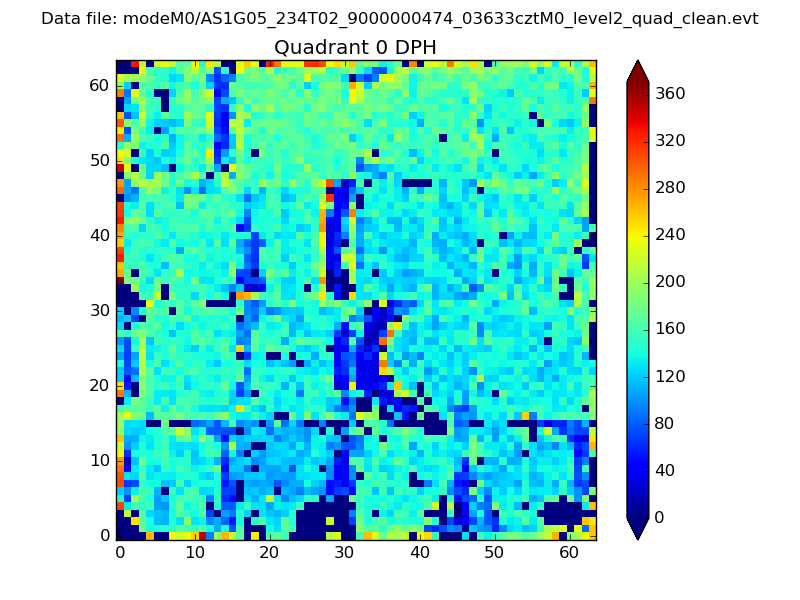 |
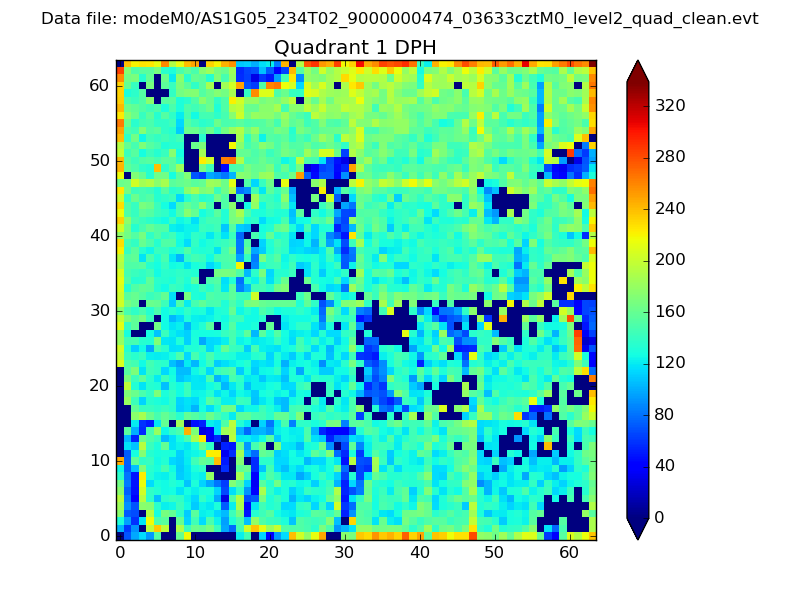 |
Quadrant B |
|---|---|---|---|
| Quadrant D | 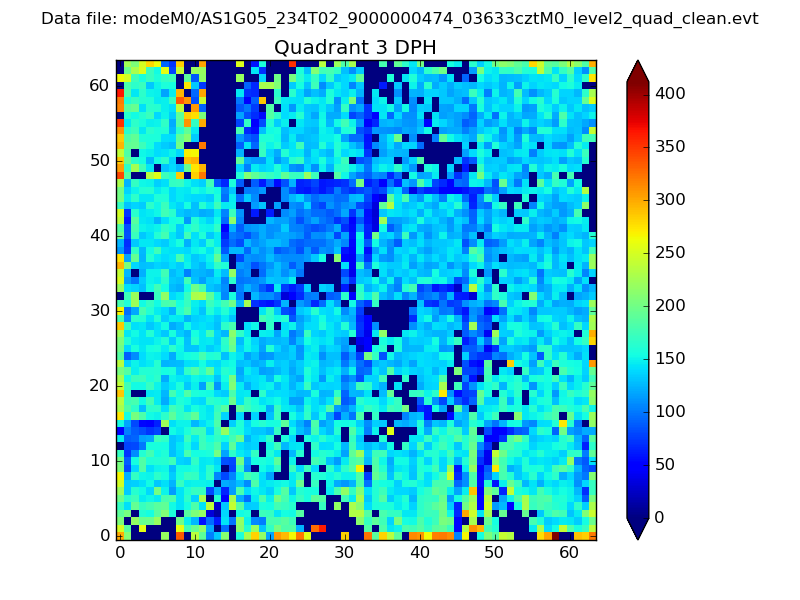 |
 |
Quadrant C |
| Plot type | Count rate plots | Images |
|---|---|---|
| Comparison with Poisson distribution Blue bars denote a histogram of data divided into 1 sec bins. Red curve is a Poisson curve with rate = median count rate of data. |
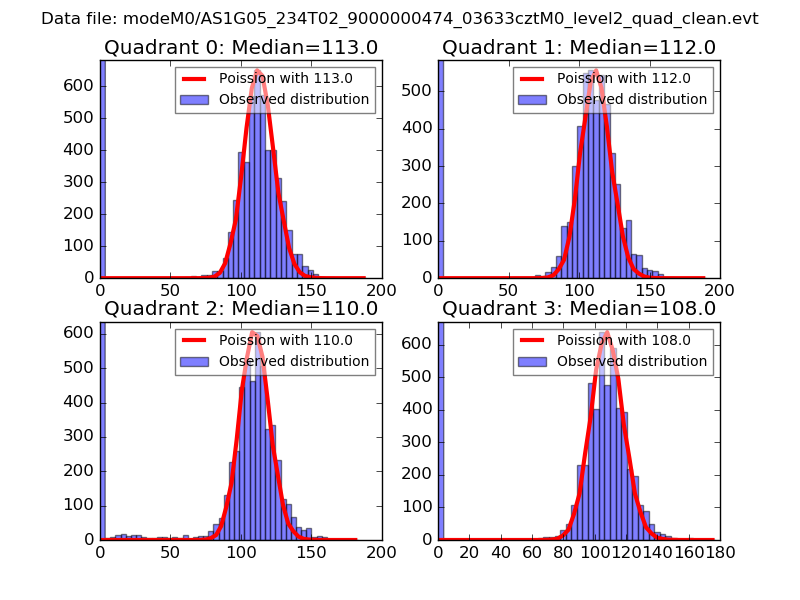 |
 |
| Quadrant-wise count rates Data is divided into 100 sec bins |
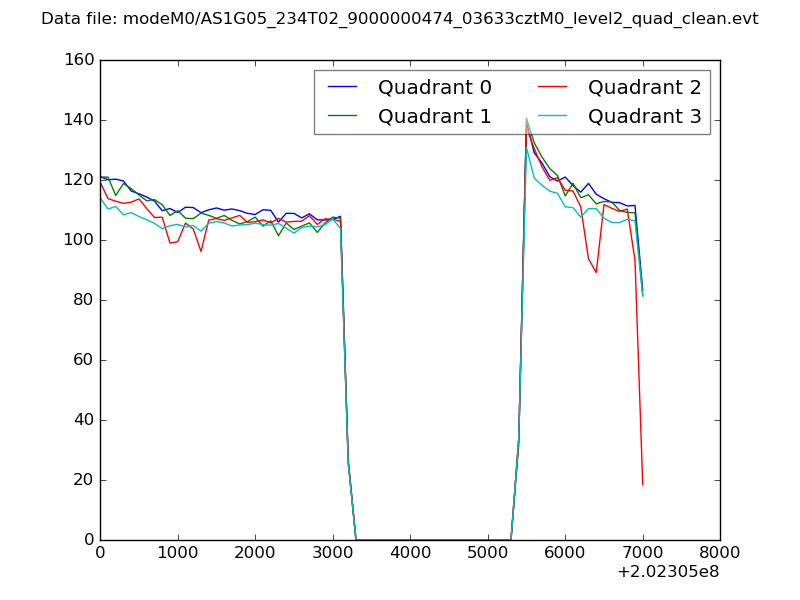 |
|
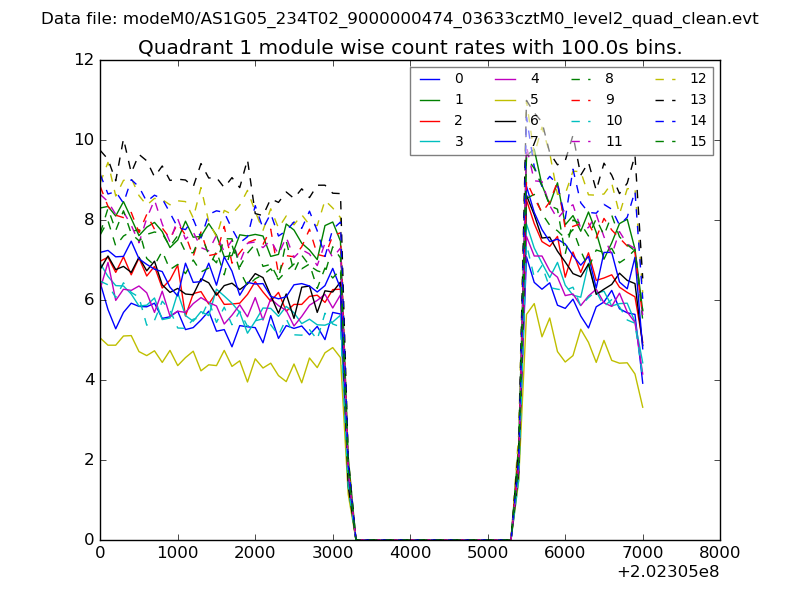
| Module-wise count rates for Quadrant A Data is divided into 100 sec bins |
 |
 |
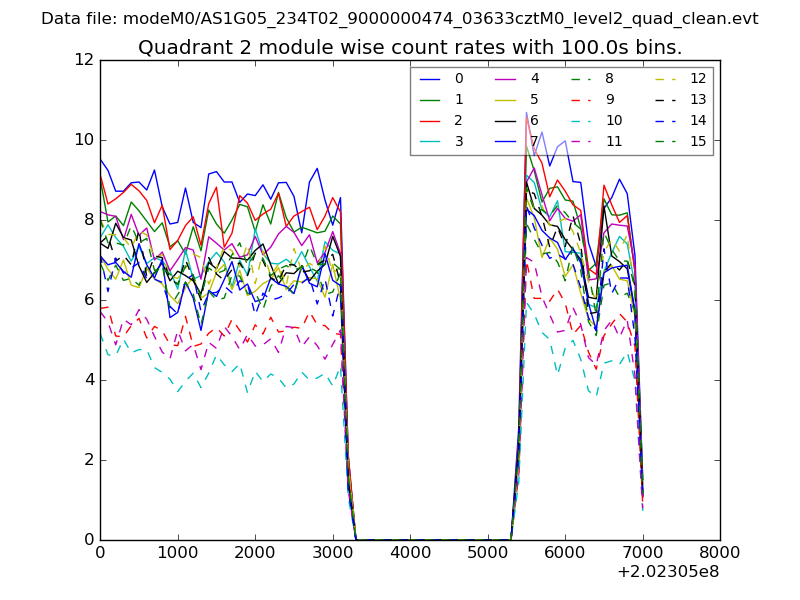
| Module-wise count rates for Quadrant B Data is divided into 100 sec bins |
 |
 |
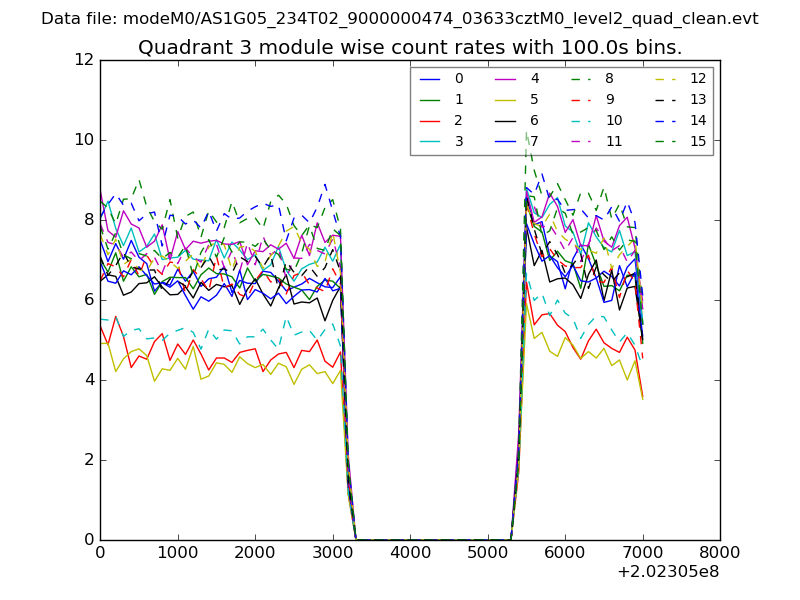
| Module-wise count rates for Quadrant C Data is divided into 100 sec bins |
 |
 |
| Module-wise count rates for Quadrant D Data is divided into 100 sec bins |
 |
 |
| Parameter | Plot |
|---|---|
| CZT HV Monitor | 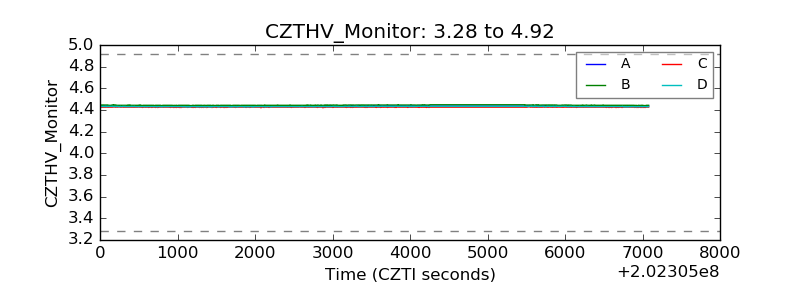 |
| D_VDD | 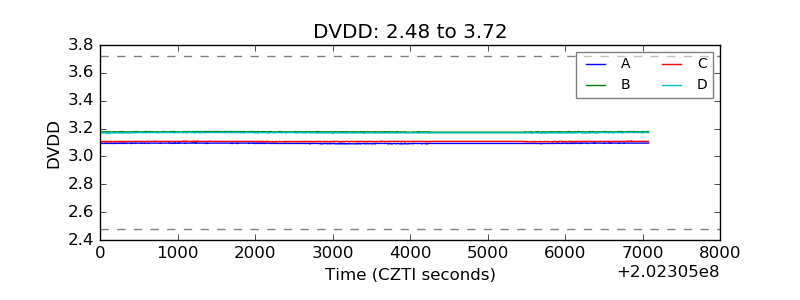 |
| Temperature 1 | 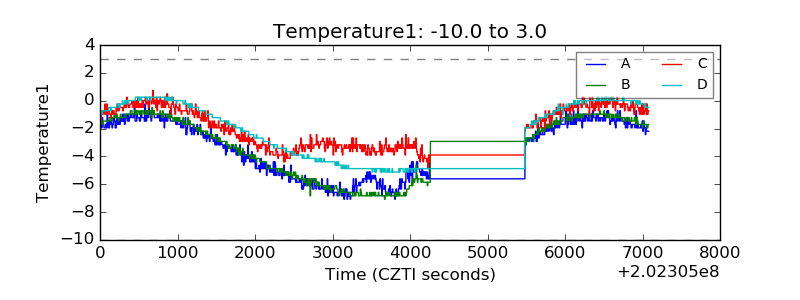 |
| Veto HV Monitor |  |
| Veto LLD | 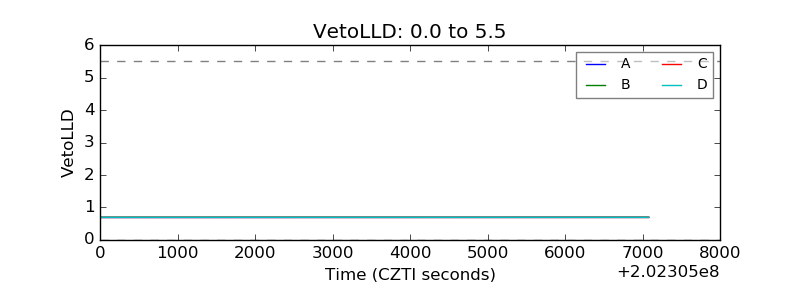 |
| Alpha Counter | 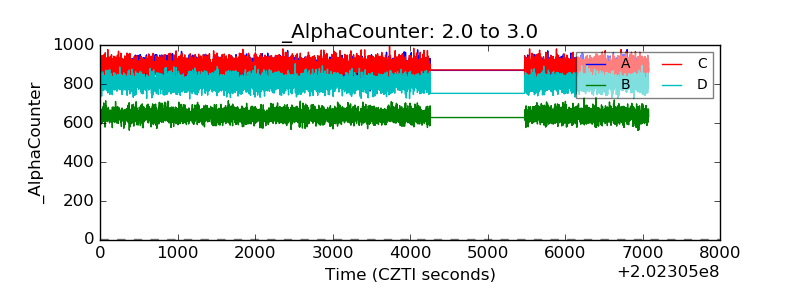 |
| _CPM_Rate | 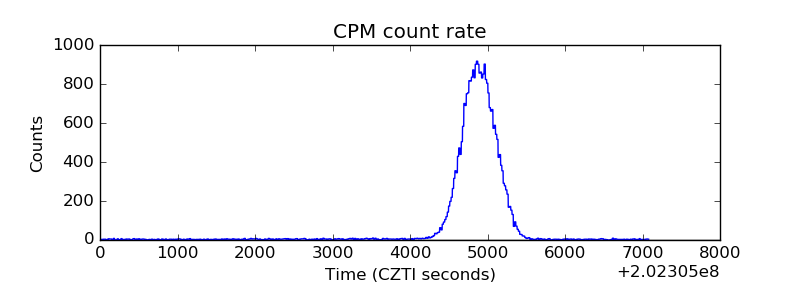 |
| CZT Counter |  |
| +2.5 Volts monitor |  |
| +5 Volts monitor |  |
| Veto Counter | 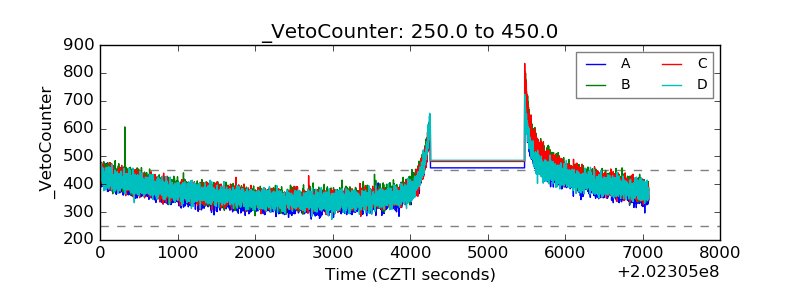 |