| Param | Original file | Final file |
|---|---|---|
| Filename | modeM0/AS1G05_234T02_9000000474_03634cztM0_level2.evt | modeM0/AS1G05_234T02_9000000474_03634cztM0_level2_quad_clean.evt |
| Size (bytes) | 436,919,040 | 78,059,520 |
| Size | 416.7 MB | 74.4 MB |
| Events in quadrant A | 2,809,407 | 498,523 |
| Events in quadrant B | 3,493,895 | 490,661 |
| Events in quadrant C | 3,539,657 | 473,356 |
| Events in quadrant D | 2,977,707 | 478,510 |
| Mode M9 | |||
|---|---|---|---|
| Quadrant | BADHDUFLAG | Total packets | Discarded packets |
| A | 0 | 12 | 0 |
| B | 0 | 12 | 0 |
| C | 0 | 12 | 0 |
| D | 0 | 12 | 0 |
| Mode SS | |||
|---|---|---|---|
| Quadrant | BADHDUFLAG | Total packets | Discarded packets |
| A | 0 | 122 | 0 |
| B | 0 | 122 | 0 |
| C | 0 | 122 | 0 |
| D | 0 | 122 | 0 |
| Mode M0 | |||
|---|---|---|---|
| Quadrant | BADHDUFLAG | Total packets | Discarded packets |
| A | 0 | 12564 | 2 |
| B | 0 | 14318 | 1 |
| C | 0 | 14750 | 1 |
| D | 0 | 12997 | 1 |
| Quadrant | Total seconds | Saturated seconds | Saturation percentage |
|---|---|---|---|
| A | 6055 | 107 | 1.767135% |
| B | 6055 | 82 | 1.354253% |
| C | 6055 | 313 | 5.169282% |
| D | 6055 | 95 | 1.568951% |
Noise dominated data is calculated using 1-second bins in cleaned event files. If a bin has >2000 counts, and if more than 50% of those come from <1% of pixels, then it is considered to be noise-dominated and hence unusable.
| Quadrant | # 1 sec bins | Bins with >0 counts | Bins with >2000 counts | High rate bins dominated by noise | Noise dominated (total time) | Noise dominated (detector-on time) | Marked lightcurve |
|---|---|---|---|---|---|---|---|
| A | 7225 | 6056 | 1 | 1 | 0.01% | 0.02% | 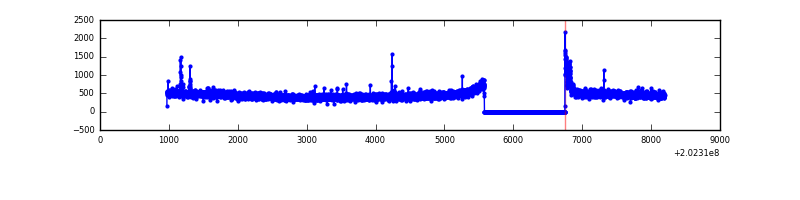 |
| B | 7225 | 6056 | 9 | 9 | 0.12% | 0.15% | 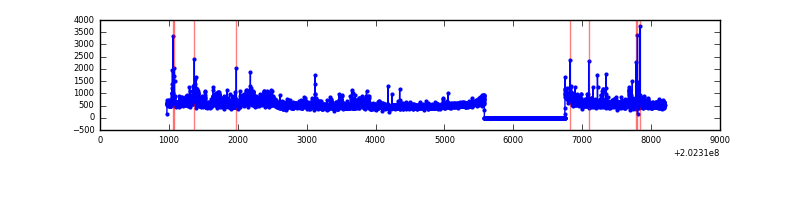 |
| C | 7225 | 6056 | 206 | 206 | 2.85% | 3.40% |  |
| D | 7225 | 6056 | 21 | 21 | 0.29% | 0.35% | 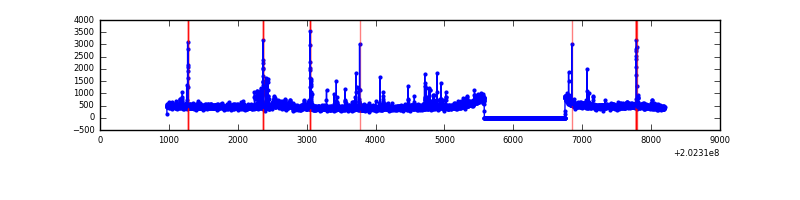 |
Top three noisy pixels from each quadrant. If the there are fewer than three noisy pixels in the level2.evt file, extra rows are filled as -1
| Pixel properties | Quadrant properties | ||||||
|---|---|---|---|---|---|---|---|
| Quadrant | DetID | PixID | Counts | Sigma | Mean | Median | Sigma |
| A | 0 | 149 | 35137 | 238.06 | 705 | 689 | 144.7 |
| A | 3 | 1 | 17737 | 117.81 | 705 | 689 | 144.7 |
| A | 0 | 226 | 10825 | 70.05 | 705 | 689 | 144.7 |
| B | 15 | 204 | 429440 | 3167.54 | 710 | 694 | 135.4 |
| B | 3 | 0 | 68213 | 498.82 | 710 | 694 | 135.4 |
| B | 4 | 81 | 59566 | 434.94 | 710 | 694 | 135.4 |
| C | 2 | 53 | 858856 | 5495.17 | 674 | 677 | 156.2 |
| C | 9 | 247 | 28299 | 176.87 | 674 | 677 | 156.2 |
| C | 1 | 16 | 14579 | 89.02 | 674 | 677 | 156.2 |
| D | 13 | 137 | 101475 | 607.01 | 692 | 672 | 166.1 |
| D | 8 | 195 | 83645 | 499.64 | 692 | 672 | 166.1 |
| D | 13 | 223 | 43038 | 255.12 | 692 | 672 | 166.1 |
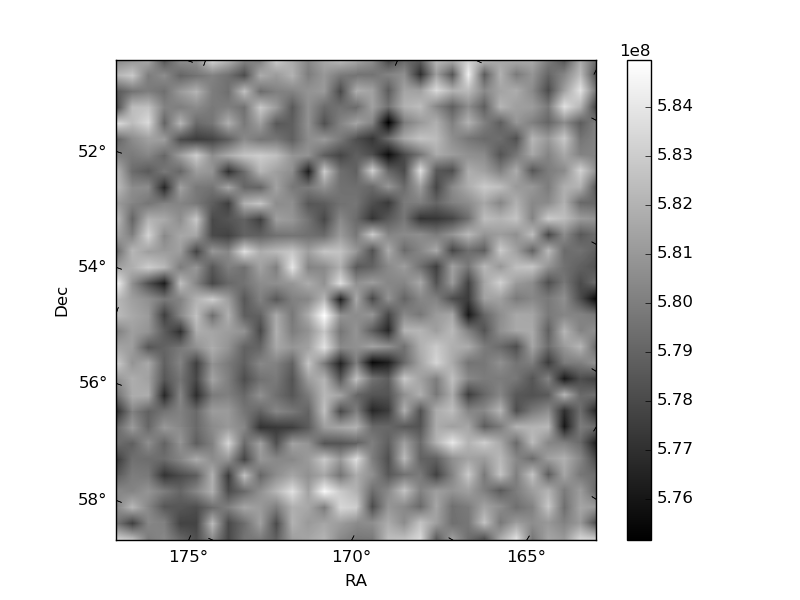
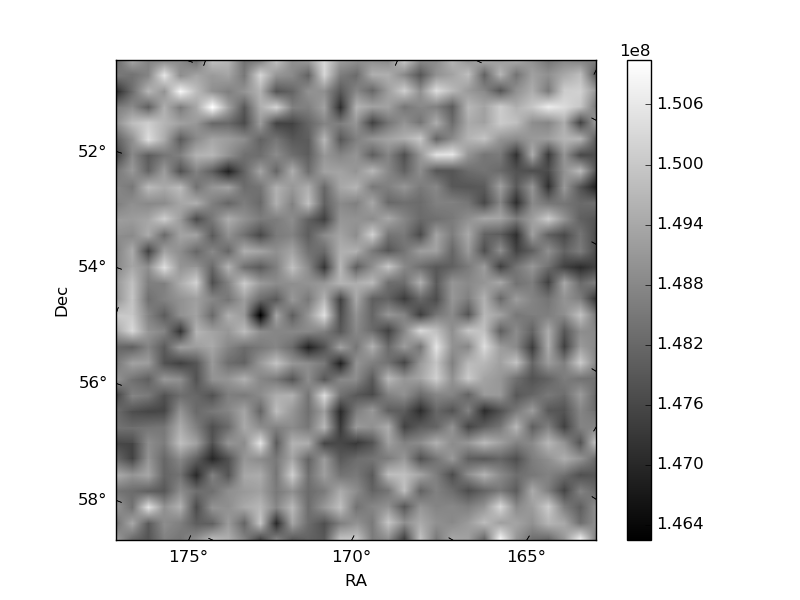
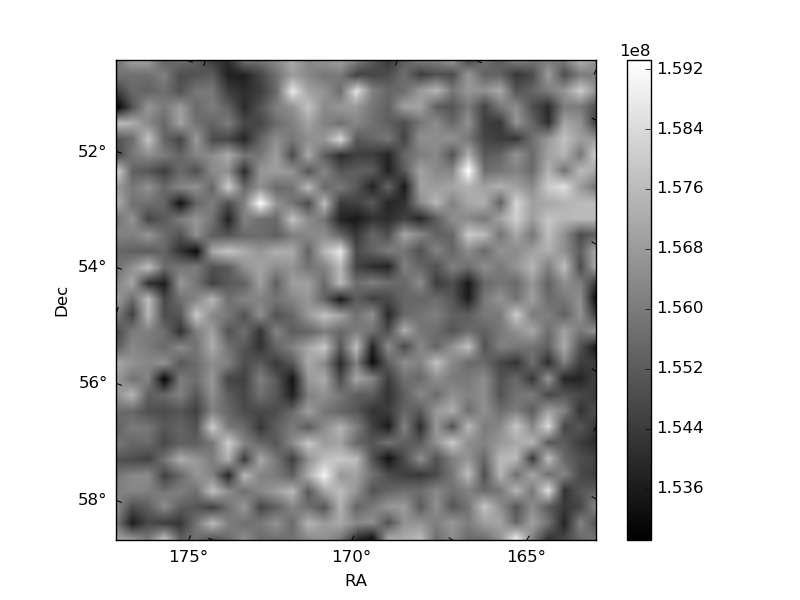
Histogram calculated using DETX and DETY for each event in the final _common_clean file
| Quadrant A | 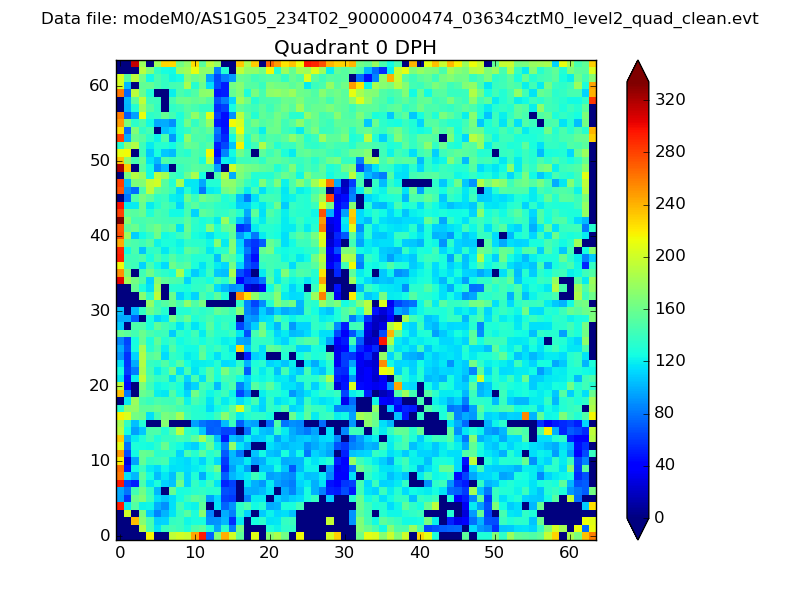 |
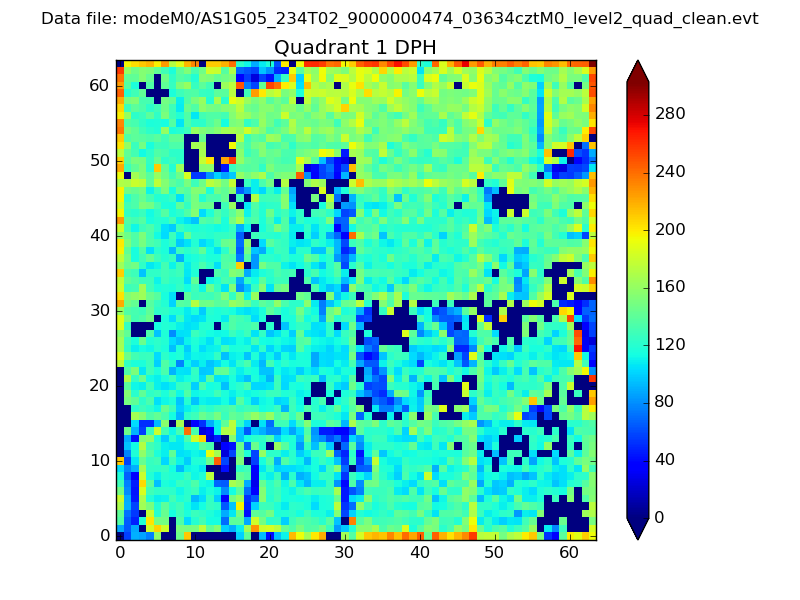 |
Quadrant B |
|---|---|---|---|
| Quadrant D | 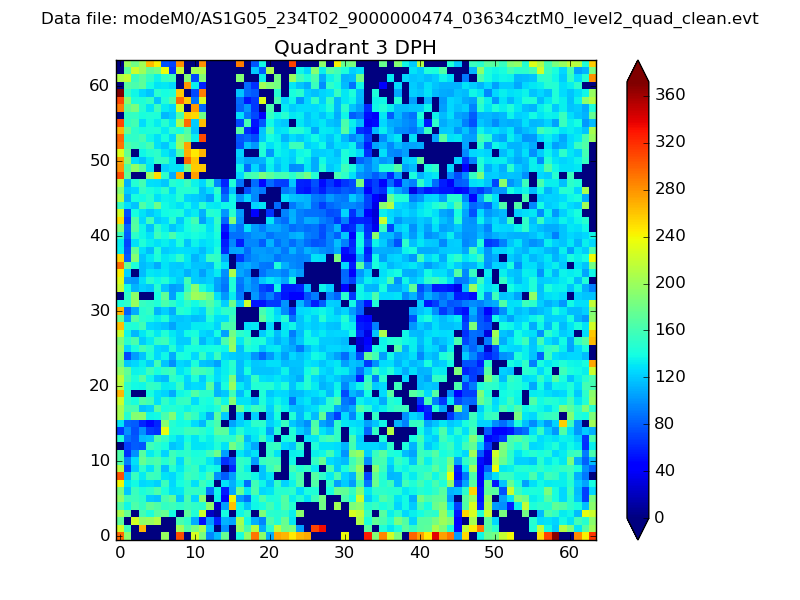 |
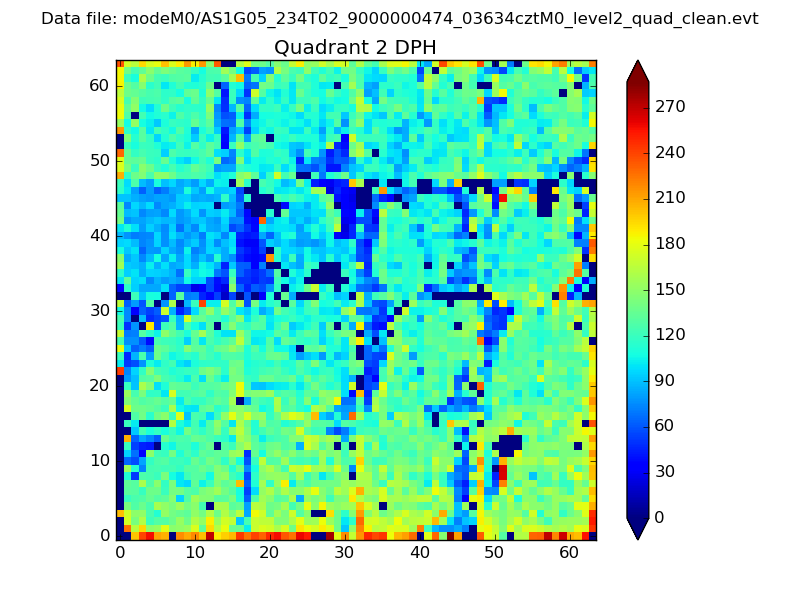 |
Quadrant C |
| Plot type | Count rate plots | Images |
|---|---|---|
| Comparison with Poisson distribution Blue bars denote a histogram of data divided into 1 sec bins. Red curve is a Poisson curve with rate = median count rate of data. |
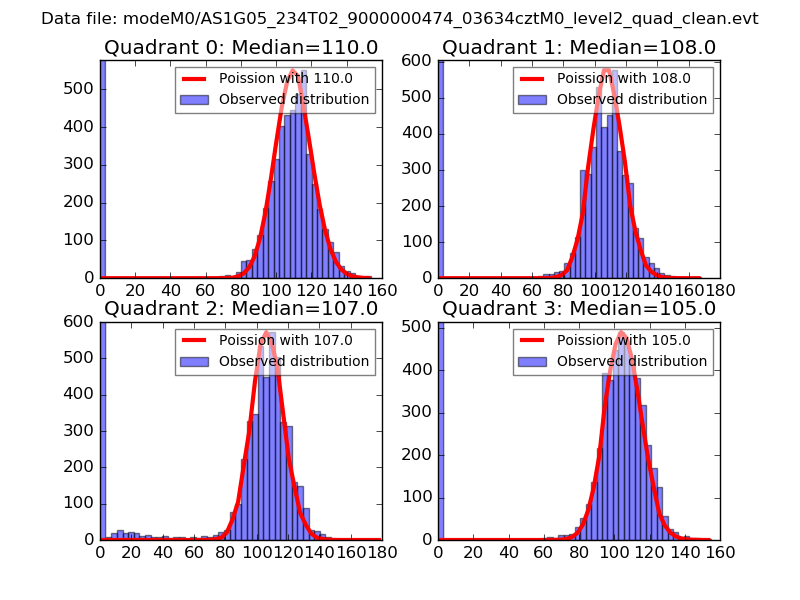 |
 |
| Quadrant-wise count rates Data is divided into 100 sec bins |
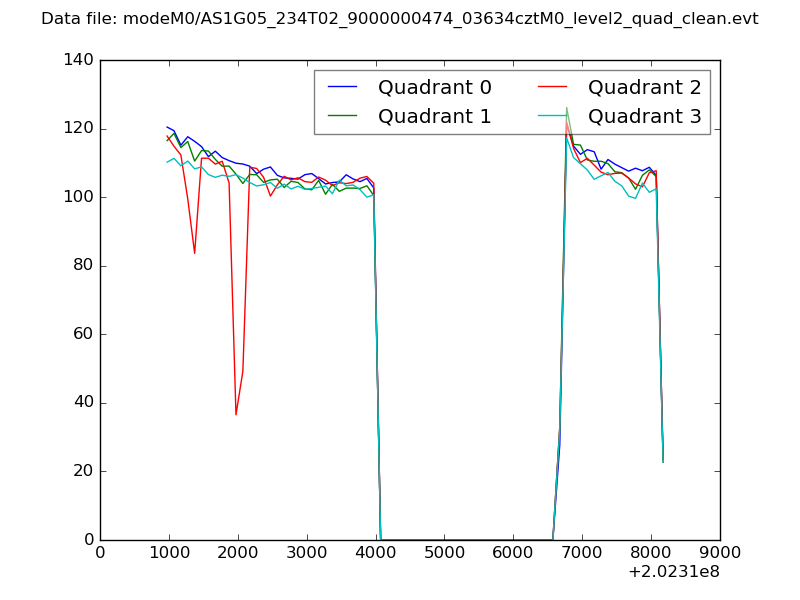 |
|
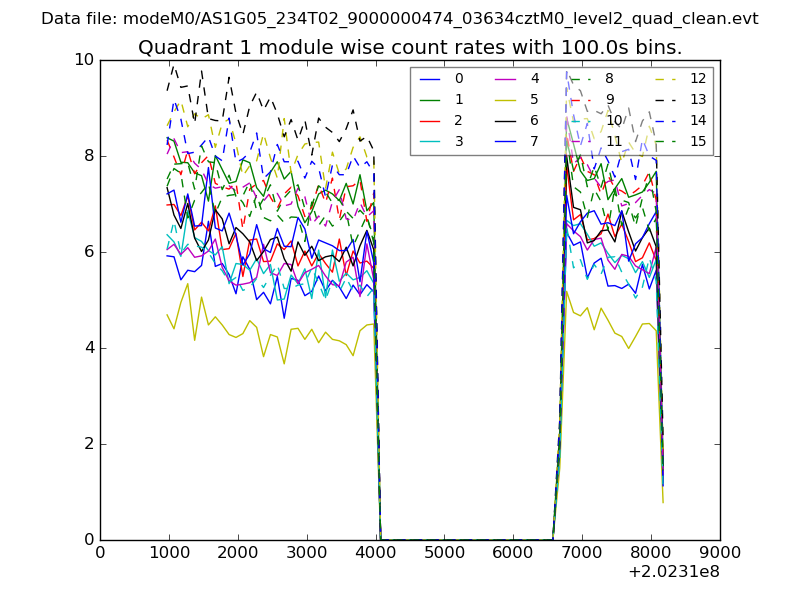
| Module-wise count rates for Quadrant A Data is divided into 100 sec bins |
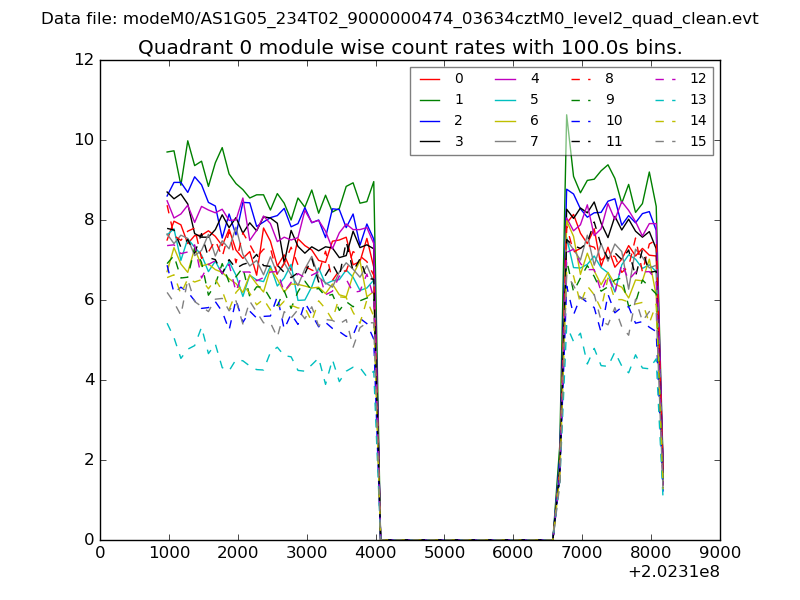 |
 |
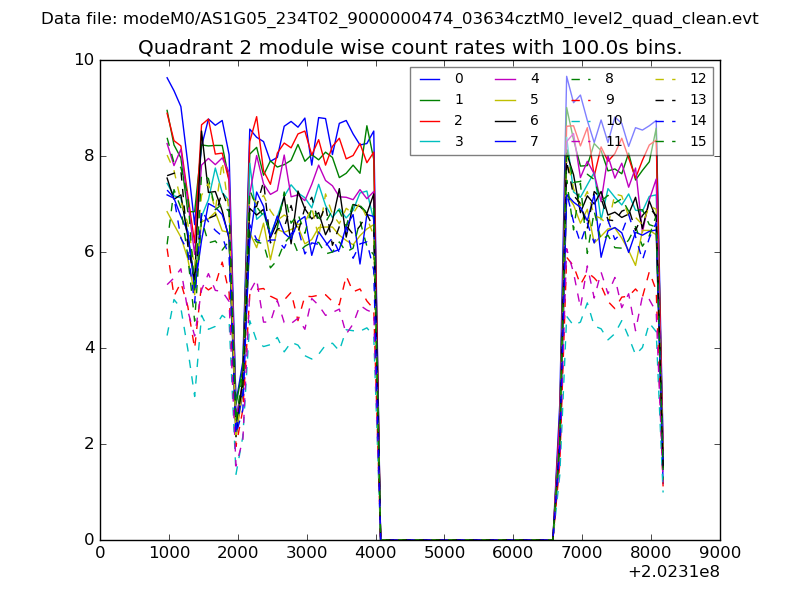
| Module-wise count rates for Quadrant B Data is divided into 100 sec bins |
 |
 |
| Module-wise count rates for Quadrant C Data is divided into 100 sec bins |
 |
 |
| Module-wise count rates for Quadrant D Data is divided into 100 sec bins |
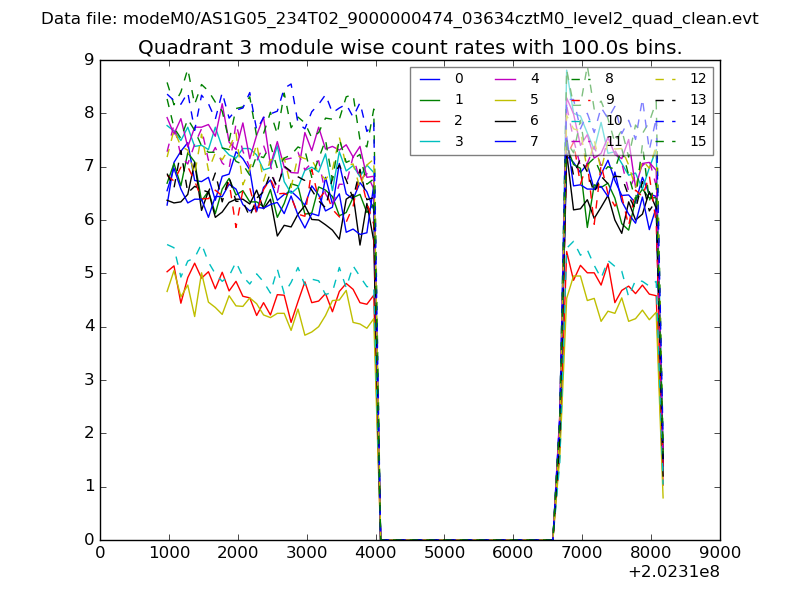 |
 |
| Parameter | Plot |
|---|---|
| CZT HV Monitor | 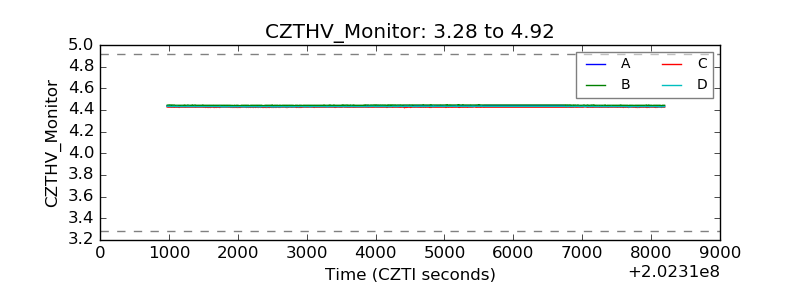 |
| D_VDD | 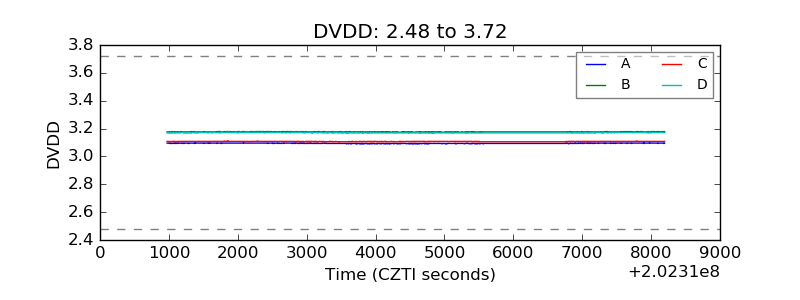 |
| Temperature 1 | 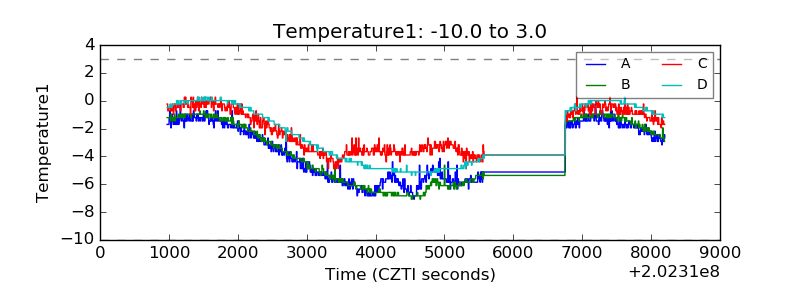 |
| Veto HV Monitor |  |
| Veto LLD | 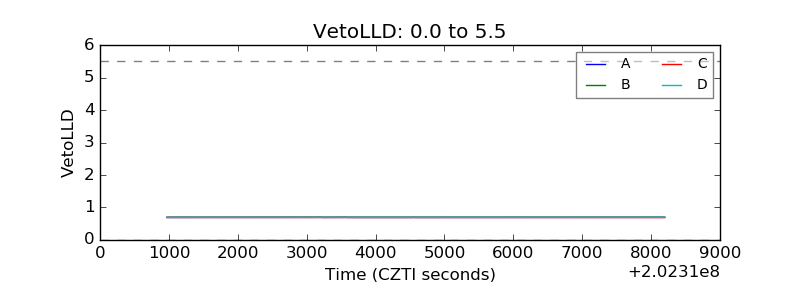 |
| Alpha Counter | 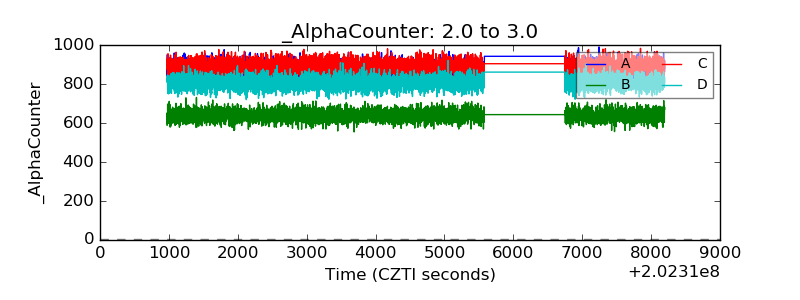 |
| _CPM_Rate | 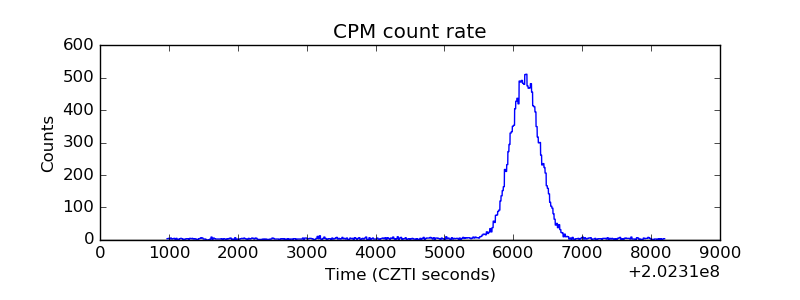 |
| CZT Counter | 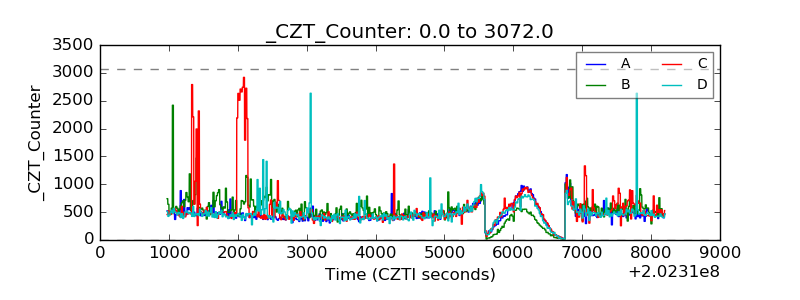 |
| +2.5 Volts monitor |  |
| +5 Volts monitor |  |
| Veto Counter | 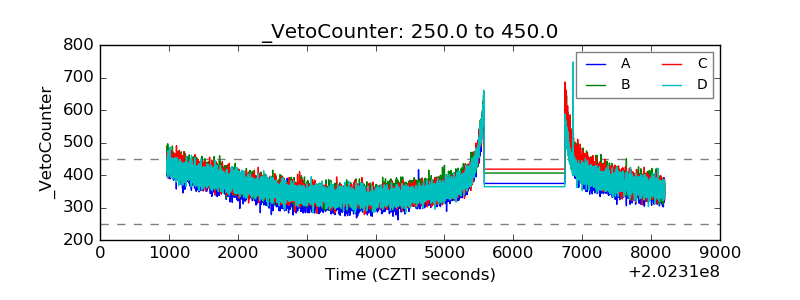 |