| Param | Original file | Final file |
|---|---|---|
| Filename | modeM0/AS1G05_234T02_9000000474_03635cztM0_level2.evt | modeM0/AS1G05_234T02_9000000474_03635cztM0_level2_quad_clean.evt |
| Size (bytes) | 456,589,440 | 76,654,080 |
| Size | 435.4 MB | 73.1 MB |
| Events in quadrant A | 2,950,302 | 475,736 |
| Events in quadrant B | 3,506,529 | 468,864 |
| Events in quadrant C | 4,002,890 | 467,665 |
| Events in quadrant D | 2,931,067 | 459,975 |
| Mode M9 | |||
|---|---|---|---|
| Quadrant | BADHDUFLAG | Total packets | Discarded packets |
| A | 0 | 9 | 0 |
| B | 0 | 9 | 0 |
| C | 0 | 9 | 0 |
| D | 0 | 9 | 0 |
| Mode SS | |||
|---|---|---|---|
| Quadrant | BADHDUFLAG | Total packets | Discarded packets |
| A | 0 | 132 | 0 |
| B | 0 | 132 | 0 |
| C | 0 | 132 | 0 |
| D | 0 | 132 | 0 |
| Mode M0 | |||
|---|---|---|---|
| Quadrant | BADHDUFLAG | Total packets | Discarded packets |
| A | 0 | 13289 | 2 |
| B | 0 | 14749 | 1 |
| C | 0 | 16421 | 1 |
| D | 0 | 13348 | 1 |
| Quadrant | Total seconds | Saturated seconds | Saturation percentage |
|---|---|---|---|
| A | 6429 | 32 | 0.497745% |
| B | 6429 | 83 | 1.291025% |
| C | 6429 | 64 | 0.995489% |
| D | 6429 | 44 | 0.684399% |
Noise dominated data is calculated using 1-second bins in cleaned event files. If a bin has >2000 counts, and if more than 50% of those come from <1% of pixels, then it is considered to be noise-dominated and hence unusable.
| Quadrant | # 1 sec bins | Bins with >0 counts | Bins with >2000 counts | High rate bins dominated by noise | Noise dominated (total time) | Noise dominated (detector-on time) | Marked lightcurve |
|---|---|---|---|---|---|---|---|
| A | 7419 | 6430 | 1 | 1 | 0.01% | 0.02% | 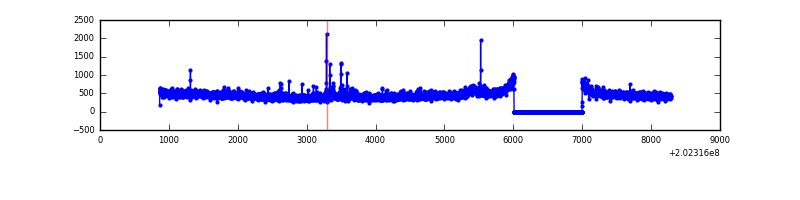 |
| B | 7419 | 6430 | 18 | 18 | 0.24% | 0.28% | 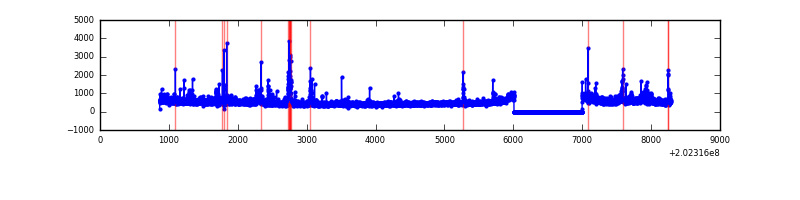 |
| C | 7419 | 6430 | 27 | 27 | 0.36% | 0.42% | 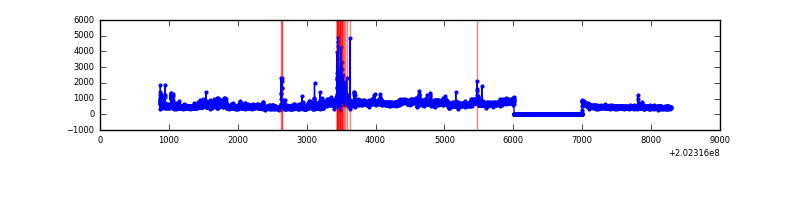 |
| D | 7419 | 6430 | 11 | 11 | 0.15% | 0.17% |  |
Top three noisy pixels from each quadrant. If the there are fewer than three noisy pixels in the level2.evt file, extra rows are filled as -1
| Pixel properties | Quadrant properties | ||||||
|---|---|---|---|---|---|---|---|
| Quadrant | DetID | PixID | Counts | Sigma | Mean | Median | Sigma |
| A | 3 | 1 | 46302 | 302.57 | 736 | 720 | 150.7 |
| A | 13 | 164 | 33371 | 216.73 | 736 | 720 | 150.7 |
| A | 12 | 194 | 8066 | 48.76 | 736 | 720 | 150.7 |
| B | 15 | 204 | 252632 | 1761.81 | 742 | 724 | 143.0 |
| B | 4 | 81 | 84952 | 589.08 | 742 | 724 | 143.0 |
| B | 4 | 239 | 73810 | 511.15 | 742 | 724 | 143.0 |
| C | 2 | 53 | 1023827 | 6107.84 | 719 | 722 | 167.5 |
| C | 9 | 247 | 129600 | 769.39 | 719 | 722 | 167.5 |
| C | 1 | 16 | 35760 | 209.17 | 719 | 722 | 167.5 |
| D | 8 | 195 | 54393 | 308.58 | 721 | 700 | 174.0 |
| D | 14 | 173 | 30501 | 171.27 | 721 | 700 | 174.0 |
| D | 2 | 33 | 24751 | 138.22 | 721 | 700 | 174.0 |
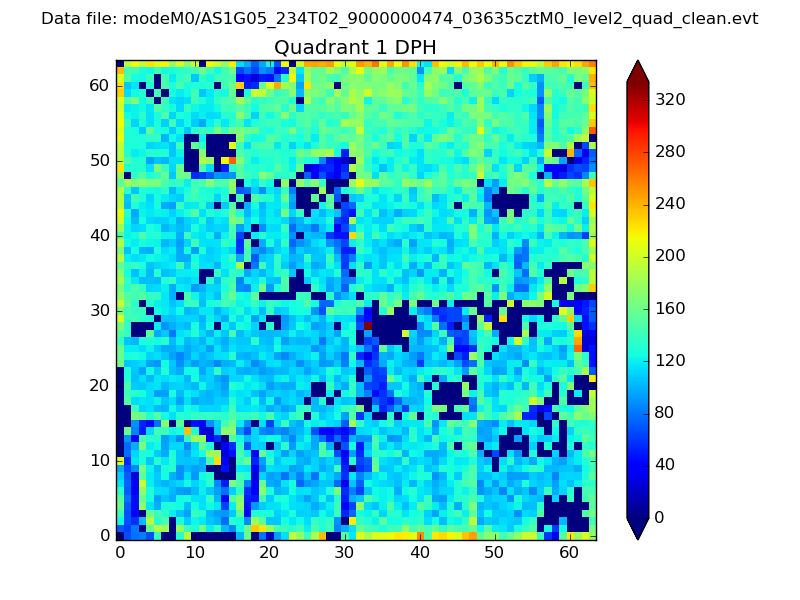
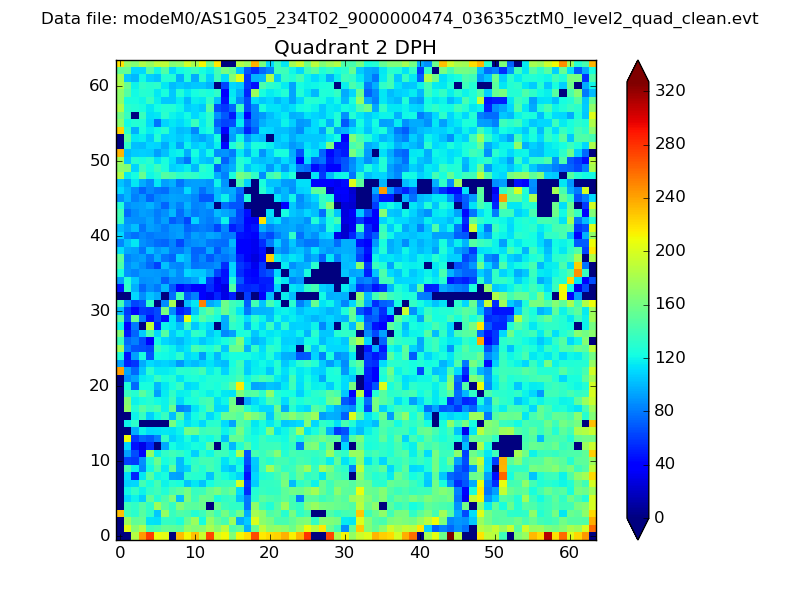
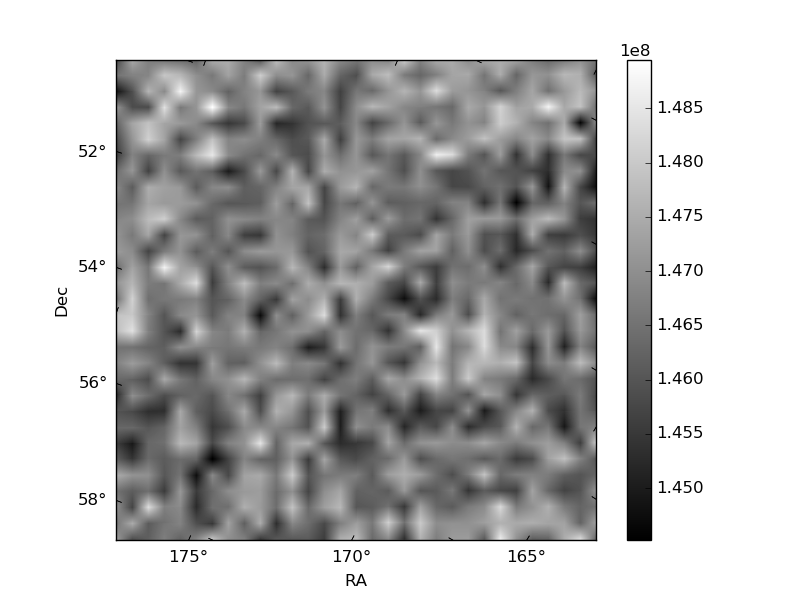
Histogram calculated using DETX and DETY for each event in the final _common_clean file
| Quadrant A | 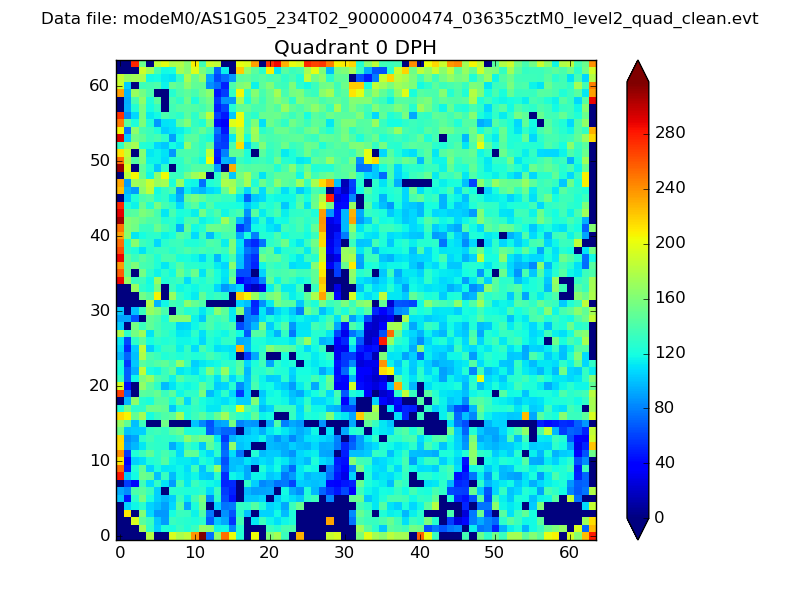 |
 |
Quadrant B |
|---|---|---|---|
| Quadrant D | 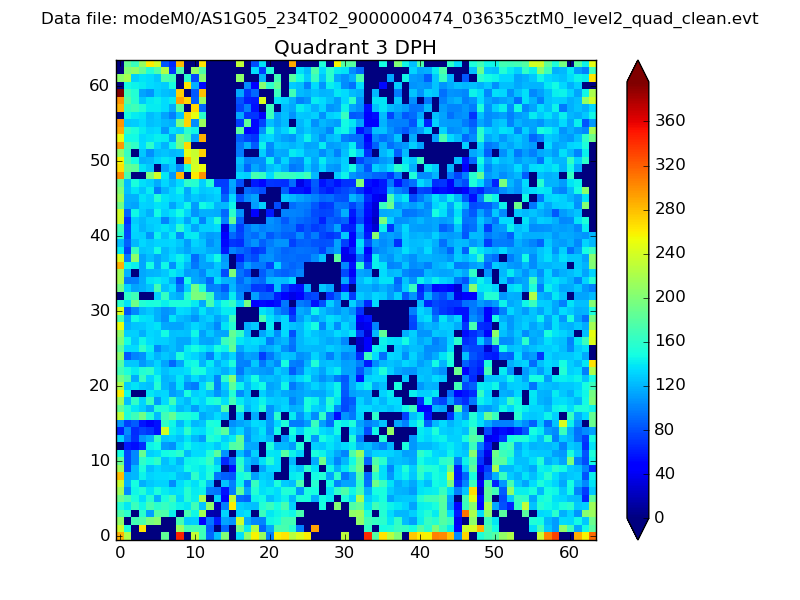 |
 |
Quadrant C |
| Plot type | Count rate plots | Images |
|---|---|---|
| Comparison with Poisson distribution Blue bars denote a histogram of data divided into 1 sec bins. Red curve is a Poisson curve with rate = median count rate of data. |
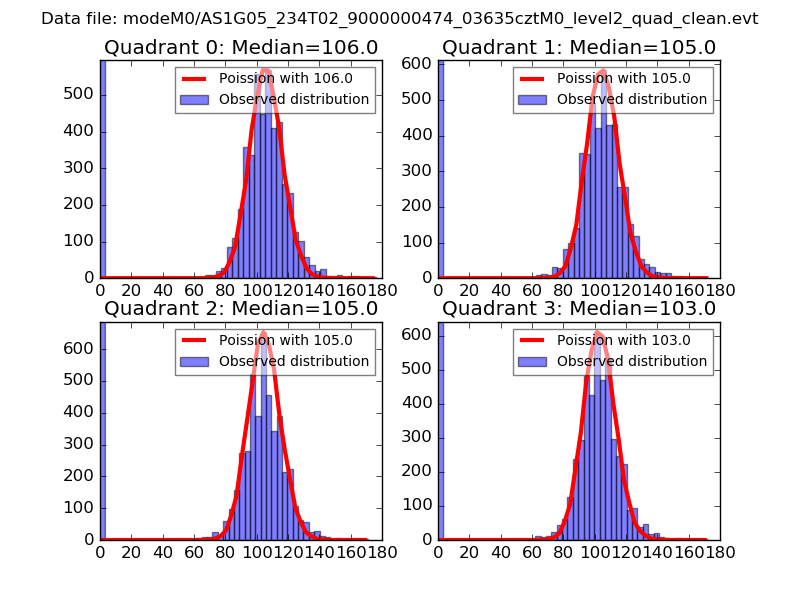 |
 |
| Quadrant-wise count rates Data is divided into 100 sec bins |
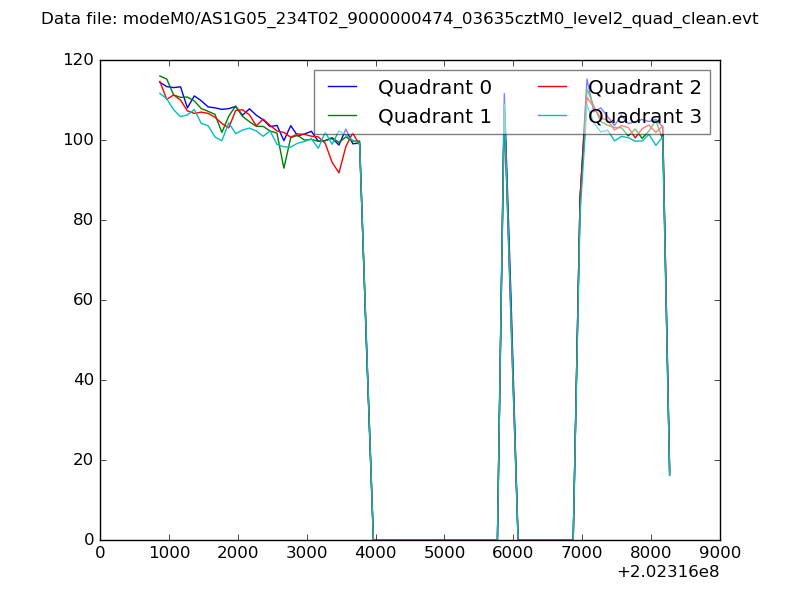 |
|
| Module-wise count rates for Quadrant A Data is divided into 100 sec bins |
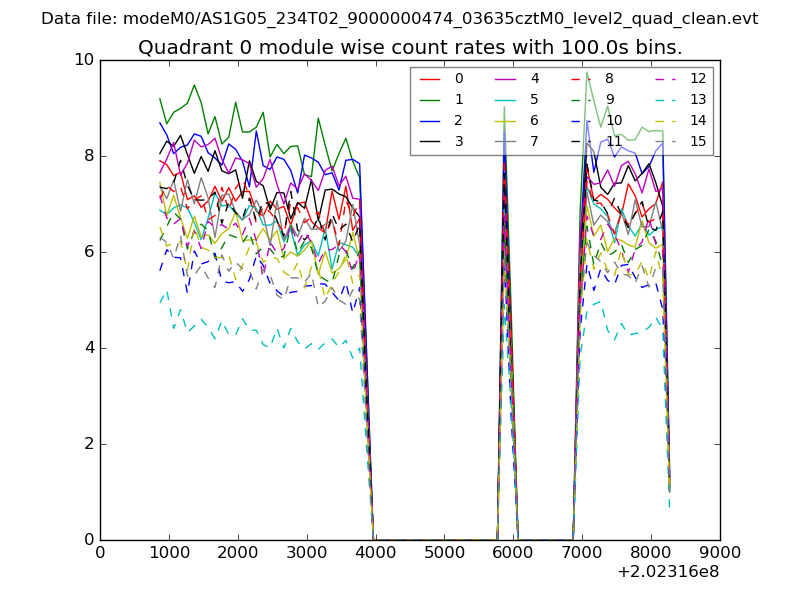 |
 |
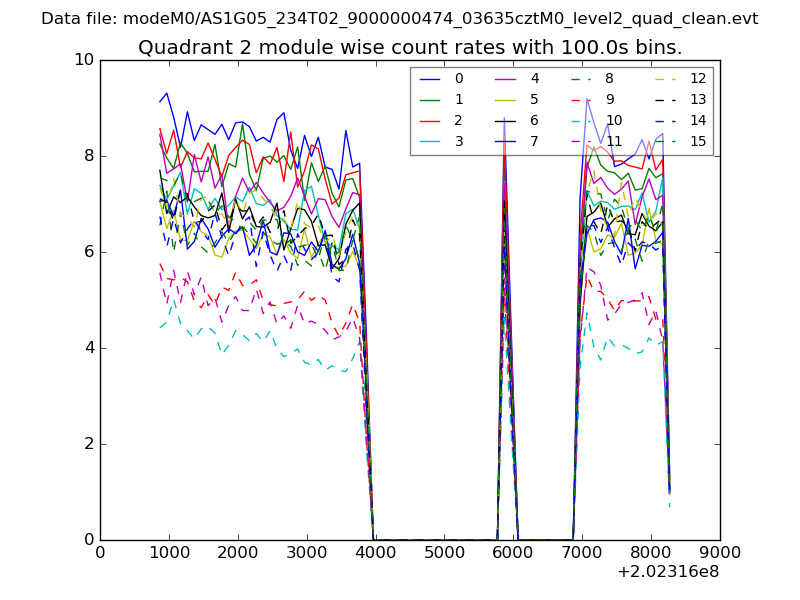
| Module-wise count rates for Quadrant B Data is divided into 100 sec bins |
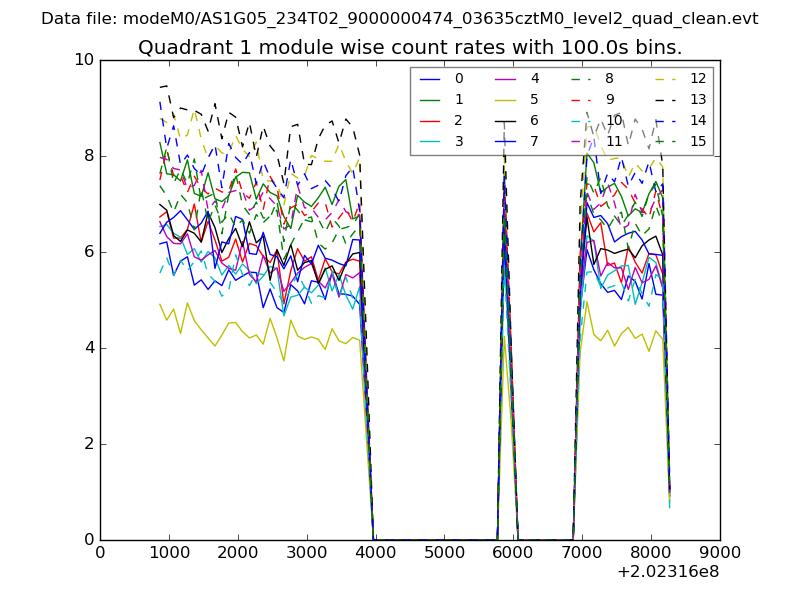 |
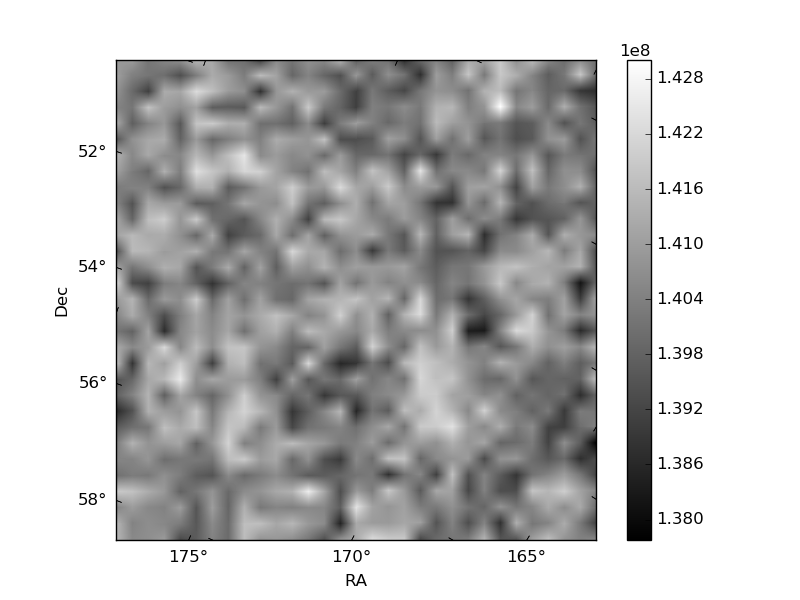 |
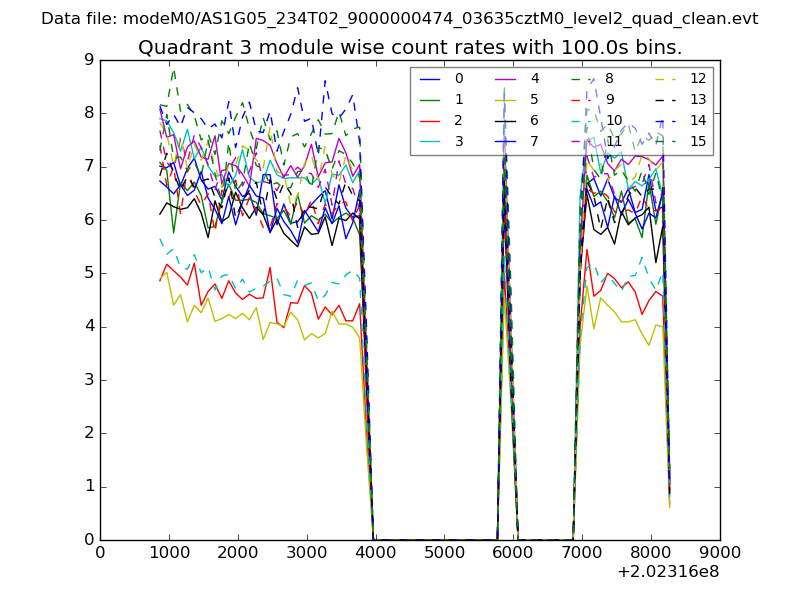
| Module-wise count rates for Quadrant C Data is divided into 100 sec bins |
 |
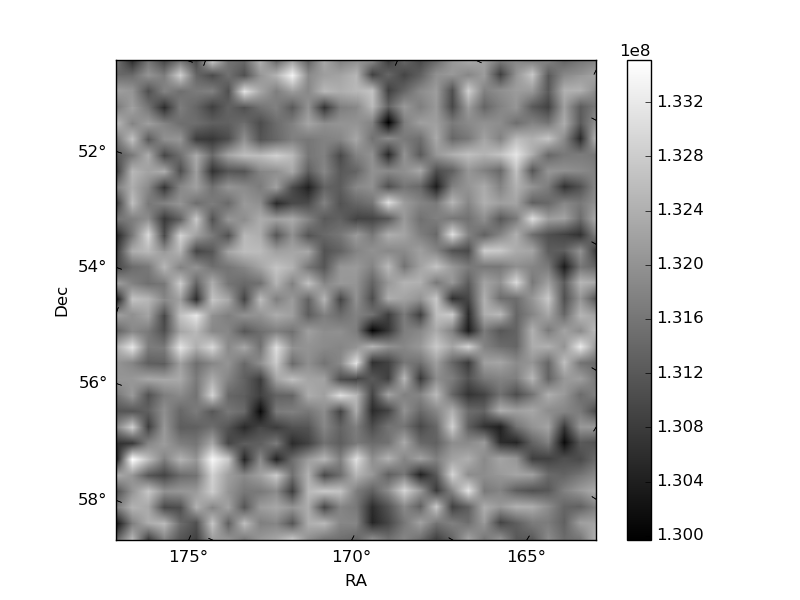 |
| Module-wise count rates for Quadrant D Data is divided into 100 sec bins |
 |
 |
| Parameter | Plot |
|---|---|
| CZT HV Monitor | 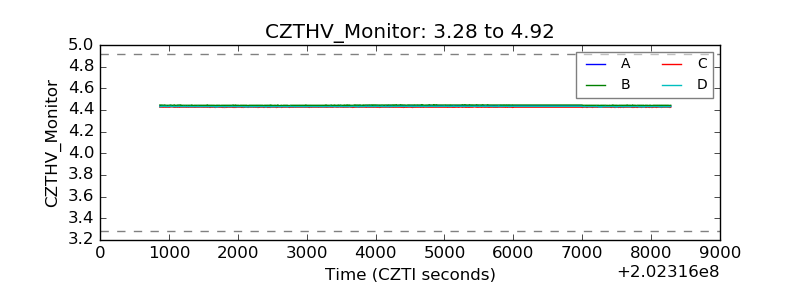 |
| D_VDD | 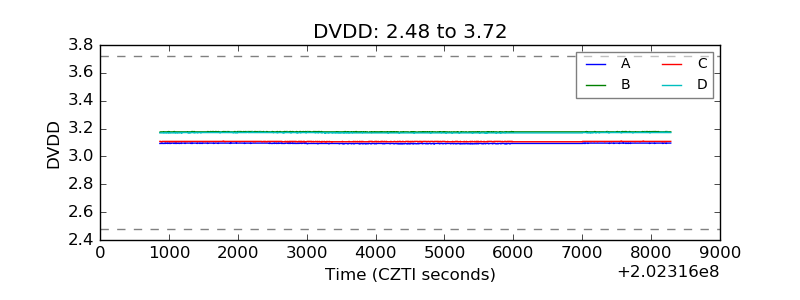 |
| Temperature 1 | 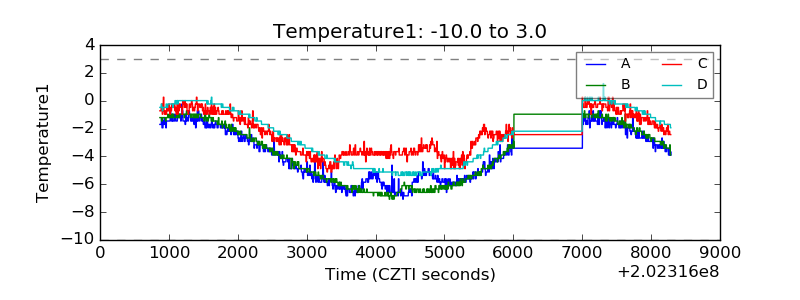 |
| Veto HV Monitor |  |
| Veto LLD | 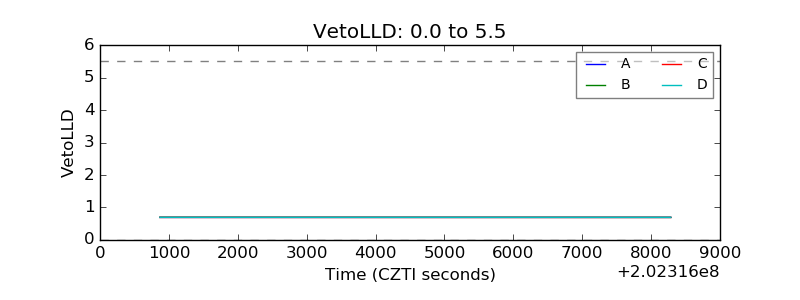 |
| Alpha Counter |  |
| _CPM_Rate | 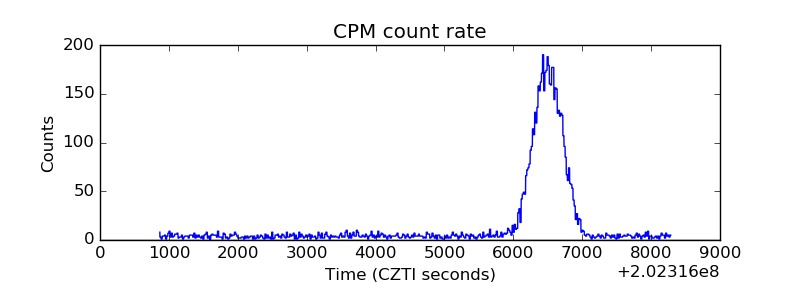 |
| CZT Counter | 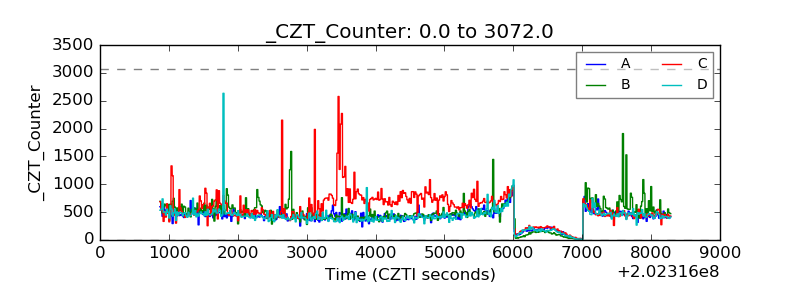 |
| +2.5 Volts monitor |  |
| +5 Volts monitor |  |
| Veto Counter | 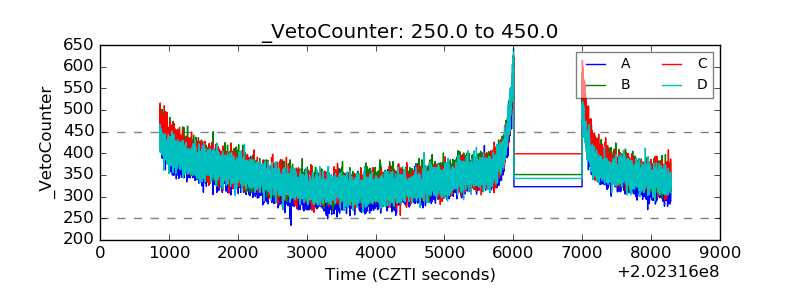 |